Trends and hotspots concerning lupus retinopathy from 2003 to 2022: a bibliometric analysis and knowledge graph study
'%20fill='white'%20fill-opacity='0.01'/%3e%3cmask%20id='mask0_3477_29692'%20style='mask-type:luminance'%20maskUnits='userSpaceOnUse'%20x='0'%20y='0'%20width='16'%20height='16'%3e%3crect%20id='&%23232;&%23146;&%23153;&%23231;&%23137;&%23136;_2'%20x='16'%20width='16'%20height='16'%20transform='rotate(90%2016%200)'%20fill='white'/%3e%3c/mask%3e%3cg%20mask='url(%23mask0_3477_29692)'%3e%3cpath%20id='&%23232;&%23183;&%23175;&%23229;&%23190;&%23132;'%20d='M14%205L8%2011L2%205'%20stroke='%23333333'%20stroke-width='1.5'%20stroke-linecap='round'%20stroke-linejoin='round'/%3e%3c/g%3e%3c/g%3e%3c/svg%3e)
关键词
摘要
全文
HIGHLIGHTS
This study is the first to apply bibliometric analysis in the field of lupus retinopathy (LR), using co-occurrence networks and clustering techniques to systematically map research trends, collaborations, and emerging hotspots over the past two decades.
Future research is expected to prioritize the integration of artificial intelligence (AI) with multimodal imaging, such as Optical Coherence Tomography Angiography (OCTA), to improve the precision and efficiency of lupus retinopathy diagnosis and monitoring.
Long-term cohort studies are needed to clarify the natural history of lupus retinopathy, including disease progression, risk factors, and the long-term effects of therapeutic interventions, providing a foundation for better prevention and management strategies.
INTRODUCTION
Bibliometric analysis is a quantitative research method that uses mathematics and statistics to extract measurable data from publications.[5-7] It is based on the building of citation maps, which enables researchers to visualize the interconnections of previous research and predict what future research trends will be.[6] Bibliometric analysis is a valuable tool that quantitatively evaluates academic publications by analyzing the number of publications, citations, and collaboration networks, revealing development trends and research hotspots in a discipline. Compared to traditional reviews, bibliometric methods can more objectively reflect the overall landscape of a research field, identify key research institutions, authors, and highly influential papers. In addition, bibliometric analysis can help in clinical decision making and guide future research. In the field of ophthalmology, bibliometric analysis has been increasingly popular in recent years.[8-11] However, a comprehensive analysis of trends and hot spots in LR is still lacking. In this study, we conducted a bibliometric analysis and citation analysis in the field of LR from 2003 to 2022 to provide beneficial information of hotspots and future trends to guide LR research.
METHOD
Search strategy and data retrieval
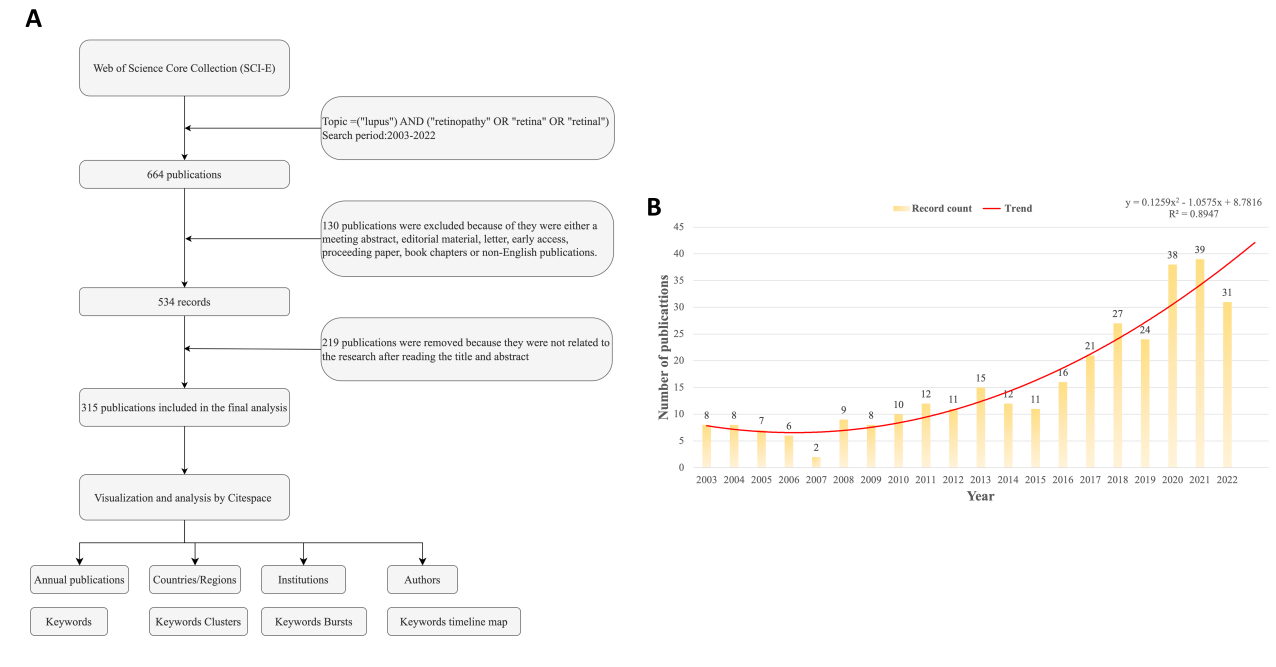
For this study, we selected Science Citation Index Expanded (SCI-Expanded) from the Web of Science Core Collection database (WOSCC). All literature published from 2003 to 2022 was included. The literatures search was conducted on August 1, 2023. We used the operator "and" to conduct a Boolean search on two lists. The following search structure was included in the first list: Topic = (“lupus”). The following was the second list of search structures: Topic = (“retinopathy” OR “retinal” OR “retina”).The basic information of all identified publications was downloaded including title, author, publication year, country, institution, journal, keywords, abstract, and citation references. The authors LHD and ZJY independently browsed and extracted data from eligible publications to ensure authenticity and avoid duplication. Finally, the intersection of both were taken. All searches were completed in a single day.
Inclusion and exclusion criteria
The search results were limited by language (English) and the publication year (2003 to 2022). 130 publications were excluded because of they were either a meeting abstract, editorial material, letter, early access, proceeding paper, book chapters or non- English publications. 219 publications were removed because they were not related to the LR research after carefully reading the title and abstract of each retrieved publication. Based on the description of the abstract, we determined whether the publication was a study of LR.Statistical analysis and visualization methods
CiteSpace (6.2.R4, creator Chaomei Chen) was used to perform the bibliometric analysis. Based on previous research, CiteSpace is a Java application aimed to identify trends in scientific literature.[12] CiteSpace was used for visual analysis, such as complex co-citation networks, cluster analysis, dual- map overlay of citations, timeline or time zone views, references, and keyword citation bursts.[6] In the network visualization analysis, the size of the nodes corresponds to the number of publications, while the colors of the nodes signify various clusters or periods. Cluster analysis can be used to categorize references and keywords as well as pinpoint crucial LR study areas. The Q-score quantifies the capability of clusters to build a co-cited reference network. The Q-score greater than 0.3 suggests that the cluster structure is substantial, with higher values suggesting a more organized cluster. Mean silhouette score (S-score) is an essential assessment parameter in cluster analysis. Definitions for the S-score include ">0.3" for homogeneous, ">0.5" for reasonable, and ">0.7" for extremely credible. The bursts of keywords and citations are frequently used to identify emerging research trends in an area.[13] Moreover, the development of research topics may be shown using the timeline view.The workflow of the research is presented as below (Figure 1A).
RESULTS
Annual trends of publications
Using the retrieval strategy mentioned above, a total of 315 LR-related publications were extracted and included. The overall amount of literature published increased from 2003 to 2022, although it fluctuated slightly from year to year (Figure 1B). These results showed that LR research rapidly increased from 2017 onwards. Among the different prediction models, the polynomial function had the highest R2 value (R2=0.895, followed by the exponential function (R2=0.875), and then the linear function (R2=0.767). As predicted by the prediction function (y=0.1259x2–1.0575x+8.7816), approximately 42 papers will be published in 2023.
Author analysis
A total of 856 authors were identified in this study. The ten most prolific authors contributed 49 papers (15.6%) from 2003 to 2022 (Table 1). The highest number of papers was published by the author Marmor MF, followed by Lee BR, Melles RB. Collaboration between these ten most prolific authors was shown in Figure 2A.
Table 1 Top 10 authors with publications in lupus retinopathy research, during 2003-2022.
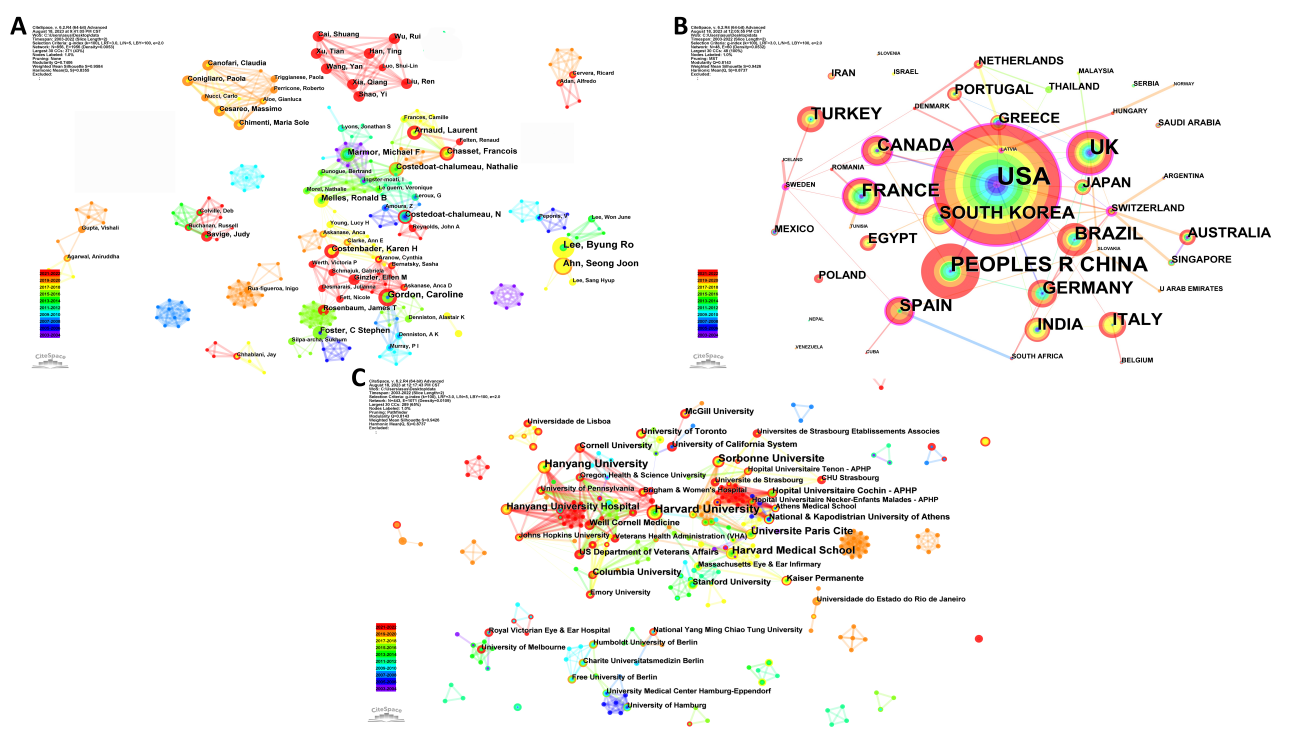
Figure 2 Analysis of Co-authorship relationship.
Countries analysis
In total, 48 countries were cited. In Figure 2B, the number of citations was shown by the size of each label and node area. The United Kingdom (UK) was formed by merging England, Scotland, Wales, and Northern Ireland. The United States, China, and UK had the three largest nodes, with 69, 32, and 24 articles, respectively (Table 2). The United States in particular has undertaken substantial study on LR and has collaborated closely with other nations to advance this field.
Table 2 Top 10 countries with publications in lupus retinopathy research, during 2003-2022.
|
Rank |
Country |
Counts |
Citations |
Average Citation/Publication |
|
1 |
USA |
69 |
3022 |
43.80 |
|
2 |
China |
32 |
803 |
25.09 |
|
3 |
UK |
24 |
898 |
37.41 |
|
4 |
France |
20 |
456 |
22.80 |
|
5 |
Brazil |
19 |
84 |
4.42 |
|
6 |
South Korea |
18 |
266 |
14.78 |
|
7 |
Canada |
16 |
442 |
27.63 |
|
8 |
Germany |
16 |
1344 |
86 |
|
9 |
Spain |
15 |
153 |
10.2 |
|
10 |
Italy |
15 |
652 |
43.47 |
Institutions analysis
The ten most prolific institutions among the selected articles were shown in Table 3. The top three institutions were Stanford University, Hanyang University, and Harvard Medical School. Two of these institutions are from the United States. In Figure 2C, the size of the nodes correlates positively with the number of publications of each institution. Moreover, the linkage between the nodes symbolizes the institutions' cooperative relationship.
Table 3 Top 10 institutions in the study of lupus retinopathy, during 2003-2022.
|
Rank |
Institutions |
Country |
Count |
|
1 |
Stanford University |
USA |
8 |
|
2 |
Hanyang University |
South Korea |
8 |
|
3 |
Harvard Medical School |
USA |
7 |
|
4 |
Cairo University |
Egypt |
6 |
|
5 |
Birmingham University |
UK |
6 |
|
6 |
Washington University |
USA |
6 |
|
7 |
Toronto University |
Canada |
5 |
|
8 |
Harvard University |
USA |
5 |
|
9 |
Roma Tor Vergata University |
Italy |
5 |
|
10 |
Sao Paulo University |
Brazil |
5 |
Keyword analysis
Figure 3A showed the keyword co-occurrence network for LR research from 2003 to 2022. Notably, apart from “retinopathy” and “systemic lupus erythematosus”, “hydroxychloroquine” was the most common keyword, followed by “optical coherence tomography” and “optical coherence tomography angiography”. As shown in Figure 3B, the keyword co- occurrence clusters showed well-structured networks and high confidence clusters (Q=0.74, S=0.94). A total of ten clusters were shown, #0 systemic lupus erythematosus, #1 retinopathy, #2 retinal toxicity, #3 antimalarial, #4 hydroxychloroquine, #5 optical coherence tomography, #6 antiphospholipid syndrome, #7 microvascular, #8 optic neuritis, #9 optical coherence tomography angiography.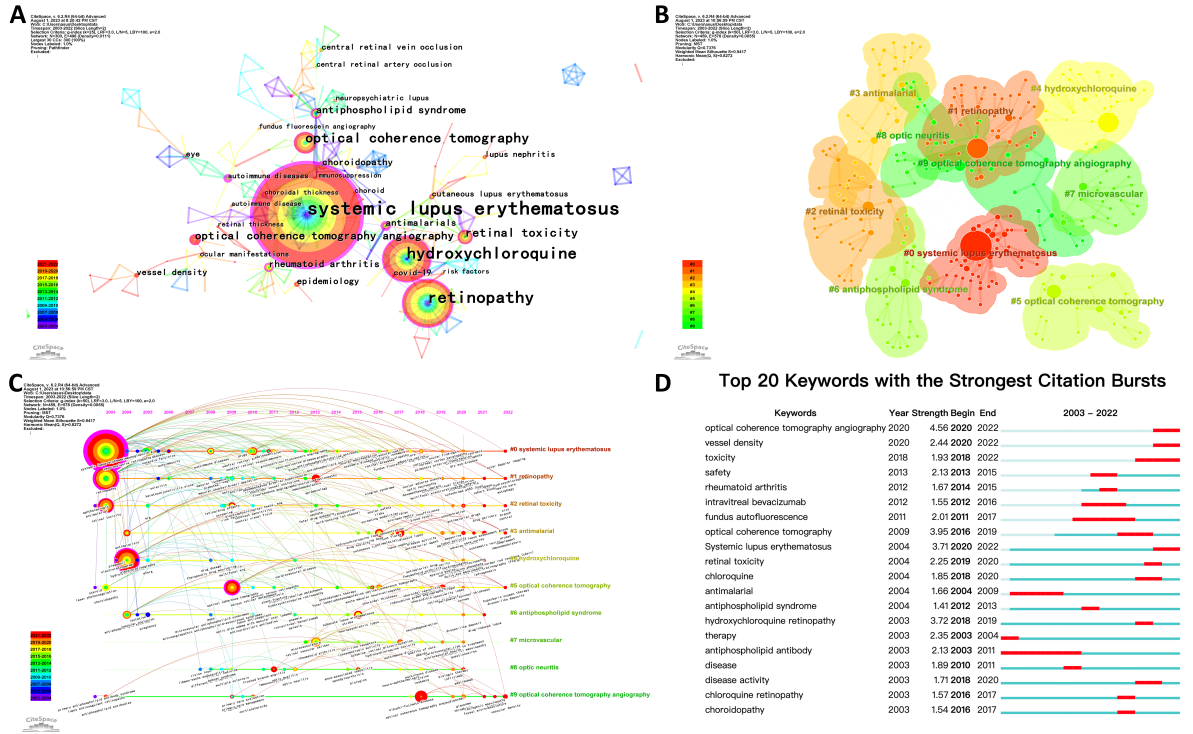
Based on the cluster map, a timeline map can be obtained. As shown in Figure 3C, the timeline map depicted how the 10 identified cluster subfields have changed over time and how research has progressed. For example, #9 optical coherence tomography angiography had much more citation and high-quality studies in 2018 through 2022.
Burst detection analysis may identify a substantial shift in the number of citations over a set period of time to indicate the fall or growth of a keyword. Burst keywords had an increase in citation frequency within a short period, indicating that this keyword is the current hot spot. As shown in Figure 3D, the outbreak intensity of “optical coherence tomography angiography” was the strongest, followed by “optical coherence tomography” and “hydroxychloroquine retinopathy”.
DISCUSSION
This is the first study to analyze the global research status, trends and hotspots of lupus retinopathy (LR) from 2003 to 2022 based on a total of 315 documents, which provides valuable information to track cutting- edge progress and for future cooperation between various authors and institutions. In recent years, research on the use of OCTA for the early diagnosis of SLE has received increasing attention. The large increase in the number of publications confirms the growing importance of this research. This study, as the first LR study with the help of bibliometrics, identifies the top 10 authors, countries and institutions publishing in this field from 2003-2022, and visualizes co-authorship relationships, revealing the trend of lupus retinopathy in recent years. Ophthalmologists can use our work to gain a comprehensive understanding of the hotspots and cutting-edge developments in the field, and to identify areas where further research is still needed.Global Trends
Since 2003, the number of papers on LR research has increased. During 2003 to 2010, fewer than ten LR publications were published annually. However, after 2017, the number of publications increased rapidly, averaging more than 25 per year. This trend is likely to continue, based on the polynomial prediction function. More than 856 authors from 443 institutions in 48 countries have published in the field. In this study, the United States led in terms of quantity and quality with the highest number of publications and total citations among all countries.Research Hotspots
By analyzing keyword co-occurrences (Figure 3A&B), knowledge structures and hotspots were classified. The main clusters generated were “hydroxychloroquine”, “optical coherence tomography”, “optical coherence tomography angiography” and “retinal toxicity”.One of the hot topics of research is the effect of hydroxychloroquine (HCQ) on LR. HCQ is an important treatment for SLE.[14] It has been known for years that HCQ is toxic to the retina, and it remains a significant concern in many countries.[15] It is important to note that the retinopathy caused by HCQ toxicity cannot be reversed. To date, no treatment has been shown to be effective in preventing, treating, or reducing the risk of retinopathy caused by HCQ. The typical clinical presentation of HCQ toxicity is bilateral bull’s-eye maculopathy.[16] In the beginning, patients may notice paracentral scotomas, but toxicity can progress even after discontinuing the drug and eventually result in more severe vision loss.[16]
There is no clear understanding of the mechanism of HCQ toxicity. Toxic effects may be caused by HCQ binding to melanin in the retinal pigment epithelium (RPE).[17] According to Melles et al., an overall prevalence of 7.5% was found for HCQ retinopathy among 2 361 patients who had been treated with HCQ over five years.[18] In addition, Melles et al. found an overall risk of HCQ retinopathy of 8.6% after 15 years of long-term HCQ treatment in their most recent study.[19] Melles et al. also noted that the risk of HCQ toxicity is closely related to dosage, with a significantly increased incidence when the daily dose exceeds 5 mg/kg. Due to this, the American Academy of Ophthalmology (AAO) periodically updates its guidelines on HCQ retinopathy with updated dosage recommendations, risk factors for HCQ toxicity, and clinical screening methods.[16, 20-21] HCQ is recommended for treating SLE and some other inflammatory diseases, but long-term use can cause serious retinopathy. Additionally, HCQ treatment can lead to retinal microvascular damage, including in Chinese patients.[22-23] Therefore, HCQ retinal toxicity is one of the current research hotspots in lupus retinopathy. It is necessary to conduct in-depth studies on the molecular mechanisms of HCQ retinal toxicity, in order to find potential targets for treatment and provide a theoretical basis for better treatment of SLE.
Another hotspot, is the use of Optical Coherence Tomography Angiography (OCTA) as an early screen for LR. The imaging manifestations of LR primarily include reduced retinal thickness and vessel density.Optical Coherence Tomography Angiography (OCTA) is a non-invasive imaging technique that provides clear images of changes in retinal microvasculature, such as decreased vessel density and microvascular occlusion, making it a valuable tool for early diagnosis and monitoring of LR. [24- 25] Importantly, LR is common in SLE and the presence of LR is an important indicator of the severity of the disease.[26] In recent years, a number of studies using OCTA have found that SLE patients have decreased retinal thickness and vessel density.[27-32] Bao et al. found a significant reduction in superficial vessel density and thinning of the inner retina in patients with SLE.[32] Liu et al. found that retinal thickness (RT) and superficial vessel density were significantly decreased in SLE patients compared to normal controls, and the area under the receiver operating characteristic curve (AUC) for the inner RT was 0.805, suggesting RT may be a potential marker for the diagnosis of SLE.[30] Yılmaz Tuğan et al. found that juvenile systemic lupus erythematosus (JSLE) patients had significantly lower deep capillary plexus vessel density parameters. The changes in these parameters can potentially be used to differentiate JSLE patients and make early diagnosis of LR possible.[31]
However, most existing studies were cross-sectional with small sample sizes, so a definitive conclusion cannot yet be drawn. Therefore, further analysis alterations in retinal OCTA parameters in patients with SLE will require larger sample sizes and corresponding cohort studies in the future. This will provide more comprehensive evidence for early screening of patients with LR, leading to early prevention and early treatment. In addition, current studies mainly assess the diagnostic value of single OCTA parameters for LR, but this does not fully capture the dynamic changes in retinal vessel density. Future research should include periodic OCTA assessments to calculate the rate of short-term retinal vessel density decline, representing recent retinal microvascular damage. Longitudinal analysis of dynamic changes will help predict the long-term risk of LR and provide more precise grounds for early intervention and prevention.
In the burst keywords analysis of Figure 3D, the keywords "optical coherence tomography angiography" and "vessel density" have shown persistence after explosion in recent years, indicating that this area is at the forefront of current research. Using OCTA techniques to assess retinal vessel density in patients with SLE for the screening of LR is a current research hotspot.
Trends in future research
Multimodal imagingIn addition to OCTA, other techniques are available for examining LR, such as fundus photography, indocyanine green angiography (ICGA), fluorescein angiography (FA), fundus autofluorescence (FAF), etc. Various imaging techniques have their own advantages and disadvantages and assess the disease from different aspects. Currently, no single method has been able to provide all the information that can be associated with a particular disease. We believe that all these imaging techniques complement each other. Therefore, the integration of information provided by different imaging techniques allows for a more comprehensive assessment of the disease. For example, the latest imaging technology, ultra-widefield (UWFTM) retinal imaging integrates retinal color fundus photographs, FAF, FA, ICGA and swept-source OCT, providing high-resolution retinal imaging in 200° capture images. Li et al. found that UWF showed excellent performance in detecting diabetic retinopathy.[33] This approach improves the evaluation of patients and provides a better understanding of different retinal pathologies. Hence, using multimodal imaging combined with multiple examination techniques to assess LR is and will be one of the future research trends.
Artificial intelligence
Artificial intelligence (AI) technologies have made significant advances in clinical medicine, especially in diagnostic imaging. The power of AI is due to the advent of deep learning (DL) algorithms. It is capable of detecting and "learning" disease features from large amounts of image data and subsequently demonstrating high accuracy and reliability in "new" datasets.[34] For example, Ruamviboonsuk et al. have used a deep learning system to achieve real-time detection of diabetic retinopathy and validate its feasibility in large-scale screening.[35] This facilitates the early diagnosis and early treatment of diabetic retinopathy, thus promoting the management of diabetic patients. In addition, artificial intelligence can reduce diagnostic and treatment errors and promote personalized medicine.[36] Therefore, combining AI to assess LR is one of the future research trends.
Limitations
Even though the bibliometric analysis is relatively comprehensive and objective, there are still some limitations to this study. First, we only analyzed articles written in English, and many journals published in other languages also deserve attention. Second, some novel, high-quality publications may be overlooked because their citation frequency is lower, while older articles tend to receive more citations. Lastly, in spite of the fact that WOSCC is the most commonly used and recommended database for bibliometric analysis, it may not include some important publications. Therefore, other databases, such as PubMed or Scopus, should be used to verify our results.CONCLUSION
In this study, we reviewed studies on LR and comprehensively analyzed trends over the past 20 years. In particular, the United States, China and UK have held the leading position in LR research. Early diagnosis of LR using OCTA is a current research hotspot. More importantly, combining multimodal imaging and artificial intelligence to assess LR may be future research trends. Based on the bibliometric analysis of research status and trends in LR, global researchers can grasp hotspots in LR research and guide the future direction of LR research.Correction Notice
NoneAcknowledgement
NoneAuthor Contributions
(I) Conception and design: Huangdong Li, Jingyu Zhang, Zhiping Liu(II) Administrative support: Zhiping Liu
(III) Provision of study materials or patients: None (IV) Collection and assembly of data: Quan Lv, Wangjian Qiu, Qian Deng, Li Wang
(V) Data analysis and interpretation: Huangdong Li, Jingyu Zhang
(VI) Manuscript writing: Huangdong Li, Jingyu Zhang, Amy Michelle Huang, Zhiping Liu
(VII) Final approval of manuscript: All authors