Economic outcomes of AI-based diabetic retinopathy screening: a systematic review and meta-analysis
'%20fill='white'%20fill-opacity='0.01'/%3e%3cmask%20id='mask0_3477_29692'%20style='mask-type:luminance'%20maskUnits='userSpaceOnUse'%20x='0'%20y='0'%20width='16'%20height='16'%3e%3crect%20id='&%23232;&%23146;&%23153;&%23231;&%23137;&%23136;_2'%20x='16'%20width='16'%20height='16'%20transform='rotate(90%2016%200)'%20fill='white'/%3e%3c/mask%3e%3cg%20mask='url(%23mask0_3477_29692)'%3e%3cpath%20id='&%23232;&%23183;&%23175;&%23229;&%23190;&%23132;'%20d='M14%205L8%2011L2%205'%20stroke='%23333333'%20stroke-width='1.5'%20stroke-linecap='round'%20stroke-linejoin='round'/%3e%3c/g%3e%3c/g%3e%3c/svg%3e)
关键词
摘要
全文
HIGHLIGHTS
· AI-based diabetic-retinopathy screening (DR) is cost-effective from a healthcare system perspective, particularly in high-income countries.· By pooling incremental net benefit (INB) estimates for various AI-based comparisons and stratifying analyses according to the identified heterogeneity, our meta-analysis quantified the economic costs and health outcomes of AI-based DR screening, to assist the future guidance of AI-enabled DR screening programs worldwide.
· Given its advantages in reducing healthcare disparities and optimizing resource allocation, AI has the potential to become a powerful tool for DR screening. Heterogeneity in cost-effectiveness across different perspectives highlights the importance of context-specific evaluations, to accurately evaluate the potential of AI-based DR screening in reducing global healthcare disparities.
INTRODUCTION
Artificial intelligence (AI) has become a transformative tool in healthcare, particularly in medical image analysis for early disease detection[1]. Its application has been especially successful in diabetic retinopathy (DR), a top leading cause of blindness among working-age adults. DR affects around one in three diabetic individuals [2], with the age-standardized global prevalence of blindness due to DR increased from 14.9% to 18.5% between 1990 and 2020, imposing significant healthcare and socioeconomic burdens[3]. In this context, AI-based systems have shown high accuracy and efficiency in detecting DR from retinal images[4,5]. By facilitating early detection and timely intervention, AI-based DR screening strategies hold the potential to improve patient care, expand access to expertise in remote areas, and address the global health burden posed by DR[6].Despite the promising performance of AI-based DR screening, the value and feasibility of this software as a medical device for widespread implementation widespread implementation in real-world clinical settings require careful assessment. Heath-economic evaluations, such as cost-effectiveness analysis, are essential for understanding the potential benefits of AI and for guiding policymaking and resource allocation[7,8]. Over the past decade, numerous studies have evaluated the economic costs and health outcomes of AI-based DR screening in countries such as Brazil, China and the United States. However, their findings were inconsistent, partially due to differences in study focus, context and methodologies[9–13]. As a result, decision-makers often face overwhelming amounts of information and conflicting conclusions, which complicates the formation of clear policy directives. While some evaluations provide only descriptive summaries without standardized effect measures, this lack of quantitative synthesis makes it difficult to integrate results or pinpoint sources of heterogeneity. Moreover, disparities in income levels, healthcare systems, and research perspectives further hinder the generalizability of conclusions across different settings, especially in countries where context-specific economic evaluations are not available.
To address these gaps, we performed a systematic review and meta-analysis to quantify the economic costs and health outcomes of AI-based DR screening, providing a quantitative assessment of its performance from a health-economic perspective. By pooling incremental net benefit (INB) estimates for various AI-based comparisons and stratifying analyses according to the identified heterogeneity, our study aims to provide robust evidence to inform policy-making and assist the future guidance of AI-enabled DR screening programs worldwide.
METHODS
This systematic review and meta-analysis was performed following the Preferred Reporting Items for Systematic Reviews and Meta-Analyses Protocols[14] and was registered at PROSPERO (No. CRD42024583940).Data Sources and Search Strategy
A systematic search of the literature was conducted on 1st September 2024 across multiple databases, including PubMed, Scopus, Embase, the Cochrane Library, the National Health Service Economic Evaluation Database, and the Cost-Effectiveness Analysis Registry. The search strategy incorporated a combination of keywords including “artificial intelligence” or "AI" or "deep learning" or "machine learning", “diabetic retinopathy” OR "DR" OR "diabetic macular edema" OR "diabetic macular oedema", “economic outcomes” or "economic evaluation" or “cost-effectiveness” or “cost-utility”. Additionally, the reference lists of eligible studies and relevant reviews were also reviewed to retrieve other potentially relevant studies. No language restriction was applied. Full search strategies were shown in Supplementary Table 1.Supplementary Table 1 Searching strategies about the economic outcomes of AI-based diabetic retinopathy screening
|
Data source |
Searching strategy |
|
Pubmed |
("artificial intelligence" OR "AI" OR "deep learning" OR "machine learning") AND ("diabetic retinopathy" OR "DR" OR "diabetic macular edema" OR "diabetic macular oedema") AND ("economic outcomes" OR "economic evaluation" OR "cost-effectiveness" OR "cost-utility") |
|
Scopus |
TITLE-ABS-KEY(("economic outcomes" OR "economic evaluation" OR "cost-effectiveness" OR "cost-utility") AND ("artificial intelligence" OR "AI" OR "deep learning" OR "machine learning") AND ("diabetic retinopathy" OR "DR" OR "diabetic macular edema" OR "diabetic macular oedema")) |
|
Cochrane Library |
("artificial intelligence" OR "AI" OR "deep learning" OR "machine learning") AND ("diabetic retinopathy" OR "DR" OR "diabetic macular edema" OR "diabetic macular oedema") AND ("economic outcomes" OR "economic evaluation" OR "cost-effectiveness" OR "cost-utility") |
|
Web of Science |
("artificial intelligence" OR "AI" OR "deep learning" OR "machine learning") AND ("diabetic retinopathy" OR "DR" OR "diabetic macular edema" OR "diabetic macular oedema") AND ("economic outcomes" OR "economic evaluation" OR "cost-effectiveness" OR "cost-utility") |
|
NHS Economic Evaluation Database |
"artificial intelligence" OR "AI" OR "deep learning" OR "machine learning") AND ("diabetic retinopathy" OR "DR" OR "diabetic macular edema" OR "diabetic macular oedema" |
|
CEA Registry |
("artificial intelligence" OR "AI" OR "deep learning" OR "machine learning") AND ("diabetic retinopathy" OR "DR" OR "diabetic macular edema" OR "diabetic macular oedema") |
|
Additional search from review and reference |
1 preprint 2 from reference of a relevant systematic review |
Study Selection
Two researchers independently screened the titles and abstracts of the literature. Full articles were reviewed if a decision could not be made based on the abstract. Any disagreements were discussed and resolved with a third researcher. Eligible studies were included if they met the following criteria: (1) conducted among adult diabetic population, including both type 1 diabetes mellitus and type 2 diabetes mellitus; (2) studies compared AI-based DR screening strategy to non-AI screening (including manual screening or no screening), regardless of the specific approach used (e.g., AI used independently or as an assistive tool for human decision-making); and (3) performed a cost-effectiveness analysis and reported at least one health economic outcome including incremental cost-effectiveness ratio (ICER), incremental net benefit (INB), incremental cost (ΔC), and incremental effectiveness (quality-adjusted life years (QALYs)). Studies were excluded if they were review studies. Furthermore, studies with insufficient data for pooling were excluded from meta-analysis.Data Extraction
Data were extracted by two researchers separately and recorded in a structured spreadsheet. Any disagreements were resolved through discussion with a third researcher. The data extraction was conducted based on the Consolidated Health Economic Evaluation Reporting Standard (CHEERS) statement[15,16], the structured abstracts of economic evaluations in the NHS Economic Evaluation Database (NHS EED)[17], and the Centre for Reviews and Dissemination (CRD) guidance[18].The data extraction form included the following five components:
1)General article information including, study ID, first author and correspondence author, journal and year of publication.
2)General study characteristics including country of the study, country income level, type of economic evaluation, modelling approach, study perspectives, setting level.
3)General characteristic of participants and intervention/comparison including, age distribution of participants, screening strategies, status quo, and diagnostic performance of AI and human graders.
4)Study methods of economic evaluation include time horizon, cycle length, discount rate applied to costs and health outcomes, base cost year and currency, type of outcome measures, cost-effective threshold, and sensitivity analyses performed.
5)The health economic outcomes include mean and incremental cost (ΔC), mean and incremental effectiveness (ΔE), and ICERs. Standard deviation (SD) or 95% confidence interval (CI) for these parameters were also extracted if possible. Data for pooling were extracted including mean of cost or outcome with their dispersion.
Where health economic outcomes were not explicitly reported in numerical values, data were extracted from cost-effectiveness plane graphs, when available. Additionally, cost-effectiveness thresholds or willingness-to-pay (WTP) thresholds were recorded. If WTP thresholds were not reported, they were estimated based on three times the per-capita gross domestic product (GDP) for the country in the publication year, following the World Health Organization (WHO)’s recommendation.
Risk of bias assessment
Considering model- or trial-based economic evaluations, risk of bias was assessed using the Bias in Economic Evaluation (ECOBIAS) checklist consisting of 22 items. Each item was rated as yes, no, partly, unclear, or not applicable, depending on the study's adherence to methodological standards.Interventions and economic outcomes
Interested interventions were AI-based DR screening. The comparator was determined as non-AI screening (manual screening) or no screening.Data Preparation
Since individual studies used different currencies and base years, all costs were converted to a 2023 cost metric using the consumer price index (CPI) and expressed in United States dollars (US$). The primary economic outcome measure was INB[19–21], which was calculated as follows: INB = K(ΔE)−ΔC, where K is the cost-effectiveness thresh- old or WTP, ΔE, and ΔC are the difference of QALYs and cost between intervention and comparator. Here we selected INB as the effect measure rather than ICER because its positive or negative value directly indicates cost-effectiveness or non-cost-effectiveness, respectively, and its linearity facilitates straightforward statistical analysis. In contrast, negative ICER values may indicate a lower cost with higher effectiveness or high cost with lower effectiveness, which could introduce interpretive ambiguity. Those studies reported the ICERs were converted to the INB as INB = ΔE (K−ICER). Variance of INB could be calculated using the following formulas: Var(INB) = K2σ2ΔE + σ2ICER, or Var(INB) = K2σ2ΔE + σ2ΔC – 2KρΔCΔE. Due to variation in reporting across economic evaluation studies, INB and its variance were estimated under five scenarios, following previous recommendations[22](Supplementary Table 2).Supplementary Table 2 Data preparation method for INB and its variance
|
Studies reported means and its dispersion measure (SD/SE) for costs (C), effective (E), ΔC, ΔE, and ICER/ICUR. INB and its variance can be calculated directly from any of the formulas: Var(INB) = K2σ2ΔE + σ2ICER, or Var(INB) = K2σ2ΔE + σ2ΔC – 2KρΔCΔE, Where σ2ΔC, σ2ΔE, ρΔ𝐸Δ𝐶 are variances of ΔC and ΔE and their covariance, and σ2ICER is variance of ICER. |
|
|
SCENARIO 2: |
Studies reported ICER/ICUR along with its 95% CI. The variance of ICER can be calculated by the formulas below: 95% CI (μICER) = μmean ICER+1.96*SE ICER, than the variance of INB can be calculated from: Var(INB) = K2σ2ΔE + σ2ICER. |
|
SCENARIO 3: |
Studies reported means along with measures of dispersion (95% CI, SD/SE) of C, E, or ΔC/ΔE, but not ICER/ICUR. INB and its variance can be calculated from the formulas: Var(INB) = K2σ2ΔE + σ2ICER, or Var(INB) = K2σ2ΔE + σ2ΔC – 2KρΔCΔE. Data are used to simulate C/ΔC and E/ΔE with 1000 replications using Monte Carlo methods with gamma and normal distributions for C/ΔC and E/ΔE, respectively. |
|
SCENARIO 4: |
Studies reported only CE-plane. Individual values of ΔC and ΔE data can be manually extracted from the CE plane using Web-Plot-Digitizer software. Then, means of ΔC, ΔE, and their variances and covariances can be estimated accordingly. INB and its variance can be calculated from the formulas: Var(INB) = K2σ2ΔE + σ2ΔC – 2KρΔCΔE. |
|
Scenario 5: |
Studies did not report neither dispersion nor the CE-plane, but only provide the deterministic analysis means (or point estimates) of costs, outcomes, and ICER. Dispersion measures can be borrowed from a similar study if: it is in the same income stratum; or has a similar model type and inputs (perspective, discounting, time horizon); or compares the same intervention and comparator over a similar time period and region; or has ICERs within ±50% to 75% of each other. If multiple studies qualify, the average of their variances can be used. |
Data were prepared for pooling based on five scenarios as follows.
Statistical analysis
Statistical analysis was conducted to evaluate the pooled INB across studies. It was stratified by country income levels, according to the World Bank classification (high income countries (HICs), upper- or lower-middle income countries (U/LMICs), etc.) and study perspective (healthcare system/payer and societal). For studies reporting results on multiple populations, the weighted average estimate of INB and its variance was used in the main analysis.Fixed effects modeling using the inverse-variance method was applied when no significant heterogeneity was detected, other-wise a random effects model was applied[23]. The intervention was considered cost-effective if the pooled INB was positive (i.e., favoring the intervention), otherwise it was not cost-effective. Heterogeneity was assessed by the Cochrane’s Q test, I² statistic and meta regression. Subgroup analyses were conducted to explore potential sources of heterogeneity, such as differences in country income levels or comparison methods. In addition, a 95% CI was calculated estimate whether the pooled INB would remain cost-effective in other settings. Publication bias was assessed using funnel plots and Egger’s test. If asymmetry was identified, contour-enhanced funnel plots were used to differentiate potential causes. A series of pre-specified sensitivity analyses were performed by excluding studies with following conditions: (1) time horizon <10 years; (2) high risk of bias and (3) scenario 5 (imputing variance using absolute value borrowing from similar studies). Data pooling was undertaken using Microsoft® Excel version 2019 and analyzed using STATA® version 16. A two-sided p value < 0.05 was considered statistically significant.
RESULTS
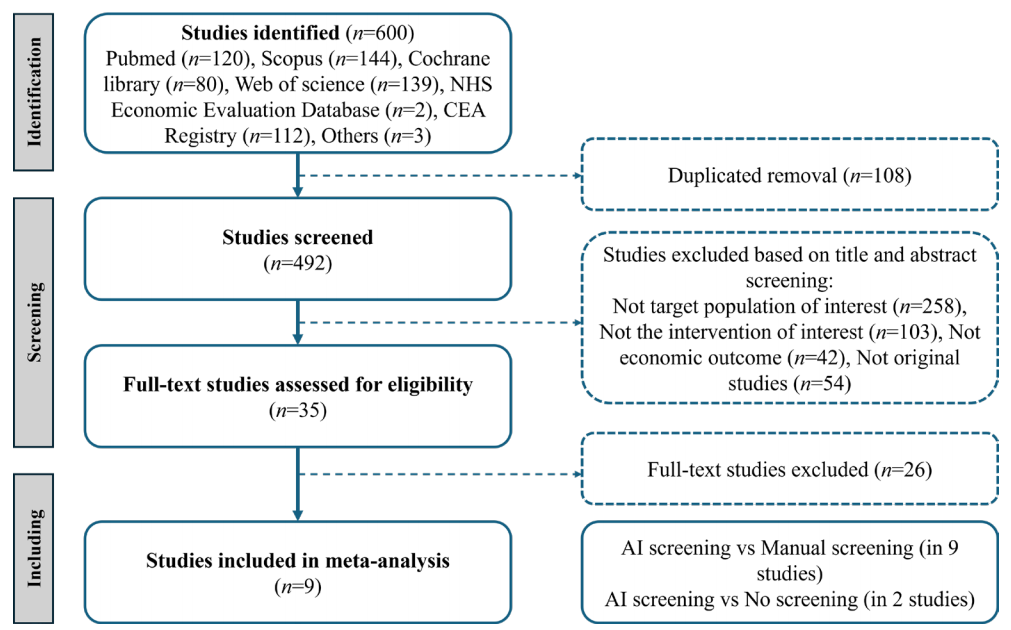
Of the six hundred identified studies, nine studies were eligible for the meta-analysis[9,11–13,24–28](Figure 1), including eleven comparisons: nine comparisons between AI screening and manual screening, two comparisons between AI screening and no screening.Figure 1 Preferred Reporting Items for Systematic Reviews and Meta-Analyses (PRISMA) flow diagram
Study characteristics
Geographically, three studies were conducted in high-income countries, while six were conducted in middle-income countries. All studies evaluated manual tiered screening strategies, with two also assessing no-screening scenarios. The Markov model was used in all studies. Healthcare provider or health system perspective was most commonly adopted analytical perspective, featured in seven studies, while four adopted a societal perspective. Sensitivity and specificity of AI-based screening strategies ranged from 0.80 to 0.98 and 0.91 to 0.99, respectively. In comparison, the sensitivity and specificity of the status quo ranged from 0.73 to 1.00 and 0.92 to 1.00, respectively. Discount rates for cost and efficiency were between 3% and 3.5%, and time horizons varied from nine year to lifetime. Details of these studies were shown in Table 1.Risk-of-bias assessment
We used the ECOBIAS checklist to evaluate the risk of bias. Biases were reported in the dissemination bias, limited time horizon bias, data identification and incorporation bias, limited sensitivity analysis and scope bias, and bias related to internal consistency. Two studies were classified as low risk of bias (2/9, 22.2%), four studies (4/9, 44.4%) were identified with moderate and three were with high risk of bias (3/9, 33.3%). Results from a risk of bias assessment are described in Supplementary Table 3.Supplementary Table 3 Risk of bias assessment
|
Type of bias |
Hu, 2024 |
Srisubat, 2023 |
Lin, 2023 |
Li, Preprint |
Li, 2023 |
Chawla, 2023 |
Huang, 2022 |
Gomez, 2022 |
Fuller, 2022 |
|
|
PART A. Overall checklist for bias in economic evaluation |
||||||||||
|
1. Narrow perspective bias |
N |
N |
N |
N |
N |
N |
N |
N |
N |
|
|
2. Inefficient comparator biasa |
N |
N |
N |
N |
N |
N |
N |
N |
N |
|
|
3. Cost measurement omission |
N |
N |
N |
N |
N |
N |
N |
N |
N |
|
|
4. Intermittent data collection |
N |
N |
N |
N |
N |
N |
N |
N |
N |
|
|
5. Invalid valuation bias |
N |
N |
N |
N |
N |
N |
N |
N |
N |
|
|
6. Ordinal ICER bias |
N |
N |
N |
N |
N |
N |
N |
N |
N |
|
|
7. Double-counting bias |
N |
N |
N |
N |
N |
N |
N |
N |
N |
|
|
8. Inappropriate discounting |
N |
N |
N |
N |
N |
N |
N |
N |
N |
|
|
9. Limited sensitivity analysisb |
N |
N |
P |
P |
P |
P |
N |
P |
P |
|
|
10. Sponsor bias |
N |
N |
N |
N |
N |
N |
N |
N |
N |
|
|
11. Reporting and dissemination bias |
U |
U |
U |
U |
U |
U |
U |
U |
U |
|
|
PART B. Model-specific aspects of bias in economic evaluation |
||||||||||
|
I: Bias related to structure |
||||||||||
|
12. Structural assumptions |
N |
N |
N |
N |
N |
N |
N |
N |
N |
|
|
13. No treatment comparatora |
N |
N |
N |
N |
N |
N |
N |
N |
N |
|
|
14. Wrong model bias |
N |
N |
N |
N |
N |
N |
N |
N |
N |
|
|
15. Limited time horizon bias |
P |
Y |
P |
P |
P |
P |
P |
N |
Y |
|
|
II: Bias related to data |
||||||||||
|
16. Bias related to data identification |
N |
N |
N |
P |
U |
P |
P |
U |
U |
|
|
17. Bias related to baseline data |
N |
N |
N |
N |
N |
N |
N |
N |
N |
|
|
18. Bias related to treatment effects |
N |
N |
N |
N |
N |
N |
N |
N |
N |
|
|
19. Bias related to quality of-life weights (utilities) |
N |
N |
N |
N |
N |
N |
N |
N |
N |
|
|
20. Non-transparent data incorporation bias |
N |
N |
N |
P |
U |
P |
P |
U |
U |
|
|
21. Limited scope biasb |
N |
N |
P |
P |
P |
P |
N |
P |
P |
|
|
III: Bias related to consistency |
||||||||||
|
22. Bias related to internal consistency |
U |
U |
U |
U |
U |
U |
U |
U |
U |
|
|
Overall |
Low |
Low |
Moderate |
High |
Moderate |
High |
High |
Moderate |
Moderate |
|
Pooled INBs based on healthcare system/payer perspective
Seven studies, including eight comparisons of AI-based screening versus the status quo, were analyzed. Among these studies, three were conducted in HIC while the remaining four were conducted in U/LMICs. In general, the pooled INB showed that AI-based DR screening was significantly and robustly cost-effective when compared to conventional manual screening from the healthcare system/payer perspective (INB= 615.77, 95% CI: 558.27-673.27). While heterogeneity was noted, publication bias was not detected based on Egger’s test (Egger’s test, P=0.32). Therefore, we performed subgroup analyses based on the country’s income level. AI-based DR screening was found to be cost-effective in both HICs (INB = 613.62, 95% CI: 556.06, 671.18) and U/LMICs (INB = 1739.97, 95% CI: 423.13, 3056.82) with low heterogeneity (HIC, I2=28.9%, P=0.25; U/LMIC, I2=54.4%, P=0.07).Pooled INBs based on societal perspective
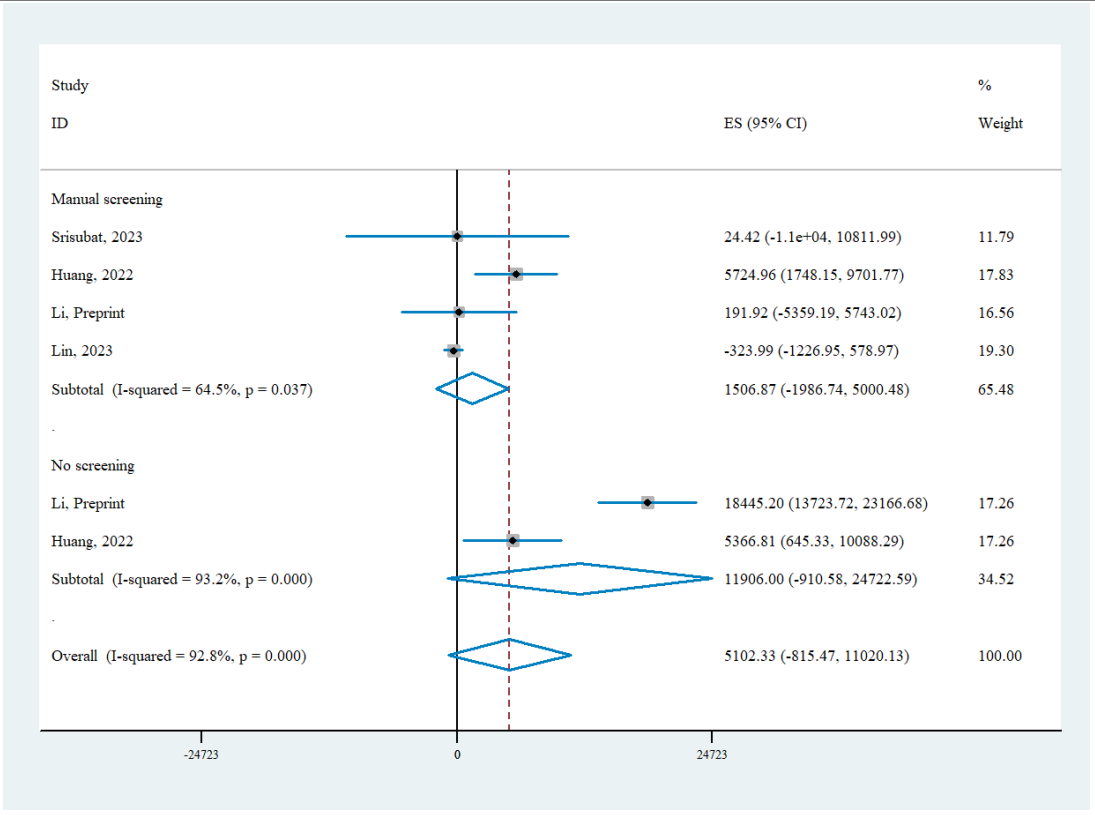
Four studies with six comparisons of AI screening versus status quo were analyzed from societal perspectives. The pooled INB indicated that AI-based DR screening was cost-effective in general from societal perspective (INB= 5,102.33, 95% CI: -815.47-11,020.13), but the results did not reach statistical significance. Significant heterogeneity was observed in funnel plot, yet Egger’s test indicated no evidence of publication bias (Egger’s test, P=0.18). Since all the studies were conducted in U/LMICs, we stratified the studies by the comparator strategy (either manual screening or no screening). AI-based DR screening was found cost-effective in comparison with both strategies (manual screening INB = 1,506.87, 95% CI: -1,986.74-5,000.48; no screening INB = 11,906.00, 95% CI: -910.58-24,722.59), although neither subgroup analysis reached statistical significance and substantial heterogeneity persisted (manual screening I2=64.5%; no screening I2=93.2%). The 95% CI indicated that the true effect in future settings could be either null or aligned with the direction of the pooled INB.Table 1 Characteristic of the included studies
WTP: willingness to pay; Se: sensitivity; Sp: specificity; HIC: high income countries; U/LMIC: upper-middle/ lower-middle income countries; DL: deep learning system; FARIS: fully automated a c retinal image screening; ARIAS: automated retinal image analysis systems; DL : Eyetelligence; DL: EyeWisdom; DL : EyeArt 2.0; DLd: IDx-DR and EyeArt 2.0; NA: not applicable.
Sensitivity analysis and sources of heterogeneity
From a healthcare system perspective, AI-based DR screening showed modest and robust INBs, particularly in HICs, where the INB was 615.77 (95% CI: 558.27-673.27) with low heterogeneity (I2 = 25.3%). When limiting the analysis to studies with time horizons of >5 years or excluding studies using scenario 5 in high-income countries, the INB increased slightly to 620.99 (95% CI: 562.65, 679.32), and heterogeneity was completely eliminated (I2 = 0.0%). Excluding studies with high risk of bias also yielded similar statistically significant results, further supporting the robustness of the results (INB: 609.95, 95% CI: 551.59-668.32). In U/LMICs, while AI screening was cost-effective overall, the results were not statistically robust when short time horizon, high-risk studies or specific scenarios were excluded, (Table 2). In contrast, under the societal perspective, sensitivity analyses revealed substantial heterogeneity across most comparisons, indicating variability among included studies. Excluding high-risk bias studies or scenario 5 can eliminate the heterogeneity in manual screening comparisons (I2 = 0%). However, in these cases, the INBs indicated that AI screening was not cost-effective, statistically (INB=-302.15, 95% CI: -1,211.81-607.50) (Table 3). Overall, AI screening was generally cost-effective in HICs, and heterogeneity in time horizon, study quality and highlights variability across studies particularly in U/LMICs and from a societal perspective. Besides, our meta-regression analysis showed that AI specificity was positively correlated with the INBs from a healthcare system perspective (P=0.031), in addition to status quo comparator type (P=0.031 and P=0.011 in societal and healthcare perspective, respectively) (Table 4).Table 2 Sensitivity analyses of AI screening vs non-AI screening under healthcare system/payer perspective
|
Meta-analysis
|
No. of studies / No. of comparison |
INB (95% CI) |
I-squared |
|
|
High-income countries |
||||
|
Overall |
3/3 |
615.77 (558.27, 673.27) * |
25.3% |
|
|
Time horizon>5 |
2/2 |
620.99 (562.65, 679.32) * |
0.00% |
|
|
Excluding high risk of bias studies |
2/2 |
55.8% |
||
|
Excluding scenario 5 |
2/2 |
620.99 (562.65, 679.32) * |
0.00% |
|
|
Upper or low-middle income countries |
||||
|
Overall |
4/5 |
1739.97 (423.13, 3056.82) * |
54.4% |
|
|
Excluding high risk of bias studies |
3/3 |
395.92 (-1715.57, 2507.40) |
56.4% |
|
|
Excluding scenario 5 |
2/2 |
395.92 (-1715.57, 2507.40) |
56.4% |
|
*P < 0.05.
Table 3 Sensitivity analyses of AI screening vs non-AI screening under societal perspective
|
Meta-analysis
|
No. of studies / No. of comparison |
INB (95% CI) |
I-squared |
|
Upper or Low-middle income countries |
|||
|
Overall |
4/6 |
5102.33 (-815.47, 11020.13) |
92.8% |
|
Excluding high risk of bias studies |
3/4 |
4775.51 (-4935.97, 14486.99) |
94.9% |
|
Excluding scenario 5 |
3/4 |
4775.51 (-4935.97, 14486.99) |
94.9% |
|
Manual Screening |
4/4 |
1506.87 (-1986.74, 5000.48) |
64.5% |
|
Excluding scenario 5 |
3/3 |
-308.42 (-1196.64, 579.80) |
0 |
|
Excluding high risk of bias studies |
3/3 |
-308.42 (-1196.64, 579.80) |
0 |
|
No Screening |
2/2 |
11906.00 (-910.58, 24722.59) |
93.2% |
|
Excluding scenario 5 |
1/1 |
18445.20 (13723.72, 23166.67) |
/ |
*P < 0.05.
Table 4 Results of the meta-regression analysis of the economic outcome for AI-based DR screening
|
Perspective |
Covariates |
Coefficient (95%CI) |
P value |
|
Societal |
Status quo (Manual screening) |
-10,351.72 (-19,736.72, -966.73) |
0.031 |
|
|
AI sensitivity |
48,900.43 (-44,247.92, -142,048.80) |
0.304 |
|
|
AI specificity |
39,390.44 (-45,889.74, 124,670.60) |
0.866 |
|
Health care |
Status quo (Manual screening) |
-3,080.86 (-5,463.93, -697.80) |
0.011 |
|
|
AI sensitivity |
-6,309.70 (-34,767.00, 22,417.61) |
0.664 |
|
|
AI specificity |
24,851.28 (2,224.57, 47,477.99) |
0.031 |
Discussion
As AI continues to gain recognition for its potential in DR screening, questions around the cost-effectiveness of AI-based screening strategy are increasingly critical to consider. This systematic review and meta-analysis included 9 studies with 11 comparisons assessing the cost-effectiveness of AI-based screening versus manual or no screening. Overall, AI-based DR screening was generally cost-effective from a healthcare system perspective, particularly in HICs. From a societal perspective, AI-based screening also demonstrated cost-effectiveness but lacked statistical significance; yet significant heterogeneity was observed, highlighting the need for cautious interpretation when generalizing findings across different settings.Our findings indicated that from a healthcare system or payer perspective, AI-based DR screening demonstrated strong cost-effectiveness, and higher INBs were found in U/LMICs compared to HICs. Two studies in US and one study in Australia indicated that AI screening was more cost-effective than human graders[12,13,27]. One predominant reason was that the costs of manual grading were relatively high in HICs, making AI system a more cost-saving alternative. However, the cost-effectiveness of AI screening was a more complex trade-off in U/LMICs, as it depended on the balance between the added value of automation and the local cost dynamics of traditional screening methods. On one hand, in U/LMICs, traditional screening methods were often constrained by limited infrastructure and a shortage of trained personnel[29], and AI screening can address these gaps through automation and telemedicine systems, enabling earlier and more accurate diagnoses[8]. On the other hand, low labor costs in U/LMICs may reduce the cost-saving advantage of AI screening, which may explain why studies in Brazil and Thailand found AI algorithms to be less cost-effective than human grading[24,28]. Despite these nuances, our meta-analysis proved that AI-based screening strategy was universally cost-effective and statistically significant, suggesting its promise to address healthcare gaps in both HICs and U/LMICs.
Figure 2 Pooled INB of AI-based DR screening versus status quo based on healthcare system/payer perspective
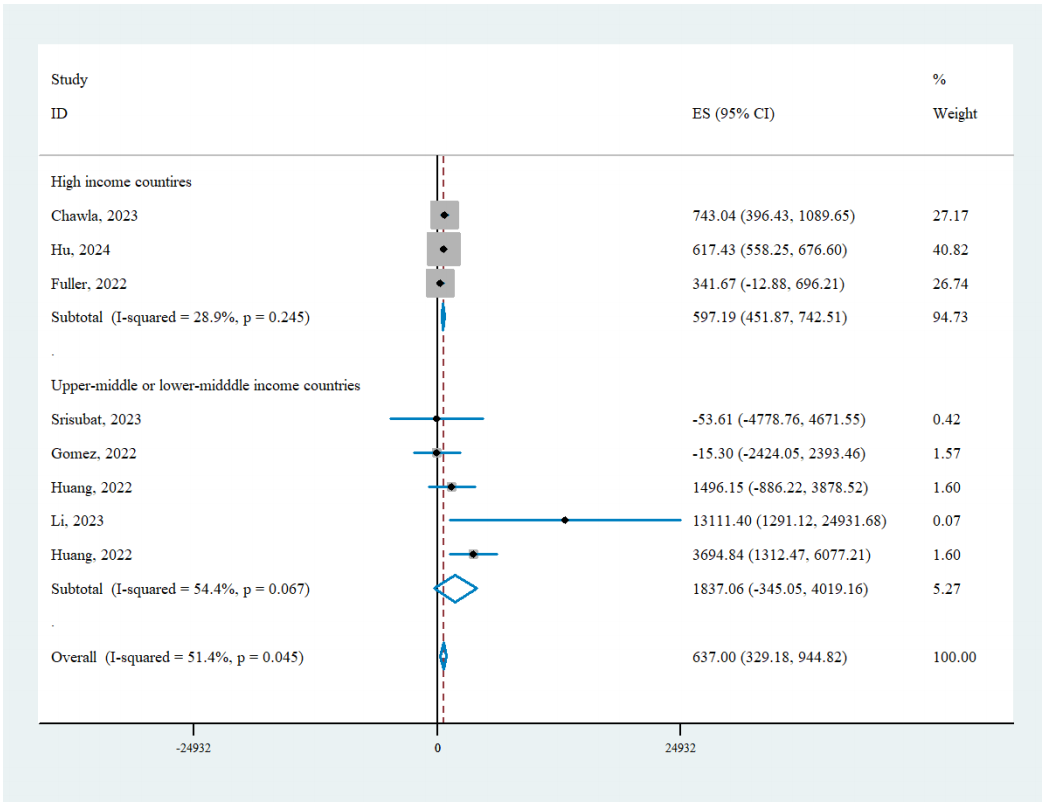
Figure 3 Pooled INB of AI-based DR screening versus status quo based on societal perspective
This study has several limitations. First, the included studies showed high heterogeneity, which may not have been fully addressed despite performing sensitivity analyses. Second, despite many studies assuming the same compliance rate for AI-based and traditional screening, the immediate feedback provided by AI could realistically boost referral adherence beyond that of traditional telemedicine approaches, which often entail a one- to two-week delay. For instance, Liu et al. demonstrated that AI-based screening raised compliance from 18.7% to 55.4% [33]. Failing to consider this potential improvement in compliance may underestimate the cost-effectiveness of AI screening. Third, many studies lacked consistent reporting of key parameters, such as the variance of cost and outcome. Future studies are encouraged to use standardized methods and provide detailed reporting of critical parameters to improve the reliability and comparability of results.
CONCLUSION
AI-based DR screening is generally cost-effective from a healthcare system perspective, particularly in HICs. Given its advantages in reducing healthcare disparities and optimizing resource allocation, AI has the potential to become a powerful tool for DR screening. However, heterogeneity introduced by different assumed values (e.g., compliance, cost, time horizon), status quo and AI performance remains a significant challenge in the comprehensive interpretation of economic evaluation of AI-based screening strategies. To address these challenges, future research should focus on standardized methodologies and reporting critical parameters in detail. Such efforts should improve the generalizability of findings and provide stronger evidence to guide policy-making and implementation strategies for AI-based DR screening.Correction notice
NoneAcknowledgement
We thank the InnoHK HKSAR Government for providing valuable supports. The research work described in this paper was majorly conducted in the JC STEM Lab of Innovative Light Therapy for Eye Diseases funded by The Hong Kong Jockey Club Charities Trust.Author Contributions
(Ⅰ) Conception and design: Xiaotong Han, Mingguang He(Ⅱ) Administrative support: Mingguang He
(Ⅲ) Provision of study materials or patients: Yueye Wang, Keyao Zhou, Jian Zhang
(Ⅳ) Collection and assembly of data: Yue Wu, Yueye Wang
(Ⅴ) Data analysis and interpretation: Yue Wu
(Ⅵ) Manuscript writing: All authors
(Ⅶ) Final approval of manuscript: Xiaotong Han, Mingguang He