




Introduction
A Clinical Puzzle and a Testable Question
Medicine can describe in detail which tissues are more vulnerable, but explains less well why vulnerability follows a reproducible temporal order. Clinically familiar examples include cortical watershed injury before brainstem injury after cardiac arrest, proximal-tubule injury before collecting-duct injury in renal ischaemia, and colour dysfunction before acuity loss in many optic neuropathies. These observations are usually taught as organ-specific phenomena. One possible common explanation is that organisms must allocate a finite energy budget among functions that differ in cost and substitutability, with supply–demand state and allocation jointly shaping the order of functional change. This idea has not yet been operationalised uniformly or validated prospectively.
Optic neuritis provides a discriminating clinical entry point because functions carried by the same optic nerve can recover along different trajectories after one lesion. The Optic Neuritis Treatment Trial showed that selective chromatic defects were heterogeneous in the acute phase and could change type during follow-up. The more stable observation is that colour dysfunction may persist after high-contrast acuity has improved.[1-3] These data establish asynchronous multidimensional recovery, but they do not justify equating high-contrast acuity with the M pathway or routine colour testing with a single P or K pathway.
Anatomy explains part of this selectivity but does not by itself determine recovery time. Red–green opponency depends strongly on midget ganglion-cell circuitry associated with the P pathway, blue–yellow signalling is linked to K-related circuits, and the M pathway preferentially conveys rapid luminance change and motion. Luminance and high-spatial-resolution information, however, are not exclusive to one pathway.[4] Routine acuity and colour tests are therefore pathway-enriched rather than pathway-specific. Small-calibre axons may be preferentially affected in optic neuropathy, and papillomacular-bundle loss in Leber hereditary optic neuropathy implicates both structural and mitochondrial mechanisms.[5-6] The supported conclusion is asynchronous functional recovery, not a proven fixed P–K–M order.[7-8]
The broader question concerns how components within a living system maintain balance when their continuing demand, effective supply, functional redundancy, and repair burden differ. Energetic costs can be measured at several scales, from individual signalling events to neural-tissue budgets, non-signalling maintenance, and whole-organ resting metabolism.[9-14] These measurements show that energetic expenditure is uneven within organs. Ion-pump demand, marginal renal-medullary oxygenation, hepatic zonation, and inducible immune-cell biosynthesis each have strong local explanations. The incremental question is whether measured supply–demand relations and substitutability predict temporal order within the same system beyond those local mechanisms.
We express this question as the Hierarchical Principle. Comparisons must be prespecified within the same system, at the same biological scale, under a common measurable stressor and with defined functional thresholds. Components with greater maintenance demand and less functional redundancy may cross a decompensation threshold earlier. Evolutionary novelty is only a provisional prior and should be retained only if it adds out-of-sample predictive value beyond demand, supply, and redundancy. We first define the static ranking model, then introduce a dynamic energetic margin, assess nine organ systems using common criteria, use four boundary cases to delimit the framework, and finally state 12 falsifiable predictions and related clinical research tasks. The 18-component parameterisation demonstrates an auditable workflow; it is not independent validation.
Definition and Conceptual Foundations
The operational statement of the Hierarchical Principle has three steps. First, select functionally defined components within the same biological system and at the same scale. Second, expose them to a common, measurable energetic stress. Third, compare the time at which each component crosses a prespecified decompensation threshold and the time at which it subsequently remains above a prespecified recovery threshold. A candidate pre-stress order is constructed from three inputs: basal metabolic rate M represents energy demand; evolutionary novelty N represents the relative recency of the relevant trait in evolutionary history; and functional redundancy R represents backup and compensatory capacity for the prespecified functional endpoint. In this paper, these inputs are further operationalised as minimum maintenance demand, a working date for a specific trait, and a proxy score for substitutability, respectively. Actual threshold-crossing times also depend on effective supply, exposure, and the mode of repair. The framework addresses relative order within systems; it does not provide absolute individual risk and does not assume that recovery must always be a strict reversal of loss.
Pillar one: energy-demand gradient (maintenance demand M)
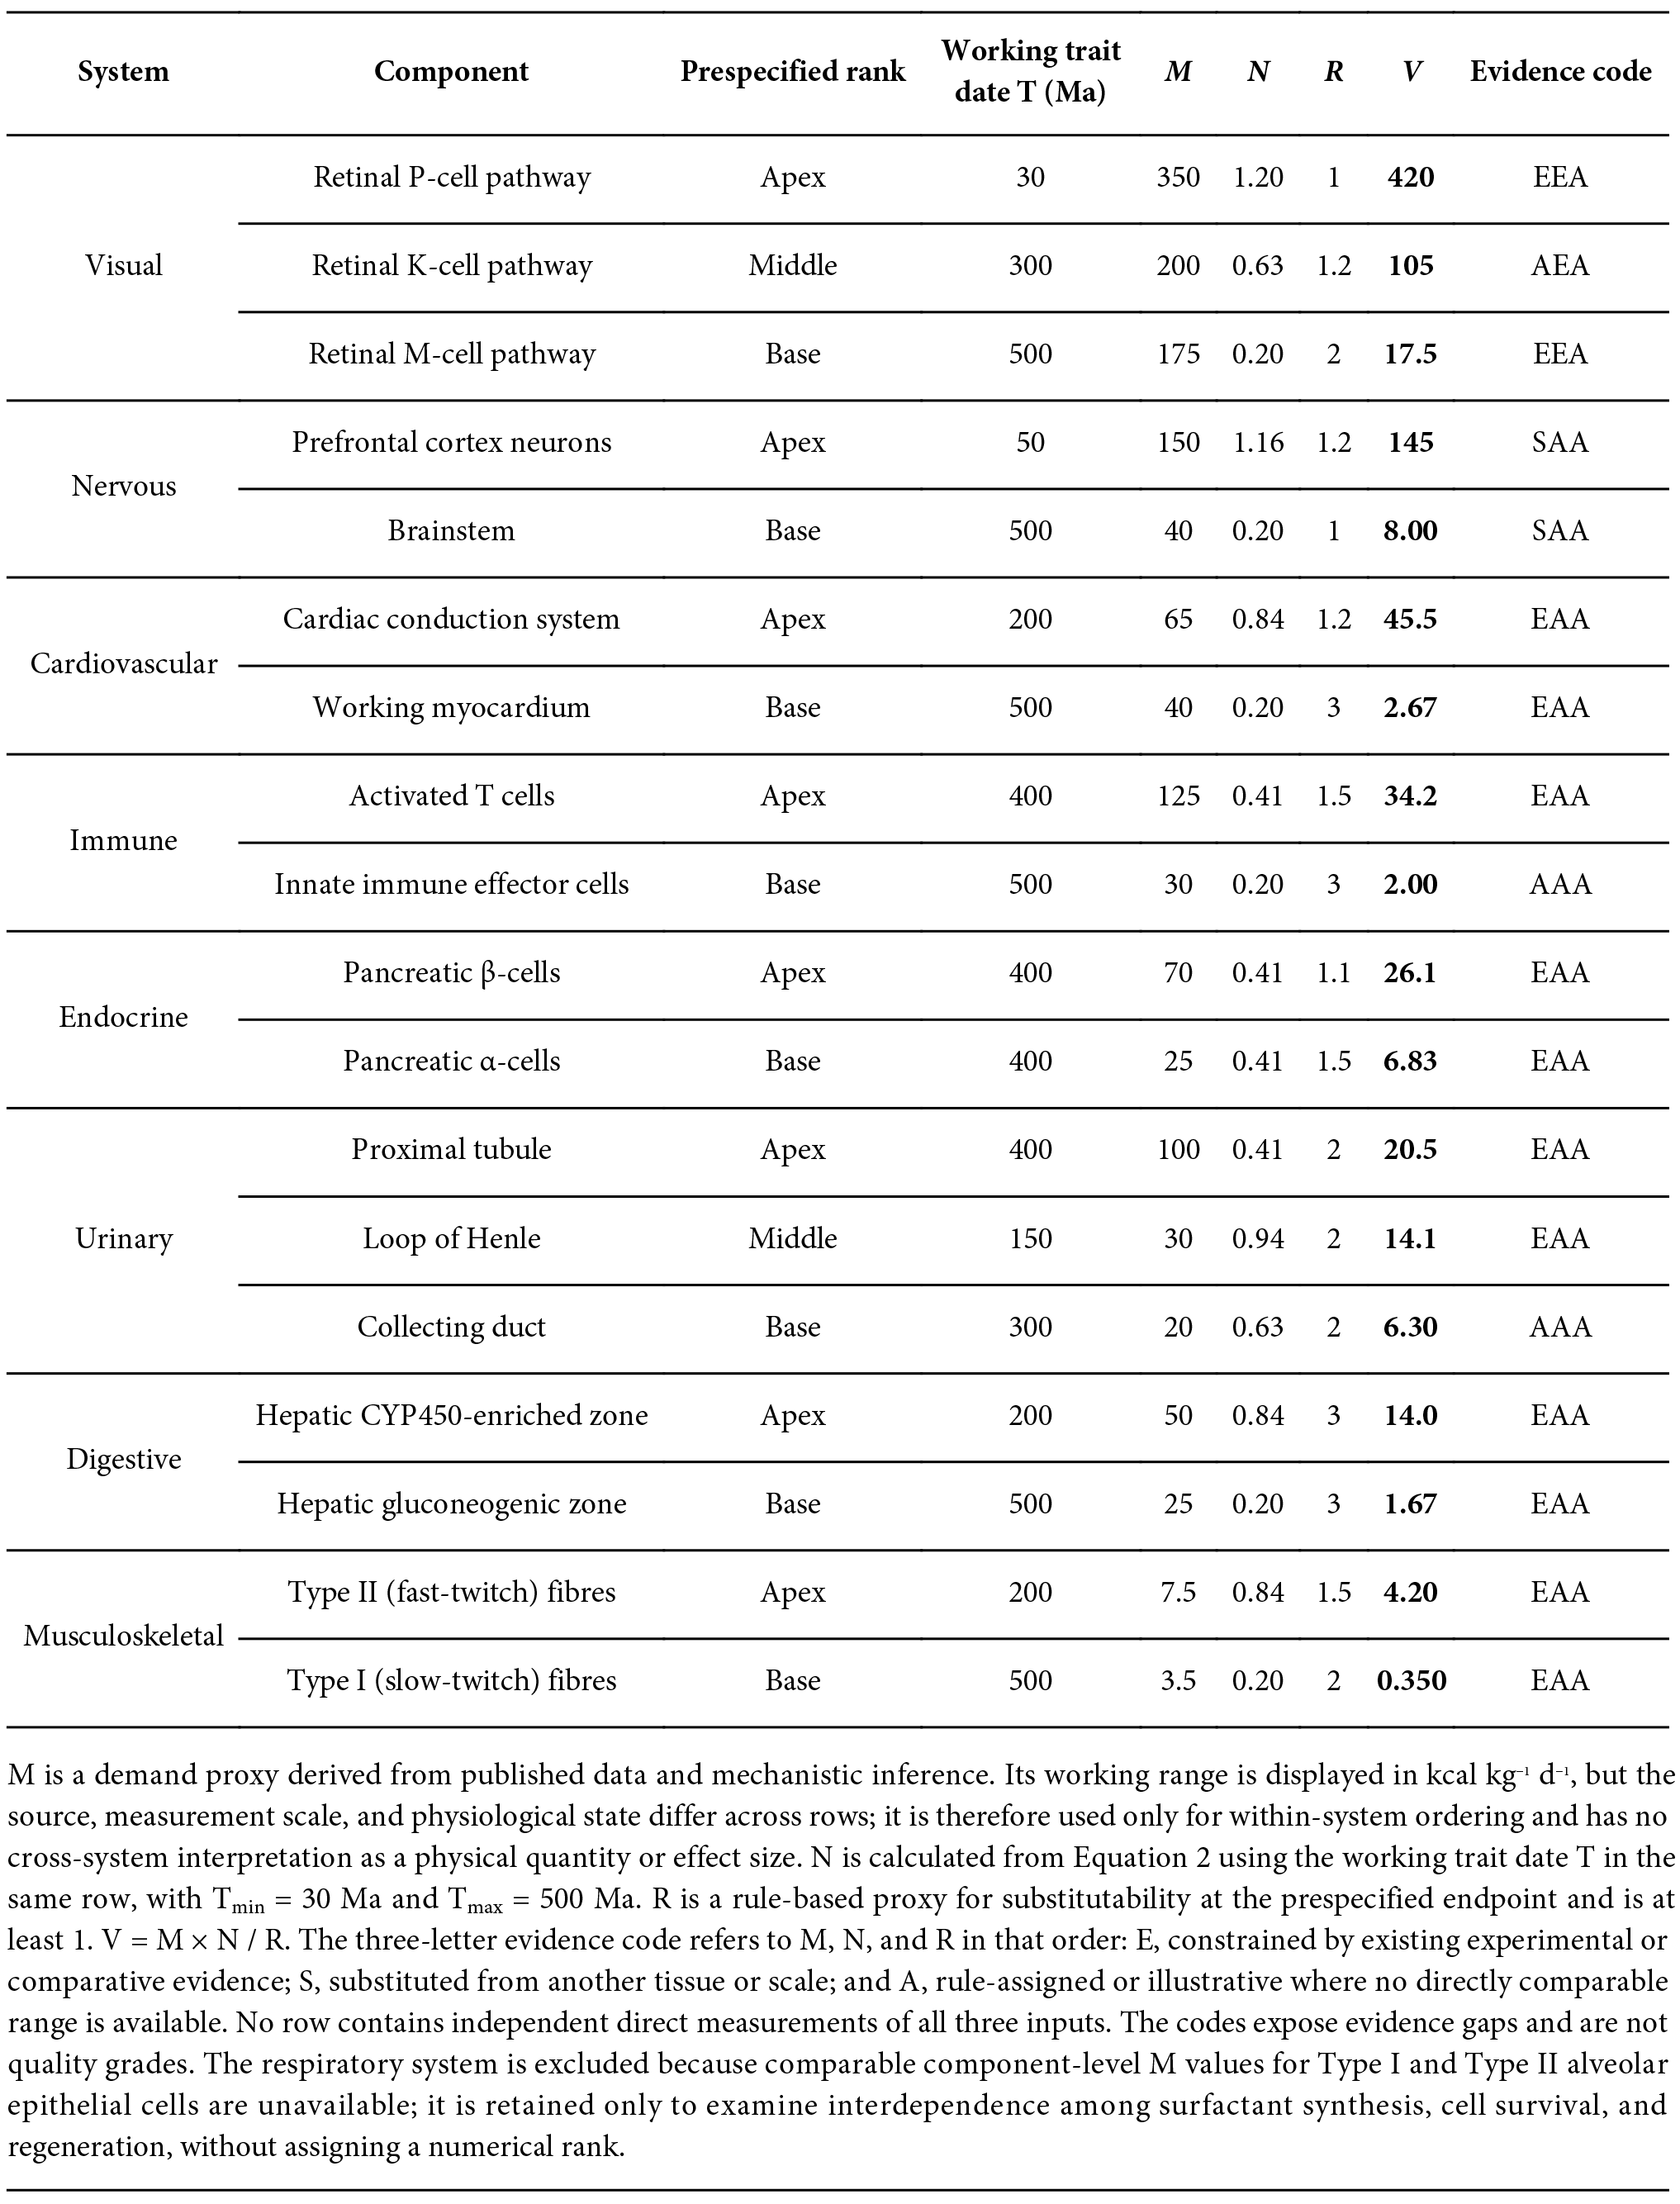
We define basal metabolic rate M as the minimum energy flux required to sustain a prespecified function, within a defined time window and functional unit, when demand cannot be reduced further without functional failure. It is distinct from whole-tissue resting metabolism, peak power during activation, and mitochondrial abundance. Ion-gradient maintenance, protein and lipid turnover, and tonic signalling can contribute to this minimum; the relative roles of oxidative phosphorylation and glycolysis vary by component.[9,13,15-17] In validation studies, M should whenever possible be measured directly and normalised to the same functional unit and time window within each comparison (Table 1).
Pillar two: evolutionary-novelty gradient (novelty prior N)
Evolutionary novelty N denotes the relative recency of the relevant system or trait in evolutionary history. Here it is treated as a provisional prior based on the acquisition time of a specific trait, not as an autonomous causal force. Gene duplication, the emergence of a cell type, anatomical formation, and functional specialisation are different dating targets and must be distinguished. For example, duplication of the L- and M-opsin genes constrains the emergence of primate red–green vision to approximately 30-40 million years ago, but does not date the origin of the entire P pathway.[18-19] N is included only to test whether historical information adds predictive value beyond measured demand, supply, and substitutability. N may correlate with R and energetic efficiency, but trait age itself cannot be equated with the degree of optimisation. If independent data show no incremental value, N should be removed from the model.
Pillar three: functional redundancy R and resource-allocation priority
Functional redundancy R represents a system's backup and compensatory capacity. Once operationalised for a prespecified functional endpoint, it asks how much equivalent performance can be supplied by other structures or processes after a component is impaired. R may involve parallel-pathway degeneracy,[4] cellular reserve, metabolic buffering,[20] and regenerative repair; these are distinct constructs with different time constants and should ultimately be measured separately. Table 1 provisionally compresses them into a proxy score R and places R in the denominator. This is a modelling assumption, not evidence that scores of 1, 1.5, 2, and 3 form a validated ratio scale. In the current model, R directly represents the extent to which component-level damage becomes observable system-level functional decline: with less equivalent substitution, the same component-level damage is more likely to produce overt decompensation. Whether the organism actively lowers a function's allocation priority requires evidence of altered supply and regulatory mechanisms and cannot be inferred from R alone.
The static working score and its intended scope
The three candidate inputs are combined in a within-system ordinal score:
Vi=(Mi×Ni)/Ri (1)
where Mi is the energy demand required to maintain the prespecified function and not readily deferrable over the study window; Ni is a dimensionless evolutionary-novelty prior; and Ri is a rule-based redundancy proxy, constrained to values of at least 1. The values in Table 1 are provisional demand proxies. The multiplicative form and the placement of an ordinal redundancy score in the denominator are uncalibrated coding assumptions rather than deductions from first principles. Because the inputs do not yet share validated ratio scales, V can rank a prespecified comparison set but cannot be interpreted as an effect size or risk multiple. A component with high demand but ample backup, or a recently acquired component with low metabolic cost, need not occupy the apex (Figure 1a).
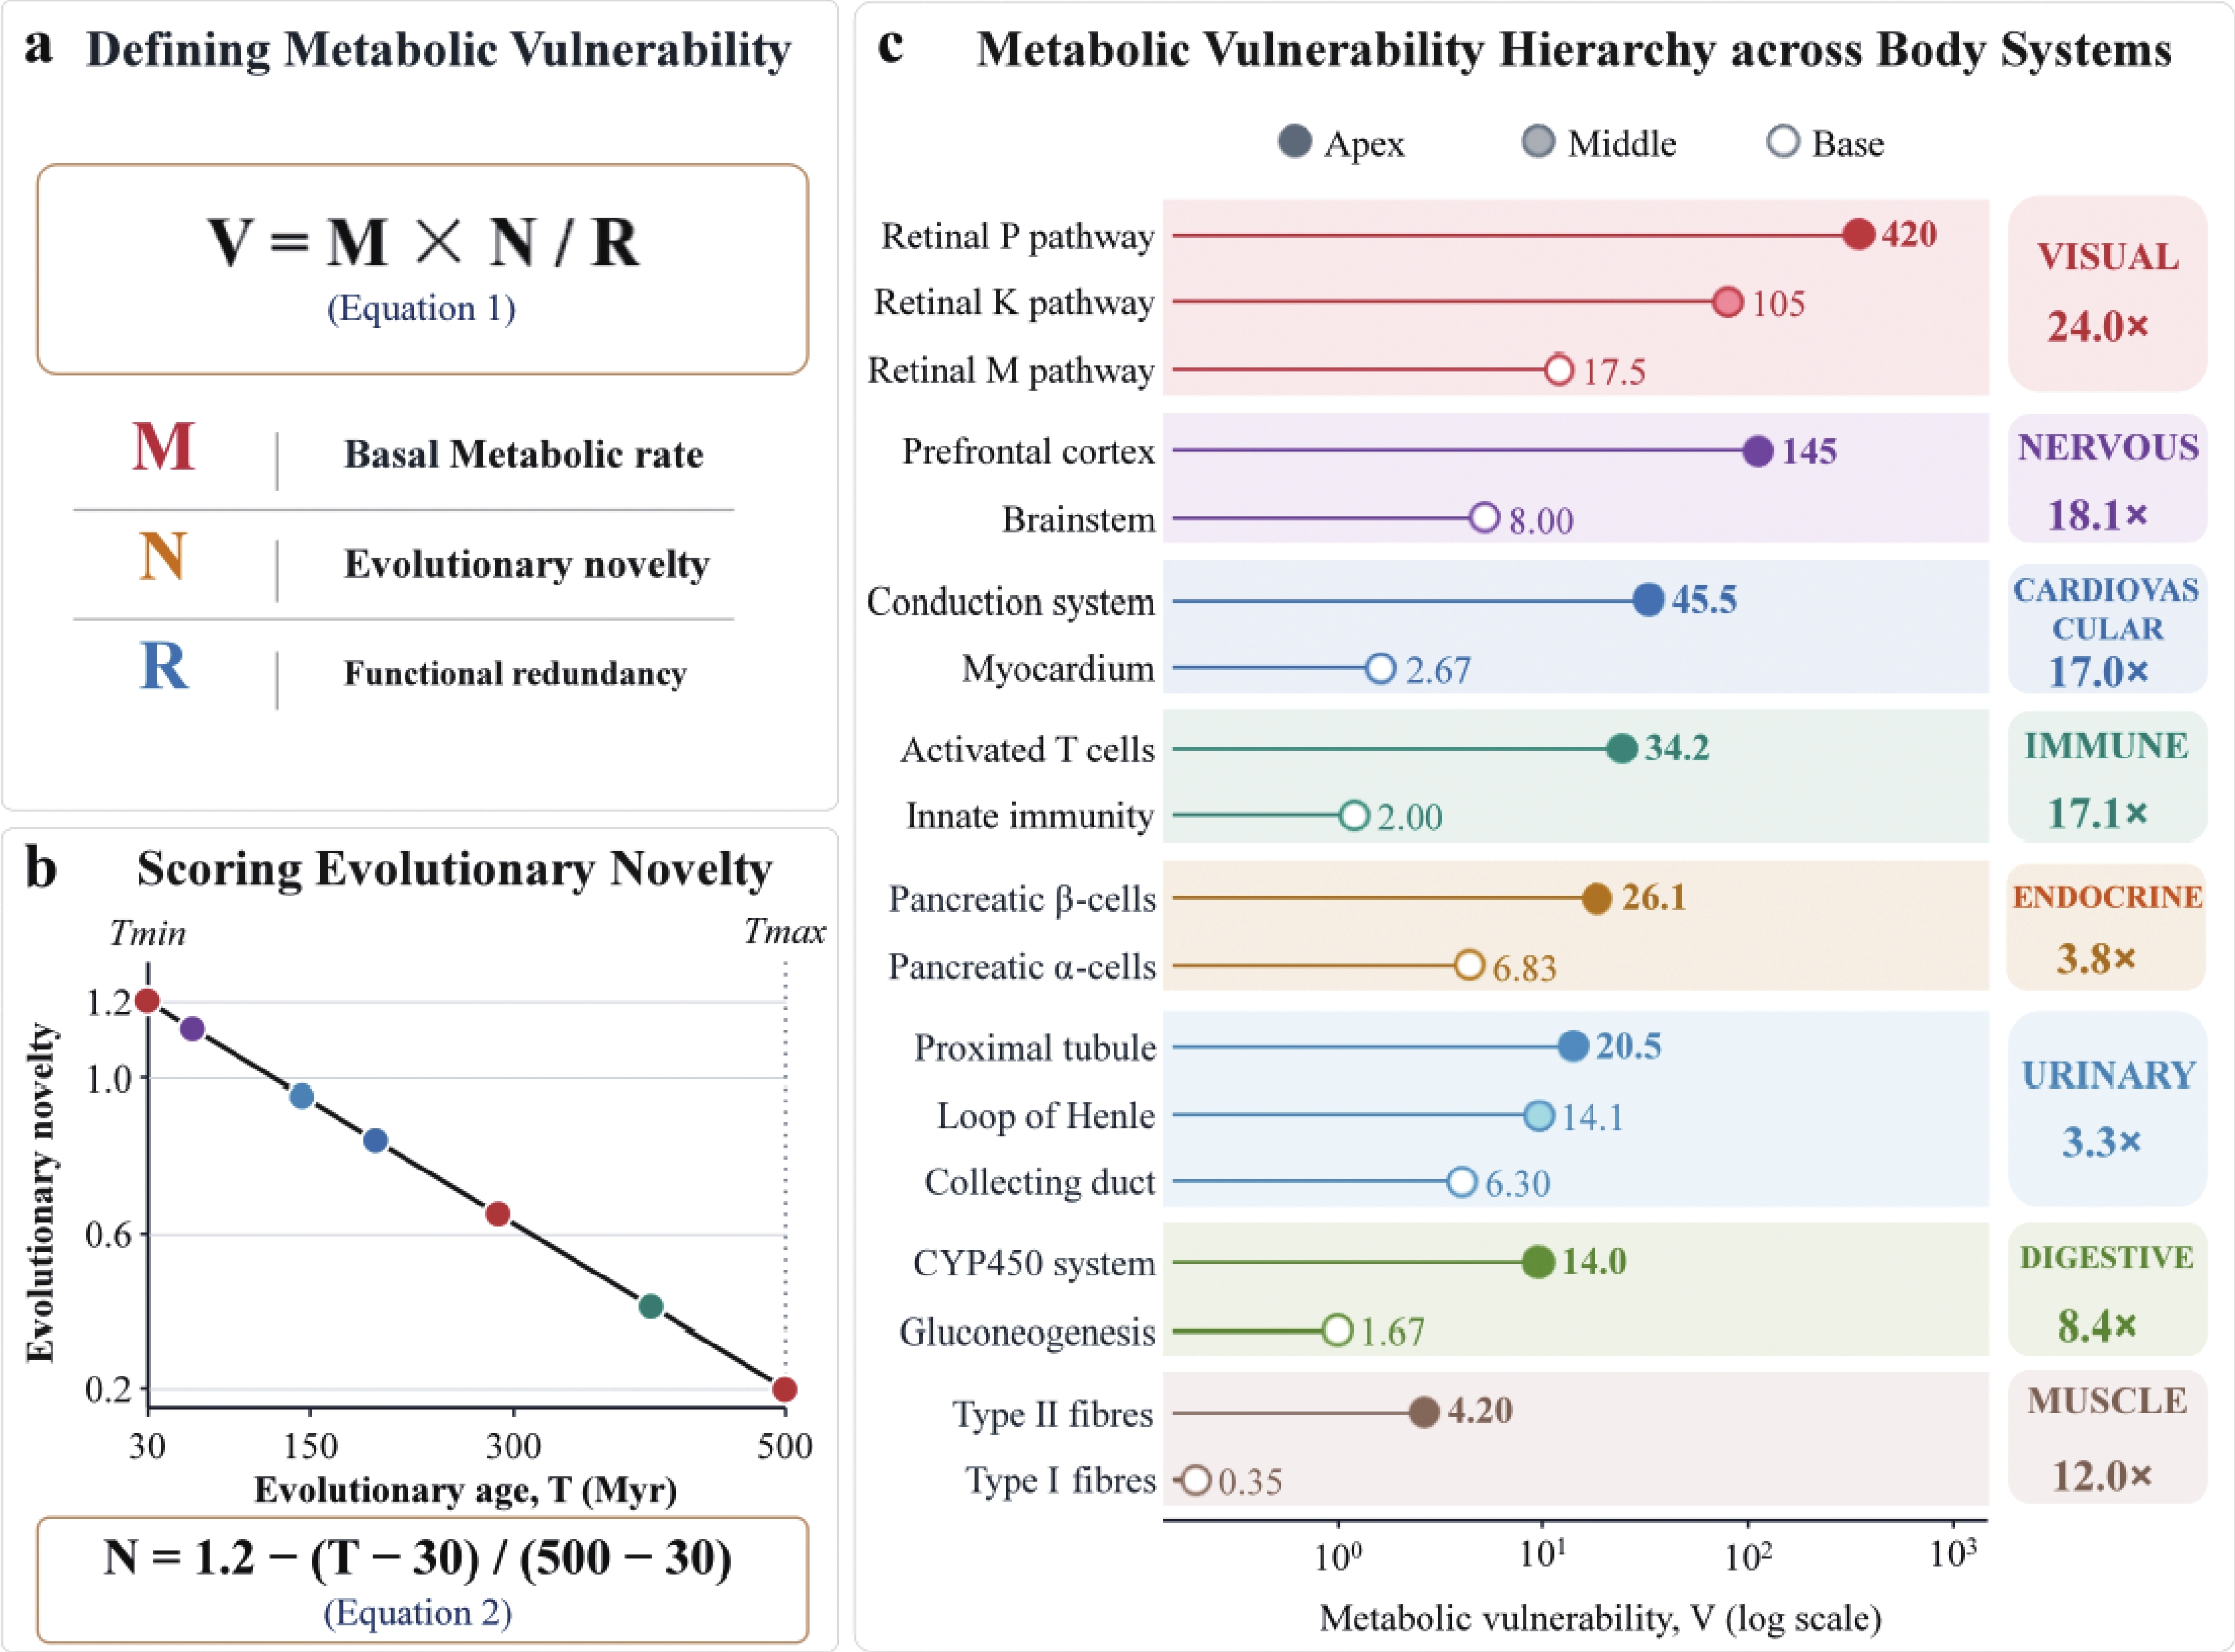
a, The working score V is calculated from basal metabolic rate M, evolutionary-novelty prior N, and functional-redundancy proxy R under Equation 1; the multiplicative form and denominator are uncalibrated. b, N is mapped from a working trait date under Equation 2; both the dating target and linear function are uncertain. c, Current V values for 18 components. The shared axis is used only to disclose inputs and does not support cross-system effect or risk comparisons. Filled, pale, and open markers denote the upper, intermediate, and lower positions within each prespecified comparison set.
Evolutionary novelty is mapped from estimated evolutionary age within a prespecified comparison set:
Ni=1.2−(Ti−Tmin)/(Tmax−Tmin) (2)
For the illustrative vertebrate comparison set, Tmin = 30 Ma and Tmax = 500 Ma, where Ma denotes millions of years before present. This maps the most recent working date to N = 1.20 and the oldest to N = 0.20. The linear transformation preserves the assigned order only; it does not validate the dates or imply a linear biological effect of time. A full sensitivity analysis should compare alternative monotonic transformations, dating intervals, and trait definitions.
Equation 1 proposes a candidate order only within a prespecified system, scale, stressor, and endpoint. The M inputs come from heterogeneous levels of measurement or working estimates; N dates different kinds of biological entities; and R is rule-assigned. Consequently, the magnitudes, differences, and ratios of V are not calibrated effect sizes. Figure 1c displays all systems on one axis for transparency, not to rank visual, muscular, or other organ systems.
Illustrative parameterisation and provenance
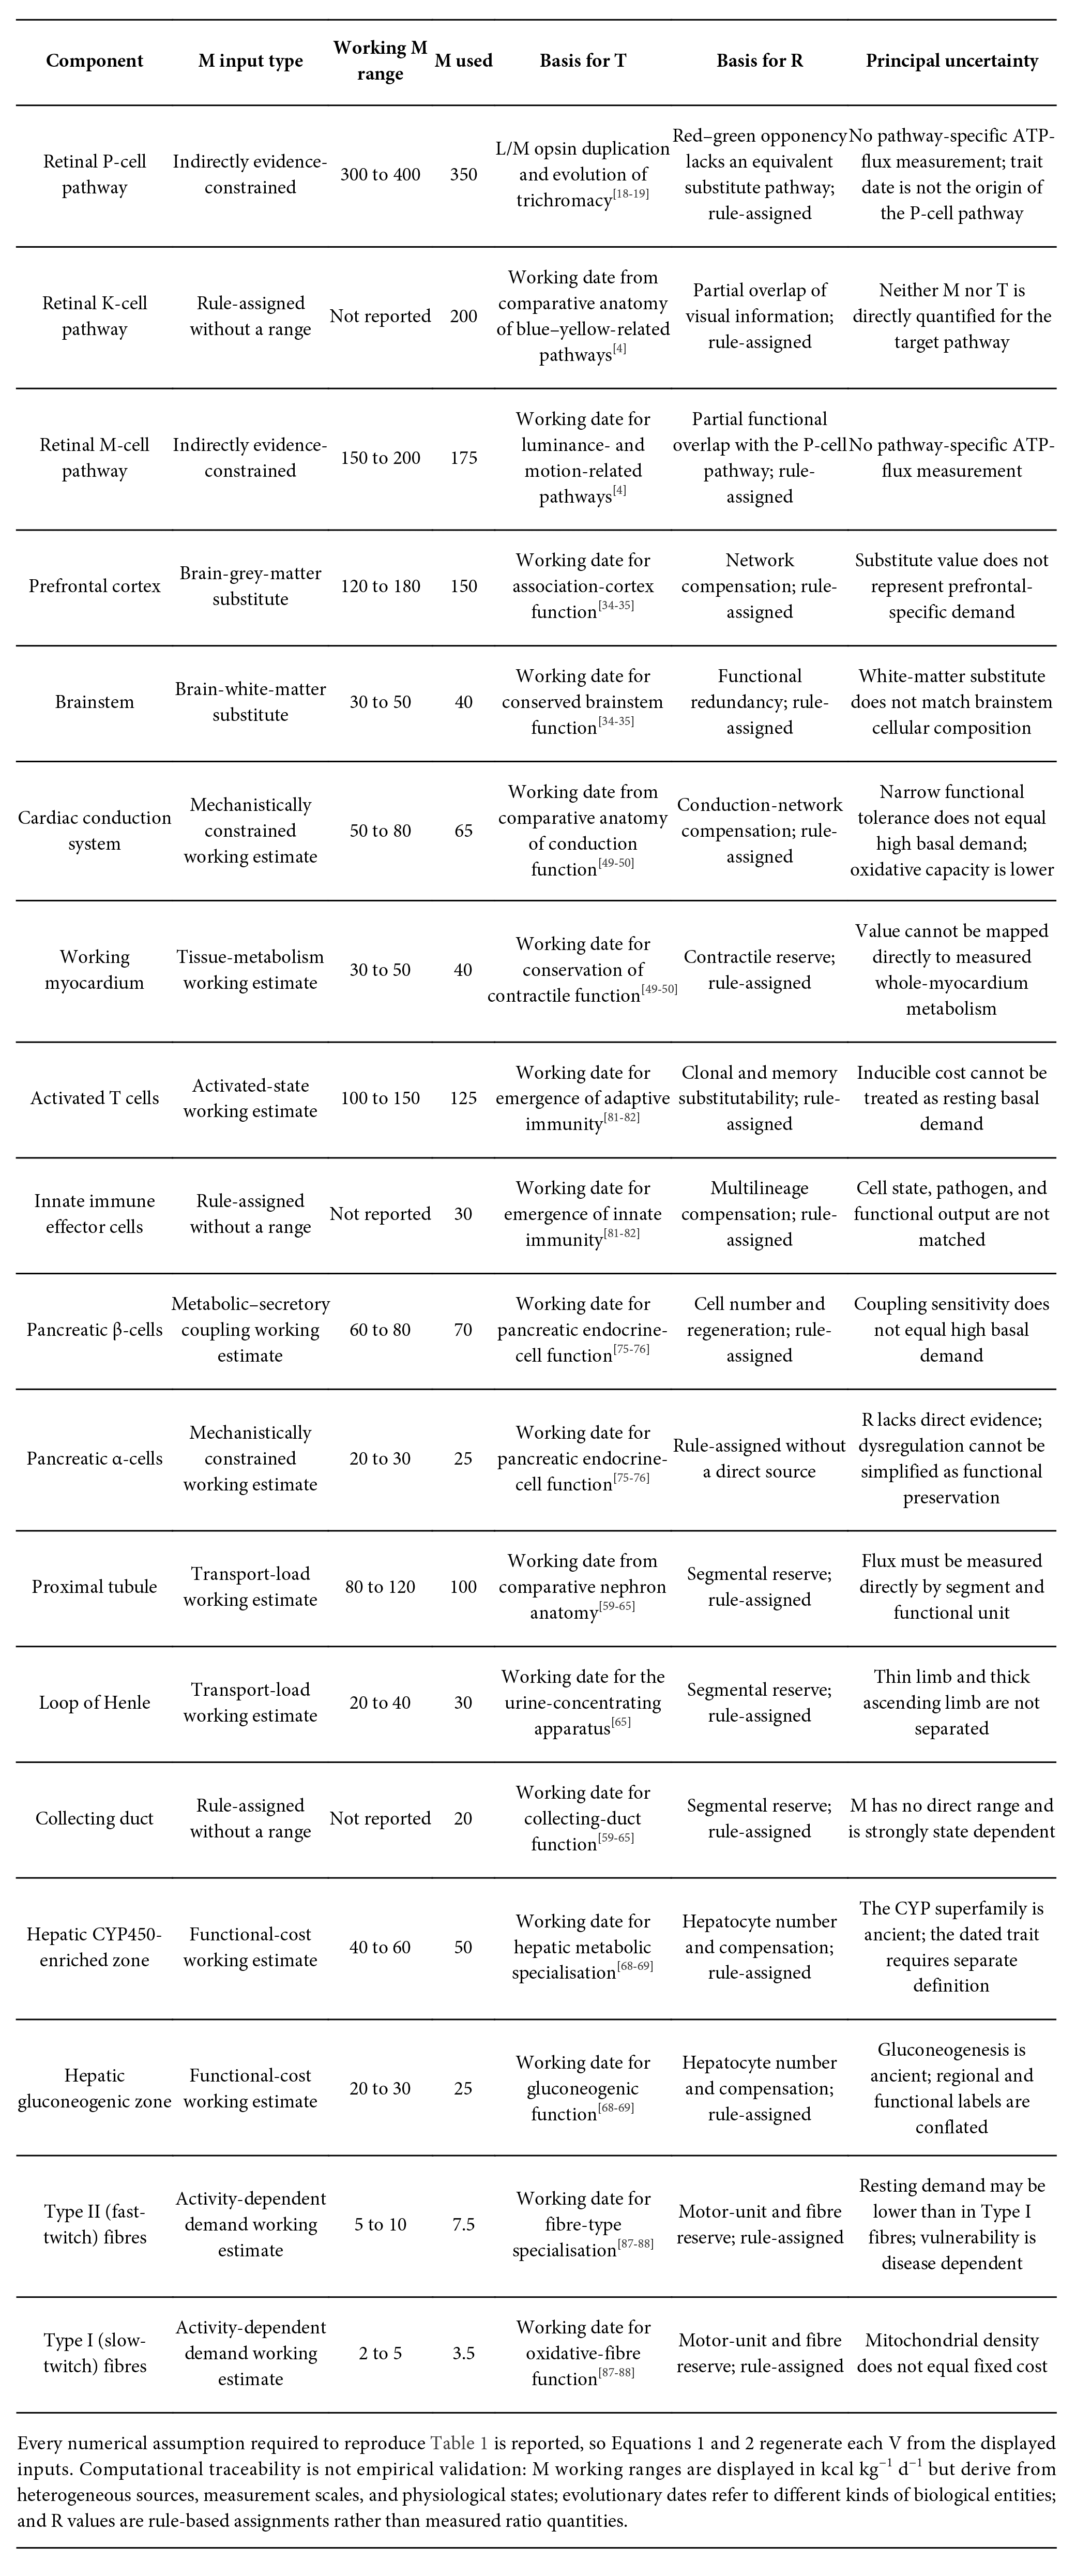
Table 1 reports an illustrative parameterisation of 18 components in eight systems to expose the assumptions, transformations, and uncertainty. Each M, N, and R input is classified as evidence-constrained, substituted, or rule-assigned, and every V value can be recalculated from its row. Supplementary Table 2 identifies the input type, working range, dating target, redundancy basis, and principal uncertainty. Numerical reproducibility is not biological validation. The respiratory system is retained as a ninth qualitative case solely to examine repair interdependence.
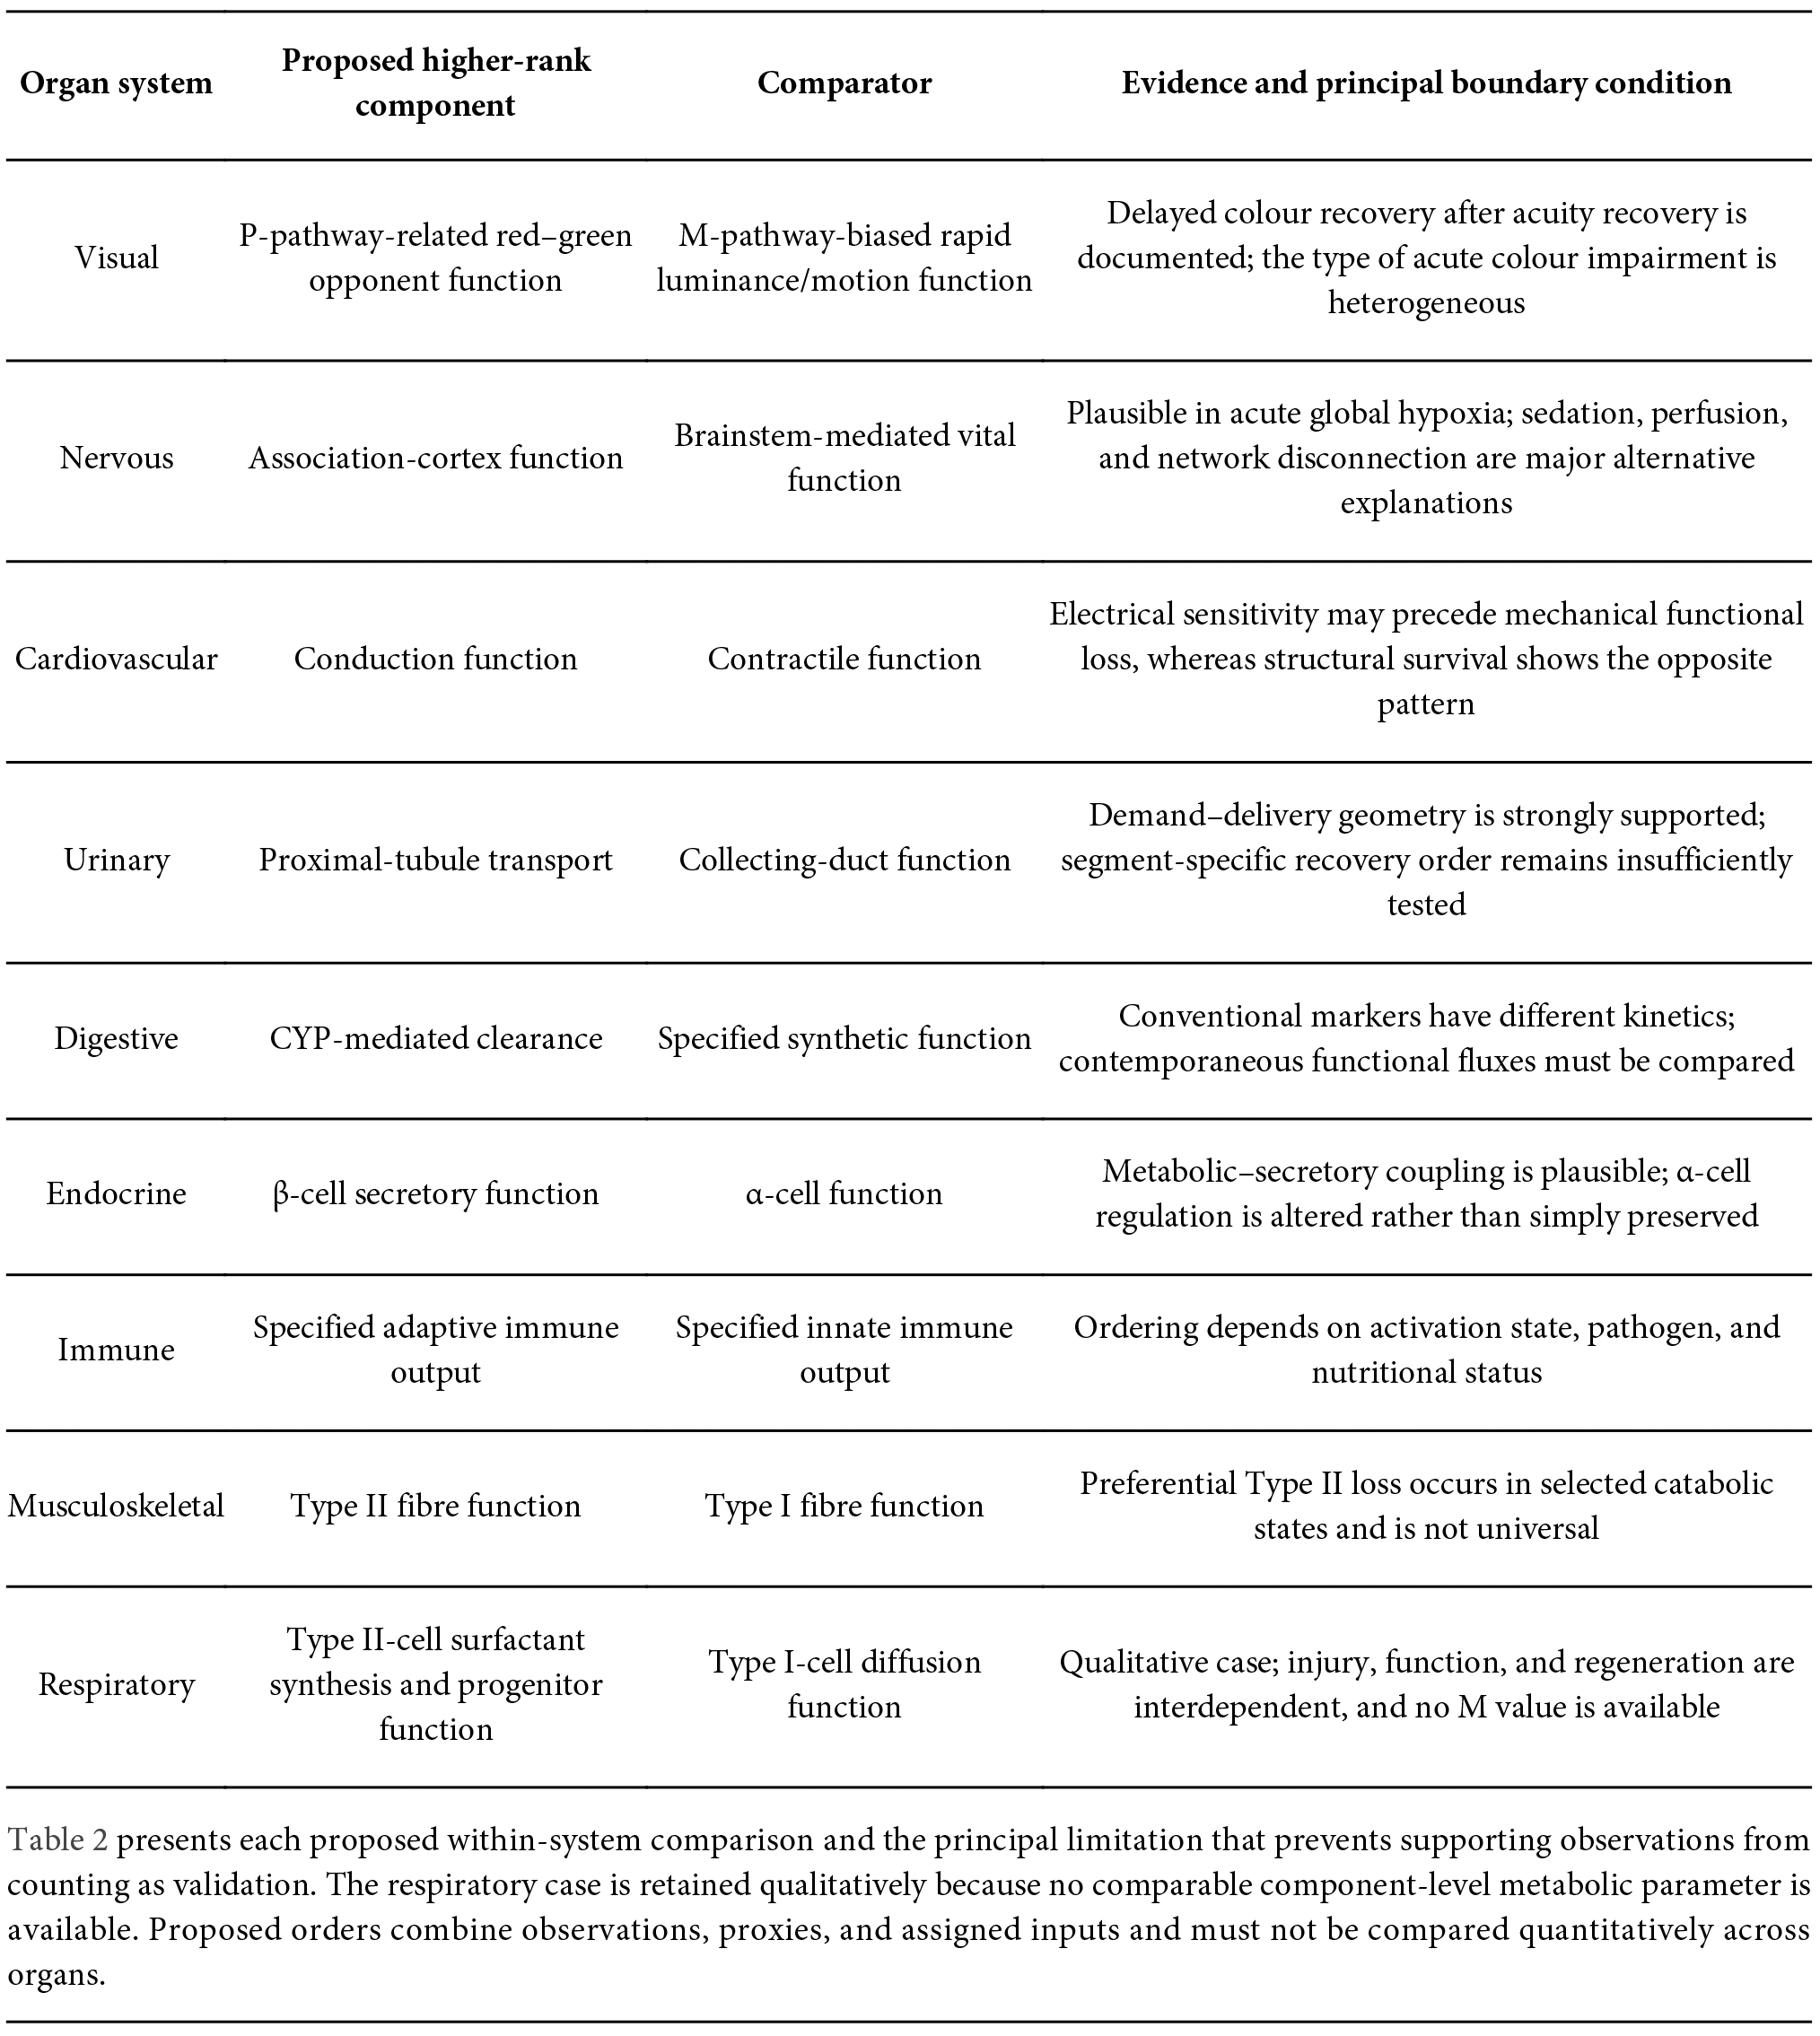
The evidence code classifies M, N, and R in that order. E denotes an input constrained by existing experimental or comparative data; S denotes a substitute value from another tissue or biological scale; and A denotes a rule-assigned or illustrative value where no directly comparable measurement is available. The code records how the working calculation was assembled; it neither validates the input nor changes the definitions in Equation 1. V is interpreted only as a prespecified within-system working order. No row supports a calibrated cross-organ ranking, effect size, or risk ratio.
Four features govern interpretation of Table 1. First, M values are heterogeneous working proxies and do not form a common physical scale across systems. Second, K-pathway, innate-immune, and collecting-duct M values are illustrative, and the α-cell R value is also a worked example rather than a direct measurement. Third, prefrontal-cortex and brainstem M values are substitute tissue-class estimates. Fourth, N is generated mechanically from the working date in the same row. Reproducibility of these calculations establishes neither construct validity nor cross-system commensurability.
The respiratory system is excluded from Table 1 because comparable component-level M values for Type I and Type II alveolar epithelial cells are unavailable. It is retained only to examine the dependence among surfactant synthesis, cell survival, and regeneration. No numerical V or apex/base rank is assigned to either alveolar cell type.
Interpretive limits of the core equation
The static score is a pre-stress ranking prior. It does not contain effective supply and cannot explain why function remains normal when supply is adequate; it lacks calibrated functional thresholds and therefore cannot determine the time of decompensation; and it contains no repair process from which recovery time could be derived. No validated function currently maps V to the dynamic energetic margin H or to a functional threshold. V, H, and cumulative deficit E are separate constructs that require separate tests, not a closed mathematical law.
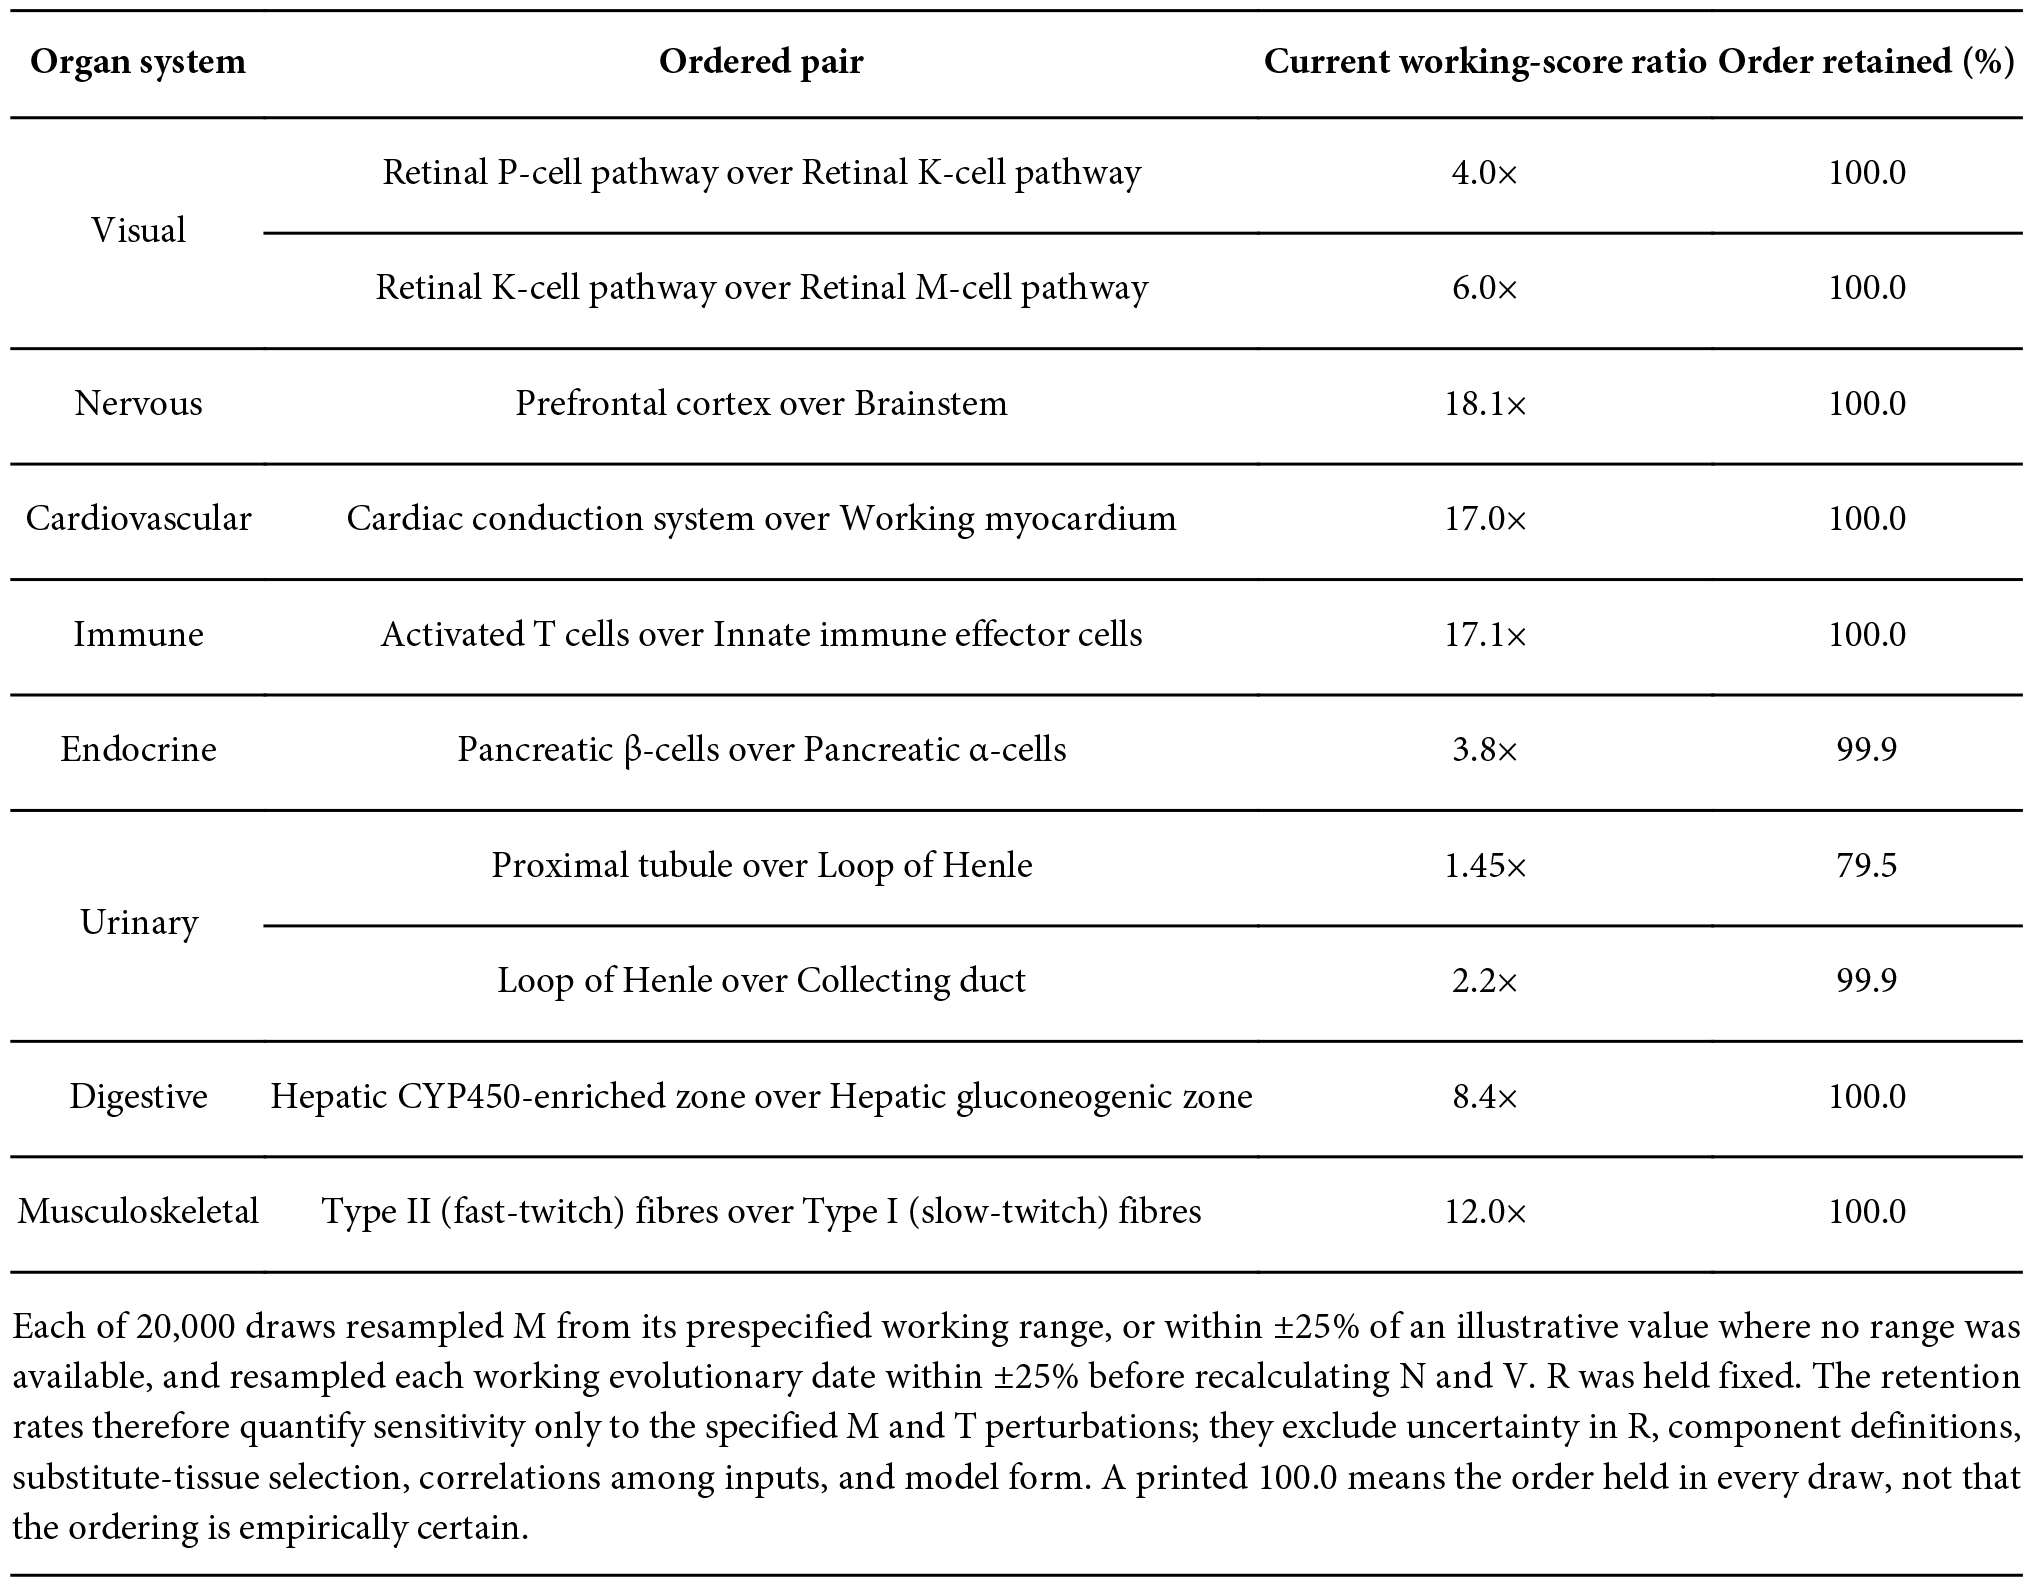
Input uncertainty can reverse any closely separated rank. The working-score ratio between the proximal tubule and loop of Henle is only 1.45, and the current data cannot resolve their order. Even the wider visual span does not address uncertainty in R assignment, the functional form of N, substitute-tissue selection, or correlations among parameters. Figure 3 perturbs only prespecified M ranges and T while holding these other assumptions fixed; its results therefore describe conditional numerical stability, not overall model robustness.
Energetic margin: a dynamic extension
A candidate rank becomes observable only through physiological state, which V does not represent. We therefore define the instantaneous energetic margin as the difference between usable supply and the demand required to maintain a prespecified function, normalised by that demand:
Hi(t)=(Si(t)−Di(t))/(Di(t)) (3)
Si(t) is the energy supply that is actually usable after delivery and allocation, and Di(t) is the total energy demand required to sustain the prespecified function. As demand changes with time and functional state, M may be regarded as its baseline or lower-bound component; M and D are not interchangeable measures. S and D must both be energy fluxes measured over the same window and normalised to the same functional unit, for example ATP equivalents per functional unit per unit time. Units cannot be interchanged directly across systems. Hi(t) is dimensionless: positive values indicate remaining margin, zero indicates balance, and negative values indicate unmet demand (Figure 5a, b). Equation 3 is a proposed dynamic hypothesis requiring simultaneous measurement of supply and demand.
Energetic margin describes actual supply–demand state; it does not convert V into a pathogenic mechanism. Decompensation requires both insufficient effective supply for the prespecified function and crossing an independently defined functional threshold. V neither produces energy nor determines H. The testable interface is whether, under comparable supply trajectories, exposure, and thresholds, a higher preregistered V predicts earlier threshold crossing. R acts at a different level by determining how component-level deficit propagates to system-level output, whereas N must justify itself through incremental out-of-sample prediction. If V adds no predictive information beyond measured H and simpler models, the static model should be revised or abandoned.
To describe a possible lag between recovery of energetic state and recovery of function, we further define cumulative supply–demand deficit Ei(t) as the time integral of the positive difference Di(t)−Si(t), namely ∫max [Di(t)−Si(t), 0]dt, over the observation period. E accumulates supply–demand burden during injury; it is not a measure of the energetic cost still required for repair. The framework proposes that cumulative deficit may explain the lag between energetic and functional recovery better than the minimum value of H alone (Figure 5c). Myocardial stunning provides an existing example of possible dissociation: high-energy phosphates may return to normal while mechanical function remains depressed.[21-23] The three quantities therefore have distinct roles: V ranks components before injury, H records when components cross thresholds during injury, and E is a candidate explanation for post-injury recovery time.
Evidence Across Nine Systems: Comparative Tests of the Framework
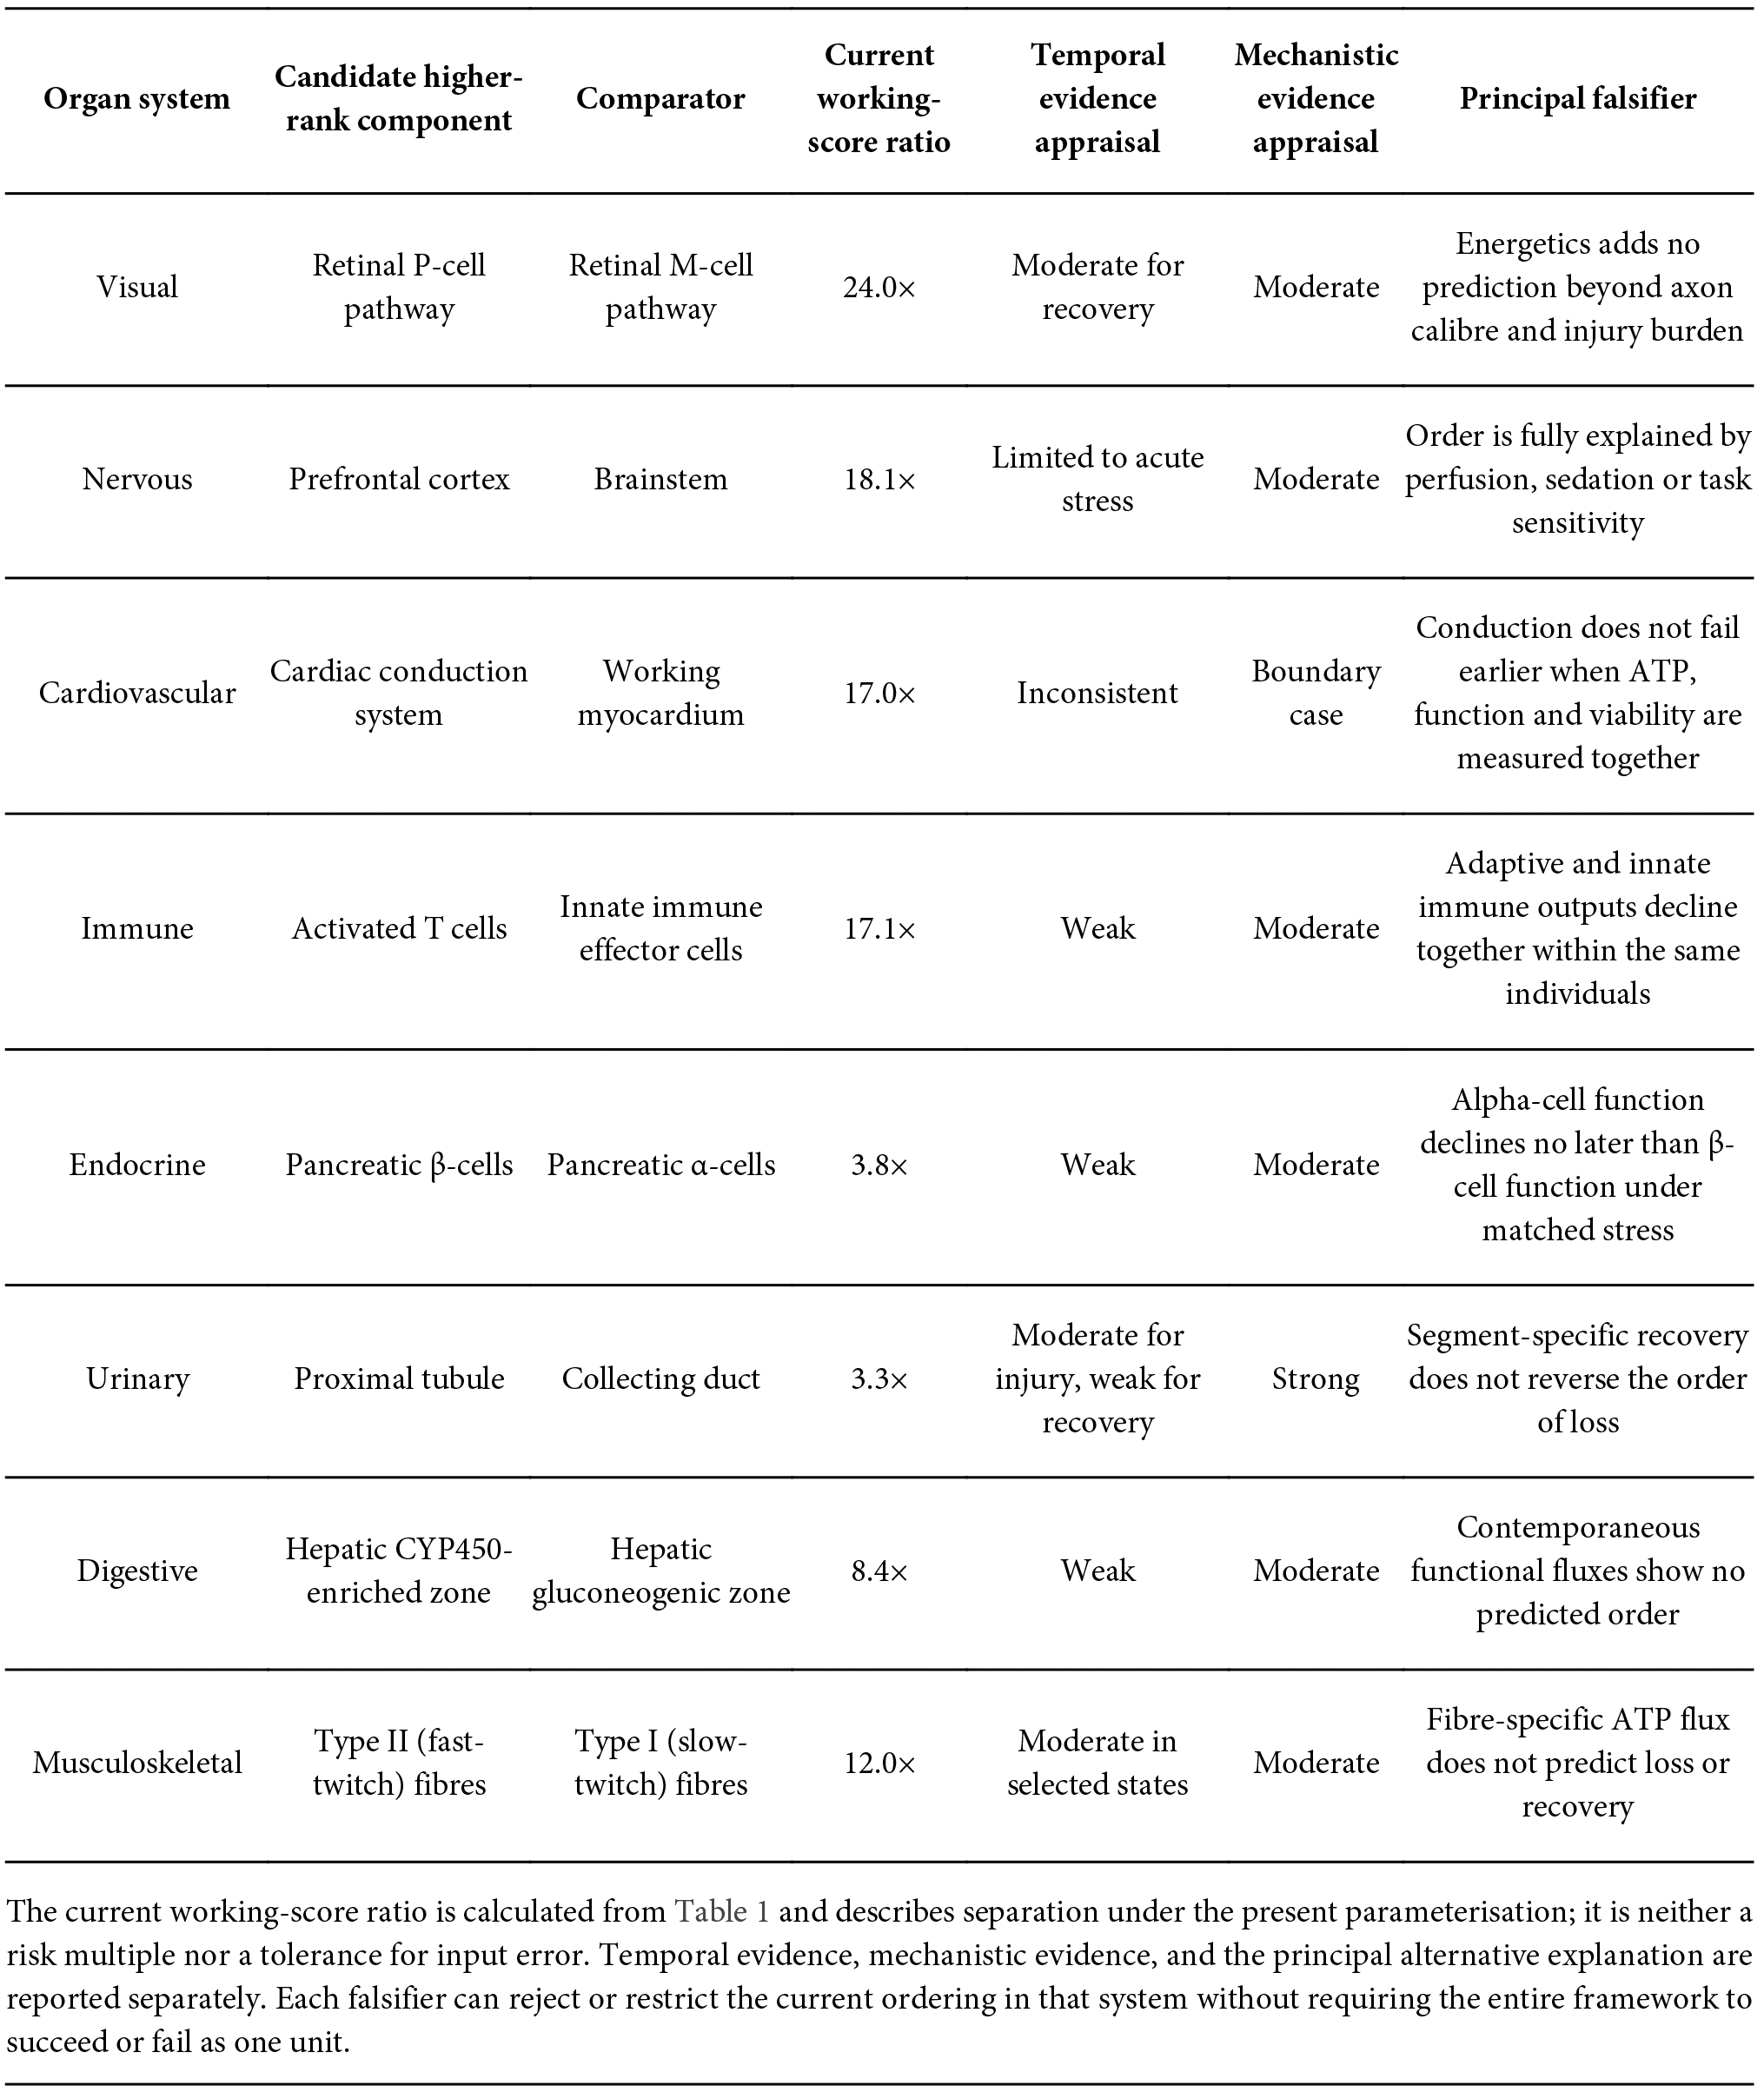
The purpose of cross-system analysis is to ask whether similar supply–demand architectures recur, not to accumulate examples in support of the theory (Table 2). Each system is assessed against five criteria: a prespecified functional comparison, an independently measurable energetic mechanism, evidence on decompensation time, evidence on recovery time, and a result that would falsify the proposed order. Evidence is uneven. Optic neuritis provides longitudinal evidence of asynchronous functional recovery, whereas the nephron provides relatively strong evidence on segmental demand–delivery anatomy; these support the framework from the distinct dimensions of recovery order and injury susceptibility. Liver, immune, and respiratory cases remain mainly mechanistic, while cardiac conduction, the loop of Henle, and skeletal muscle expose limitations of single variables or current assignments. The nine systems form a comparative research map, not nine validations.
The visual system: the paradigm case
The visual system permits pathways, functions, evolutionary traits, and longitudinal clinical outcomes to be studied within one organ. Under the working assignments in Table 1, the P-, K-, and M-related pathways have V values of 420, 105, and 17.5, respectively (Figure 2b, c). These are exploratory scores: pathway-specific fixed ATP costs have not been compared directly in the same preparation, and R and T include rule-based assumptions. The order proposes a temporal hypothesis for pathway-related functions under common stress; it does not imply that colour is more important than luminance and is not directly validated by existing optic-neuritis data.
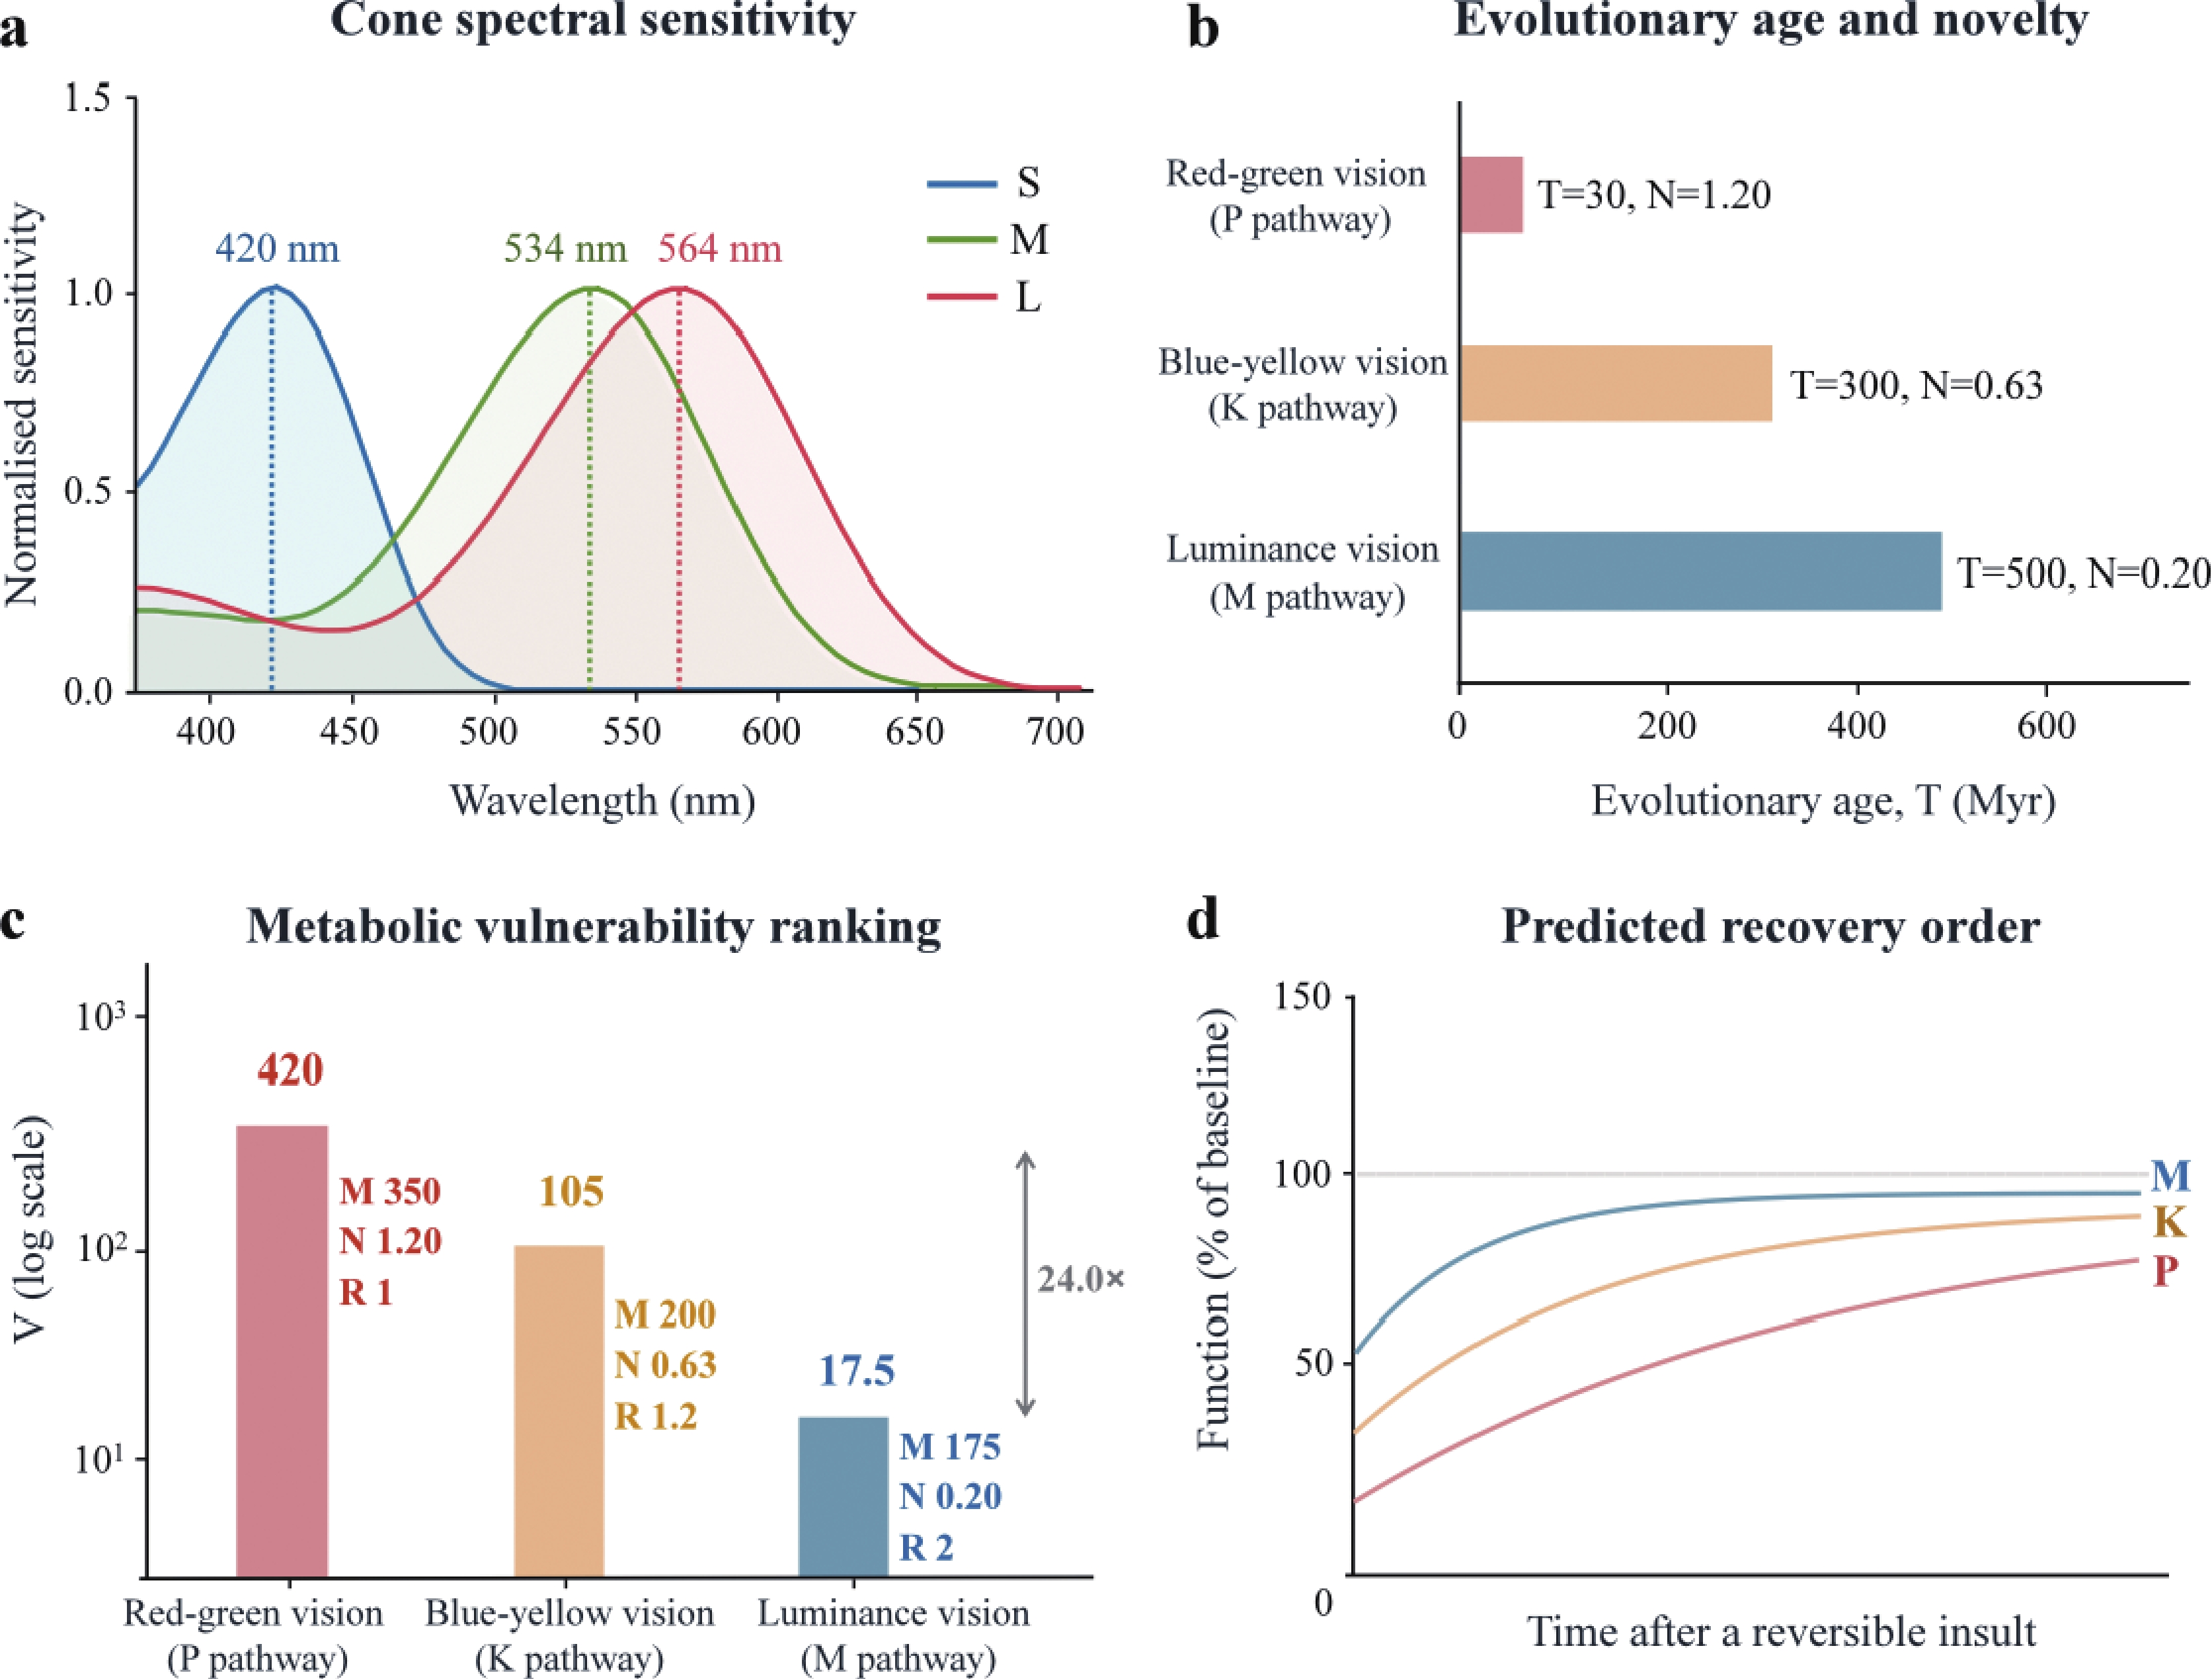
a, S-, M-, and L-cone spectral sensitivities computed from the A1 visual-pigment template at 420, 534, and 564 nm; overlap illustrates signal-discrimination requirements but does not measure P-pathway energy use. b, Working dates for P-, K-, and M-related traits and the resulting N values; these dates do not establish the origin of entire pathways. c, Hypothetical scores generated by the current M, N, and R assignments, not measured pathway vulnerability. d, Schematic trajectories after reversible injury, proposed for future comparison; the curves are not fitted to ONTT data, and high-contrast acuity and routine colour testing are not pathway-exclusive endpoints.
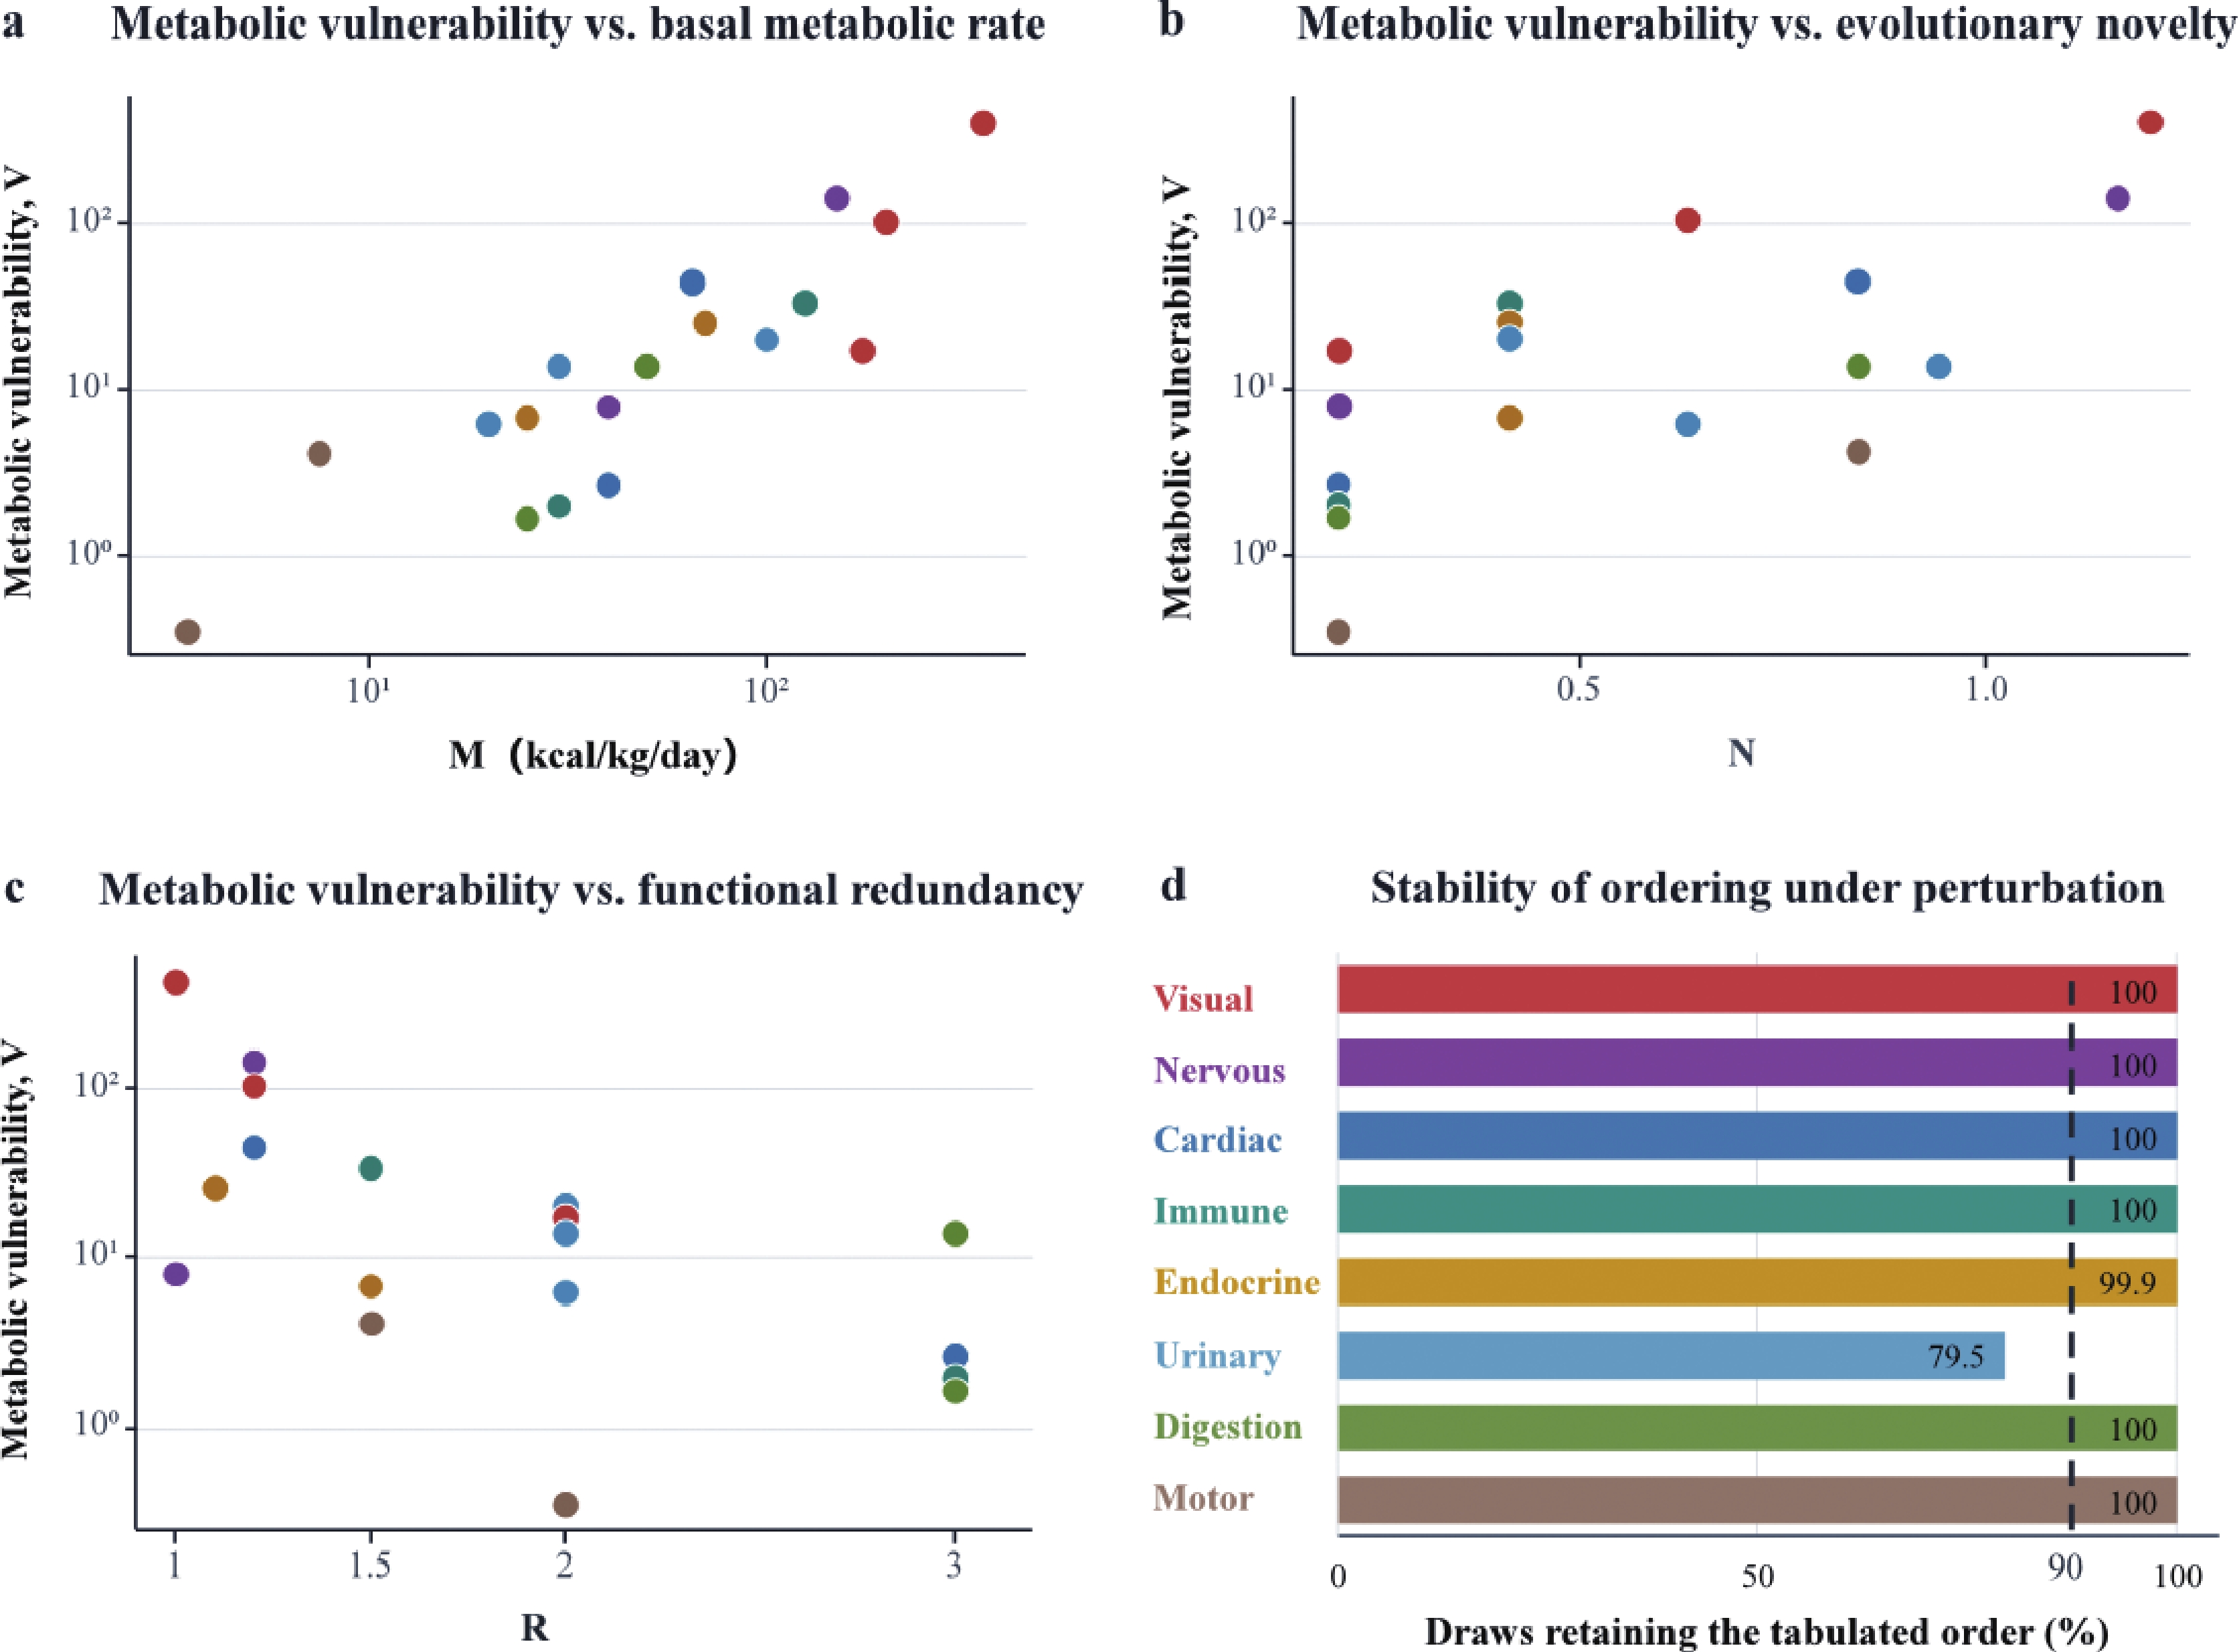
a–c, V plotted against M, N, and R. Because V is calculated directly from these inputs, the plotted relations are mathematically coupled and do not show independent causality. d, In 20,000 draws, M was resampled from its working range or within ±25% of an illustrative value, and T within ±25%, before N and V were recalculated. R, the form of N, substitute-tissue selection, component definitions, and parameter correlation were not varied; the result therefore describes only the specified M–T scenario, not overall robustness. Complete pairwise results are reported in Supplementary Table 3.
Three separable features make the P pathway a useful energetic test case. Central red-green opponency depends on comparisons between L-cone and M-cone signals whose spectral peaks are separated by only about 30 nm (Figure 2a), while midget circuits permit little spatial averaging and therefore require a high signal-to-noise ratio.[24-26] Tonic signalling imposes continuous ion-pump demand, and oxidative phosphorylation supplies most ATP used for synaptic signalling; measurements in mammalian rod photoreceptors illustrate the substantial resting ionic cost of a tonically depolarised retinal neuron but cannot be transferred quantitatively to the P pathway.[15-16,27] Retinal ganglion-cell axons are unmyelinated before the lamina cribrosa, mitochondria accumulate at sites of high local demand, and intraretinal oxygen profiles show steep gradients across metabolically active layers.[28-31] Together, these observations support direct measurement of P-pathway basal metabolic rate and functional order under specified supply constraints. They do not validate the present M assignment.
Structural and energetic accounts could in principle make distinguishable predictions in the visual system, but the available observations do not yet discriminate cleanly between them. Axon calibre does not map monotonically onto persistent chromatic dysfunction and is shaped by conduction requirements as well as energetic load.[4,8] Leber hereditary optic neuropathy provides a relevant cross-aetiology observation: in this primary complex I disorder, small-calibre fibres of the papillomacular bundle are preferentially lost and dyschromatopsia is prominent, without a demyelinating initiating lesion.[5-6,32] The resemblance to aspects of demyelinating optic neuropathy motivates a shared energetic-sensitivity hypothesis without establishing it. These data in particular do not isolate parvocellular, koniocellular and magnocellular function, nor separate the contributions of axon geometry, mitochondrial distribution, inflammation and local perfusion.
The Optic Neuritis Treatment Trial demonstrates multidimensional recovery: chromatic dysfunction can persist after spatial vision has improved.[1-3,33] High-contrast acuity and routine colour testing, however, are not exclusive measures of single retinal pathways. Figure 2d therefore presents a recovery hypothesis for future testing rather than a fitted P–K–M trajectory. A decisive study must combine validated pathway-enriched psychophysical endpoints with concurrent energetic state, axonal structure, lesion burden, and treatment exposure.
The nervous system: demand against phylogenetic age
The nervous system illustrates both the appeal and the limitations of a simple evolutionary hierarchy. Association cortex supports integrative functions with substantial synaptic and network costs, whereas brainstem circuits sustain more conserved vital functions.[34-35] Table 1 assigns prefrontal cortex neurons V = 145 and brainstem V = 8.00. This is also the most assumption-dependent comparison in the table: both M values are tissue-class proxies rather than region-specific measurements, the evolutionary ages used to calculate N are approximate, and the regions differ concurrently in vascular architecture, cellular composition, connectivity, and excitotoxic exposure. The resulting V values define a proposed within-system order that must be tested during a defined insult using prespecified functional thresholds.
Acute global hypoxia offers the ordering in its most visible and its most confounded form. Consciousness and higher cognitive performance are commonly disrupted before brainstem reflexes, and brainstem-mediated functions persist at deeper physiological compromise; recovery can dissociate in the same direction, with arousal and autonomic function returning before complex cognition, and cognitive impairment persisting long after critical illness has resolved.[36-39] These observations are consistent with hierarchical recovery. They are equally consistent with sedation, temperature, seizure activity, regional perfusion and network disconnection, each of which can produce the same bedside sequence. The endpoint that discriminates is functional failure at a measured energetic deficit, not the chronological appearance of clinical signs.
Neurodegenerative disease provides a boundary case for evolutionary novelty. Alzheimer disease and frontotemporal degeneration preferentially affect large-scale association networks, which is compatible with an evolutionary novelty gradient.[40-42] Parkinson disease does not fit a simple age-only order because it targets an evolutionarily ancient circuit. Within the substantia nigra, the most vulnerable neurons have autonomous pacemaking activity and extensive unmyelinated axonal arbours, properties associated with a substantial maintenance burden.[43-44] This pattern supports a contribution from energy demand where novelty alone is insufficient, while network topology, calcium handling, proteostatic stress, and functional redundancy remain competing or interacting explanations. N must therefore be evaluated together with M and R rather than treated as an autonomous cause of hierarchical level.
Metabolic scaling constrains interpretation of the proposed neural hierarchy without proving a failure order. Total cerebral metabolic use scales with brain size, regional metabolic rate per unit volume changes with scale, and the brain consumes a share of resting energy far greater than its mass fraction.[14,45-48] The scaling exponent reported by Karbowski is defined in relation to brain volume, not body mass, and conflating these independent variables would overstate the generality of the finding. Such observations establish that energetic constraints operate in neural tissue, but they cannot support a fixed ordering across species or regions, because the studies use different independent variables, spatial scales and endpoints. Confirmation requires within-preparation comparisons in which usable supply, basal metabolic rate and functional thresholds are measured separately.
The cardiovascular system: a functional hierarchy without a structural one
The cardiovascular system first requires electrical function, mechanical work, and tissue survival to be separated. Pacemaker and conduction cells depend on precise membrane-potential dynamics, whereas working myocardium carries greater sustained mechanical and oxidative demand.[49-50] Table 1 places the conduction system above working myocardium, but this can only be interpreted as an exploratory hypothesis about a narrow functional threshold. A lower tolerance for ionic disturbance does not imply a higher basal energy requirement, and the difference between V = 45.5 and V = 2.67 is not a measured metabolic contrast.
Clinical observations are directionally consistent with this candidate ordering but do not establish a stable, function-specific temporal relationship. Electrical abnormalities can precede detectable mechanical dysfunction during ischaemia, and conduction disturbance is over-represented in diabetes and in primary mitochondrial disorders.[21,51-53] This concordance is clinically important and evidentially incomplete. Electrocardiographic change may arise from extracellular potassium, autonomic tone, regional ischaemia, or fibrosis, and no prospective study has shown that conduction dysfunction systematically precedes contractile impairment within the same patients across graded metabolic stress. That comparison is the required test, and it has not been done.
A cardiac boundary case: functional sensitivity without structural fragility
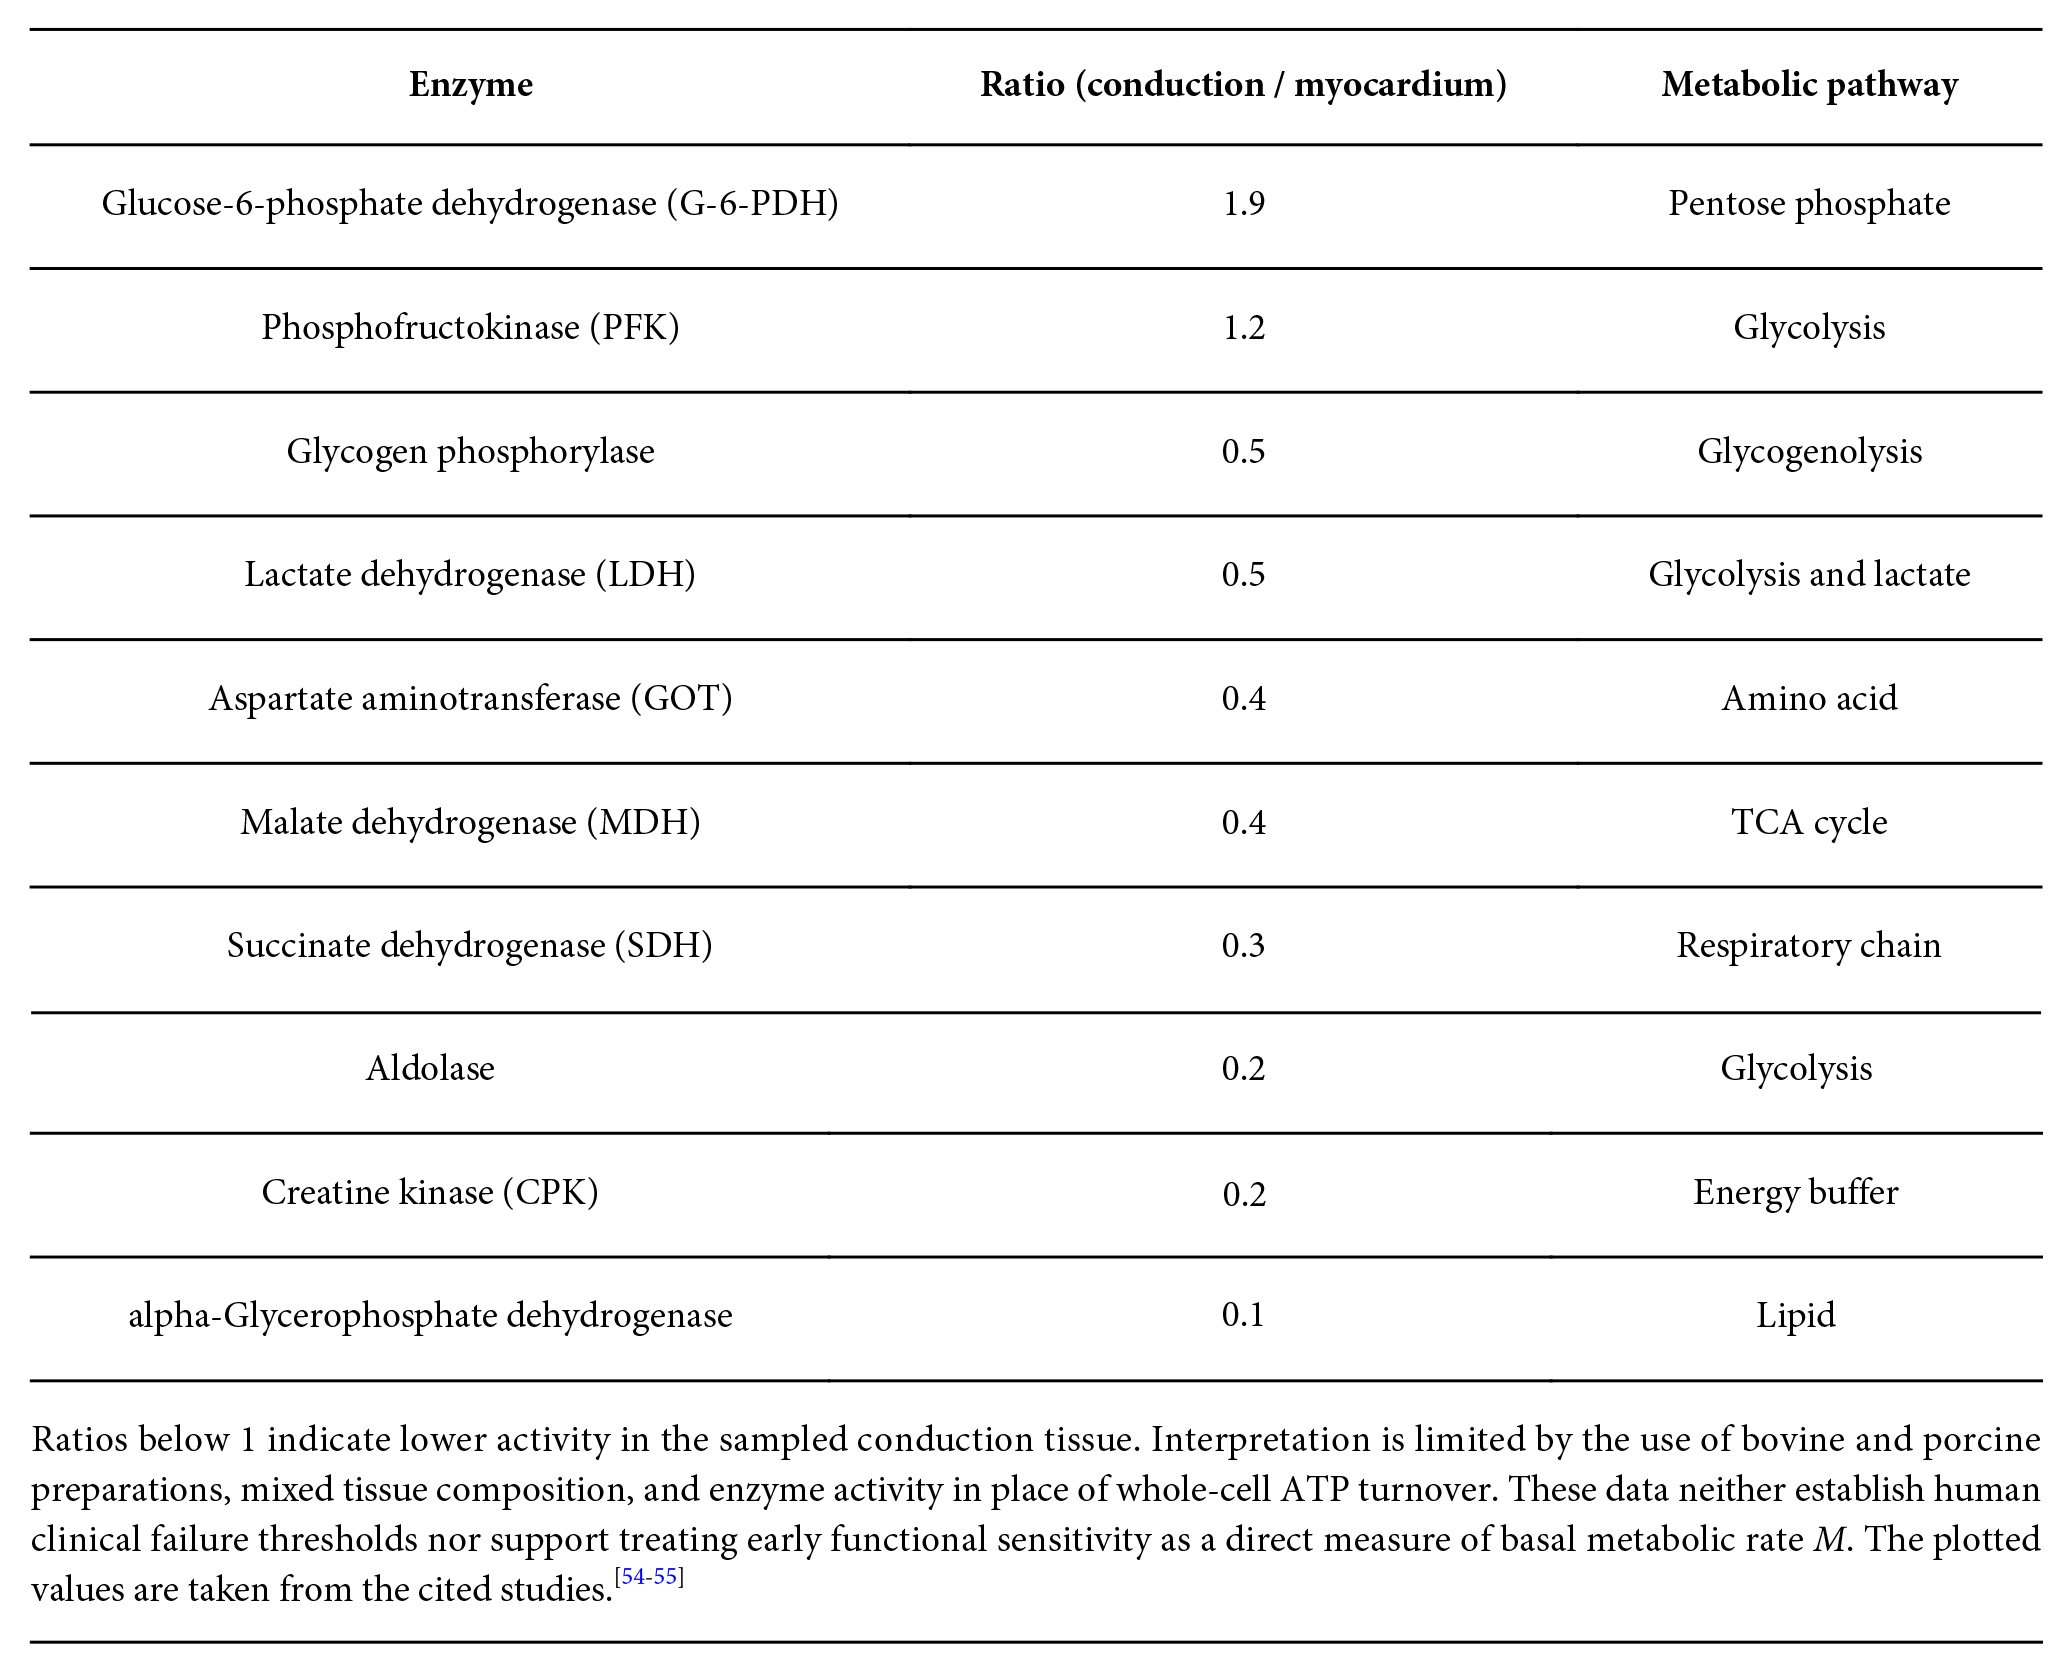
Enzyme histochemistry directly challenges a simple oxidative interpretation of the core equation. If higher M or V denoted greater oxidative capacity, conduction tissue would be expected to exceed working myocardium, yet available comparative data show the opposite. In bovine and porcine preparations, conduction tissue has lower succinate dehydrogenase, malate dehydrogenase, and creatine kinase activity than working myocardium, together with higher glucose-6-phosphate dehydrogenase activity (Figure 4a).[54-55] Purkinje fibres are glycogen rich, can preserve phosphocreatine and ATP during brief ischaemia while myocardial high-energy phosphates fall, and may survive within infarcted regions in which myocytes are lost.[56-57] These findings show that early conduction dysfunction, oxidative phenotype, and structural survival are distinct endpoints; M must not be equated with mitochondrial abundance.
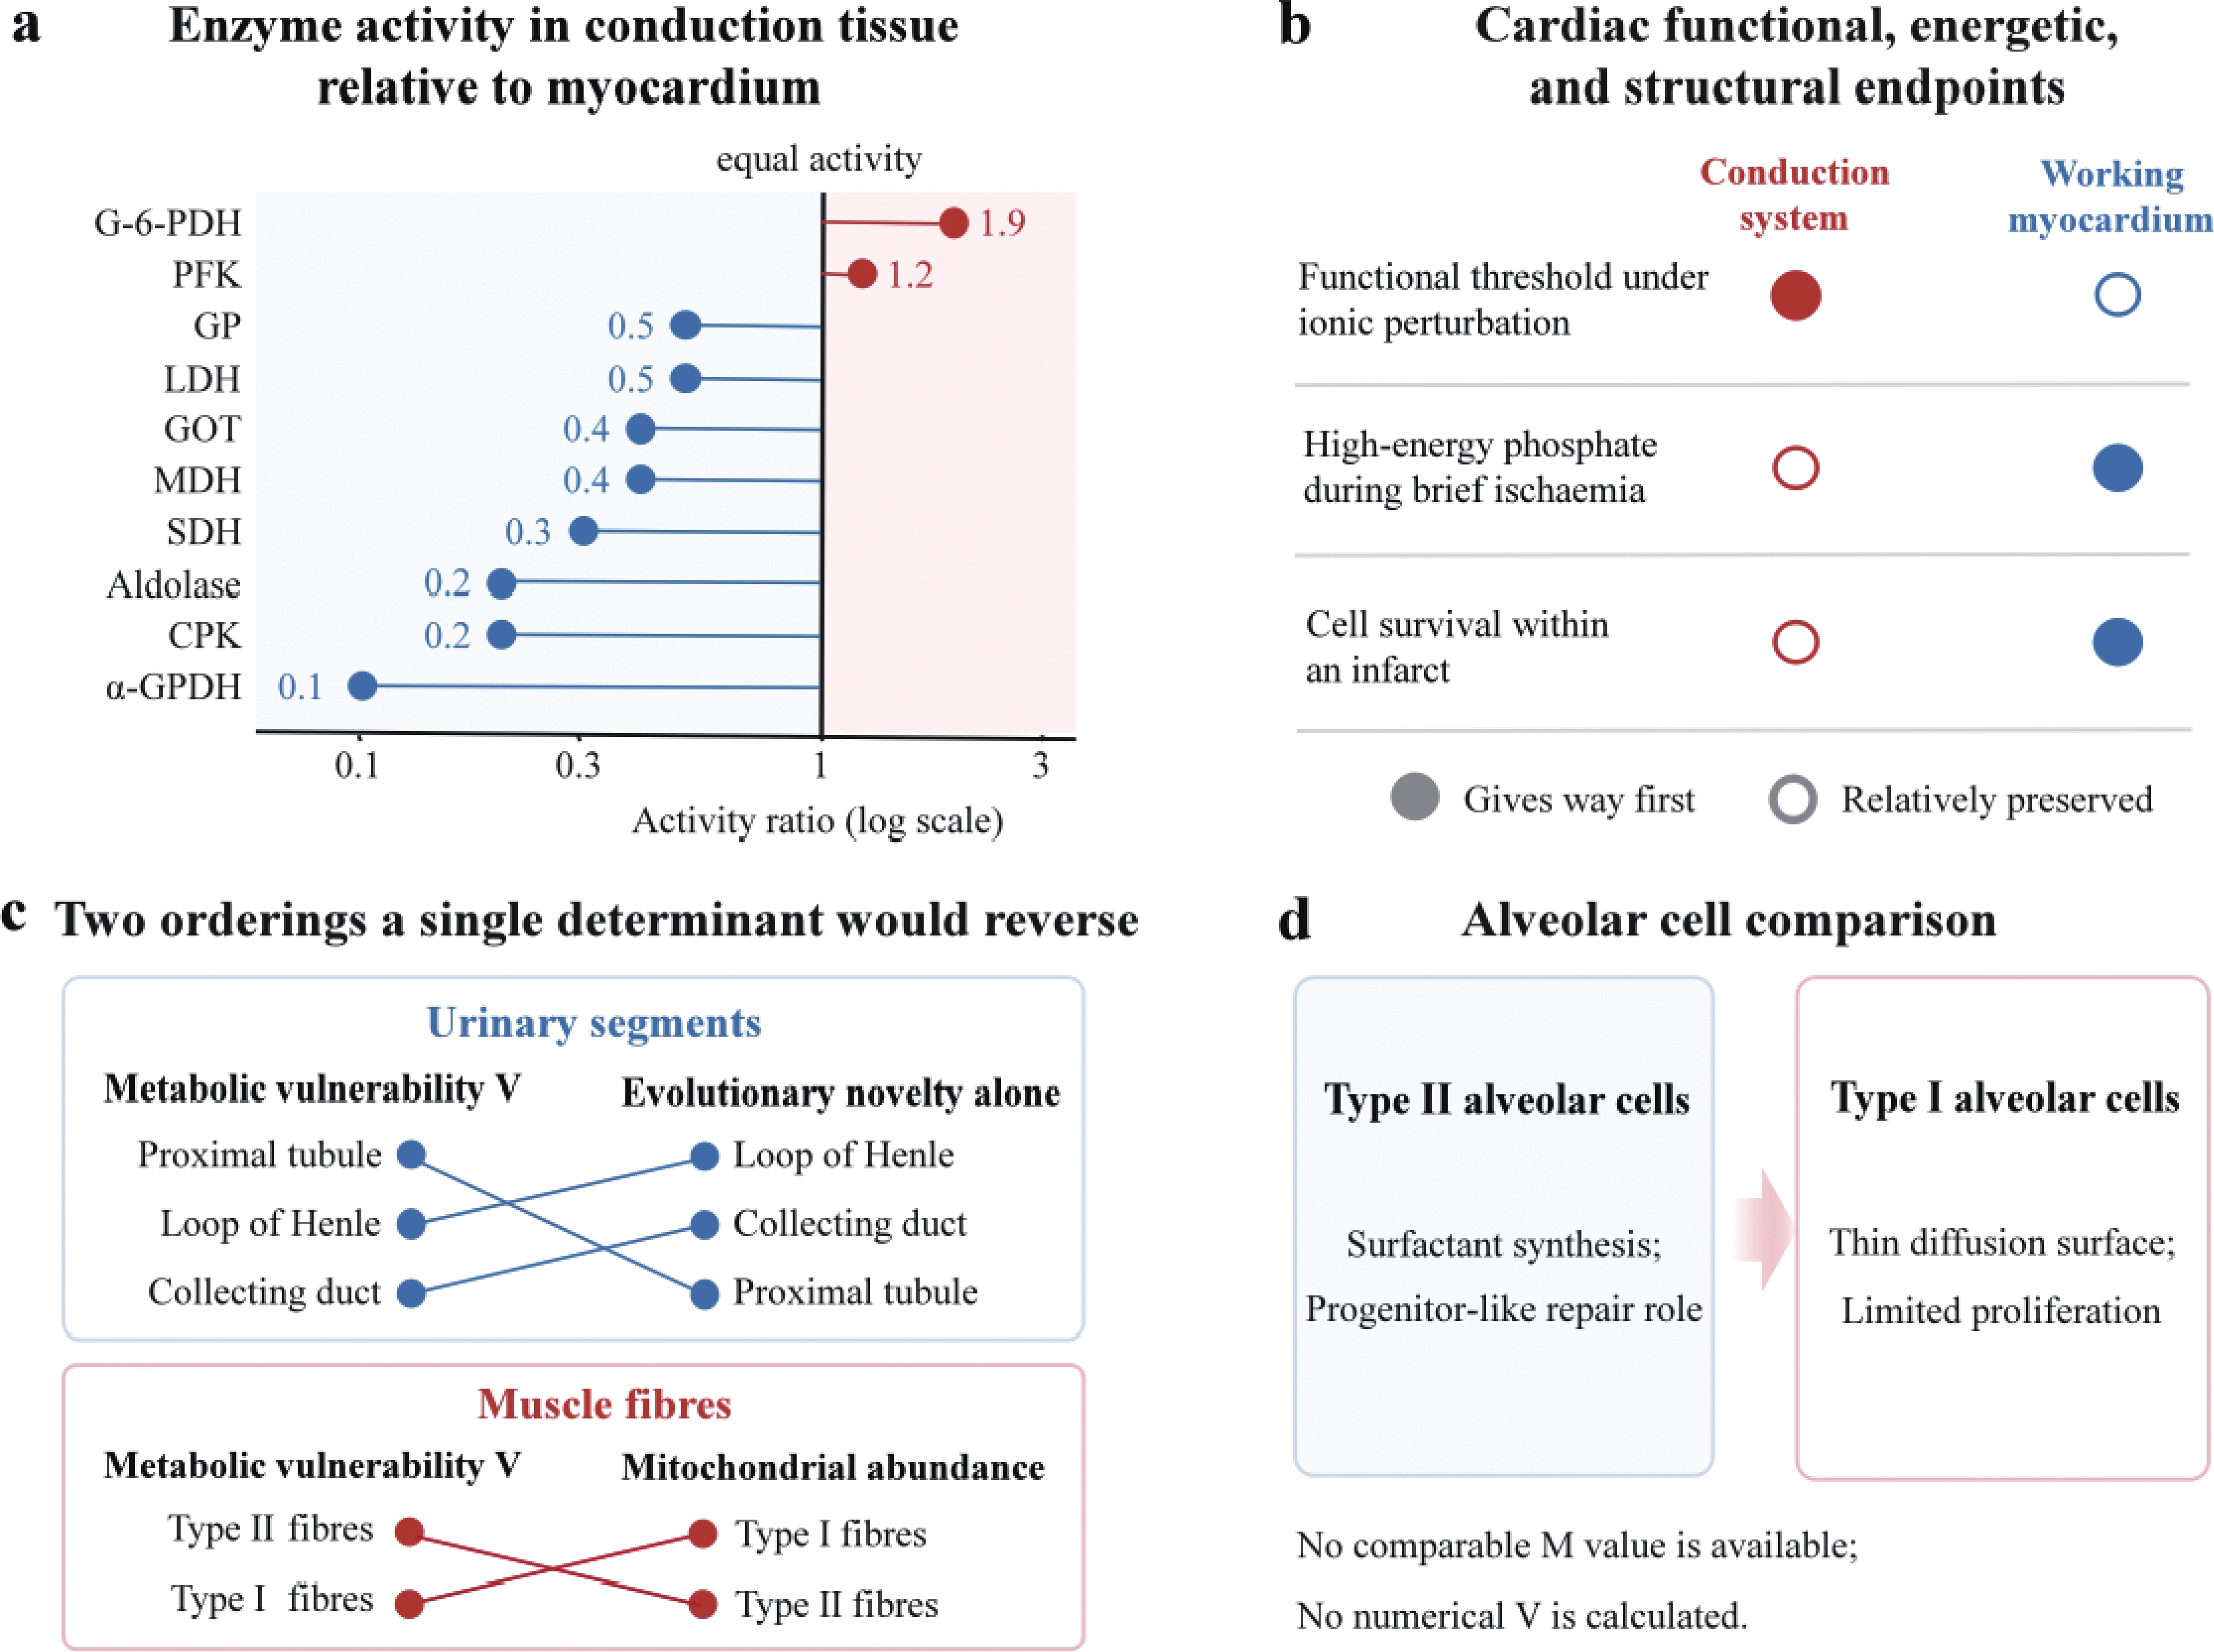
a, Enzyme-activity ratios in conduction tissue relative to working myocardium from heterogeneous bovine and porcine preparations; enzyme activity is not whole-cell ATP flux.[54-55] b, Cross-study synthesis of cardiac functional threshold, high-energy phosphate state, and structural survival; it is not a within-subject time series. c, Nephron and muscle comparisons can reverse when ranked by a single determinant rather than the current composite score; neither ordering is yet validated. d, Type II alveolar cells self-renew and generate Type I cells, demonstrating repair dependence. Because comparable M values are unavailable, no apex/base rank or numerical V is assigned.
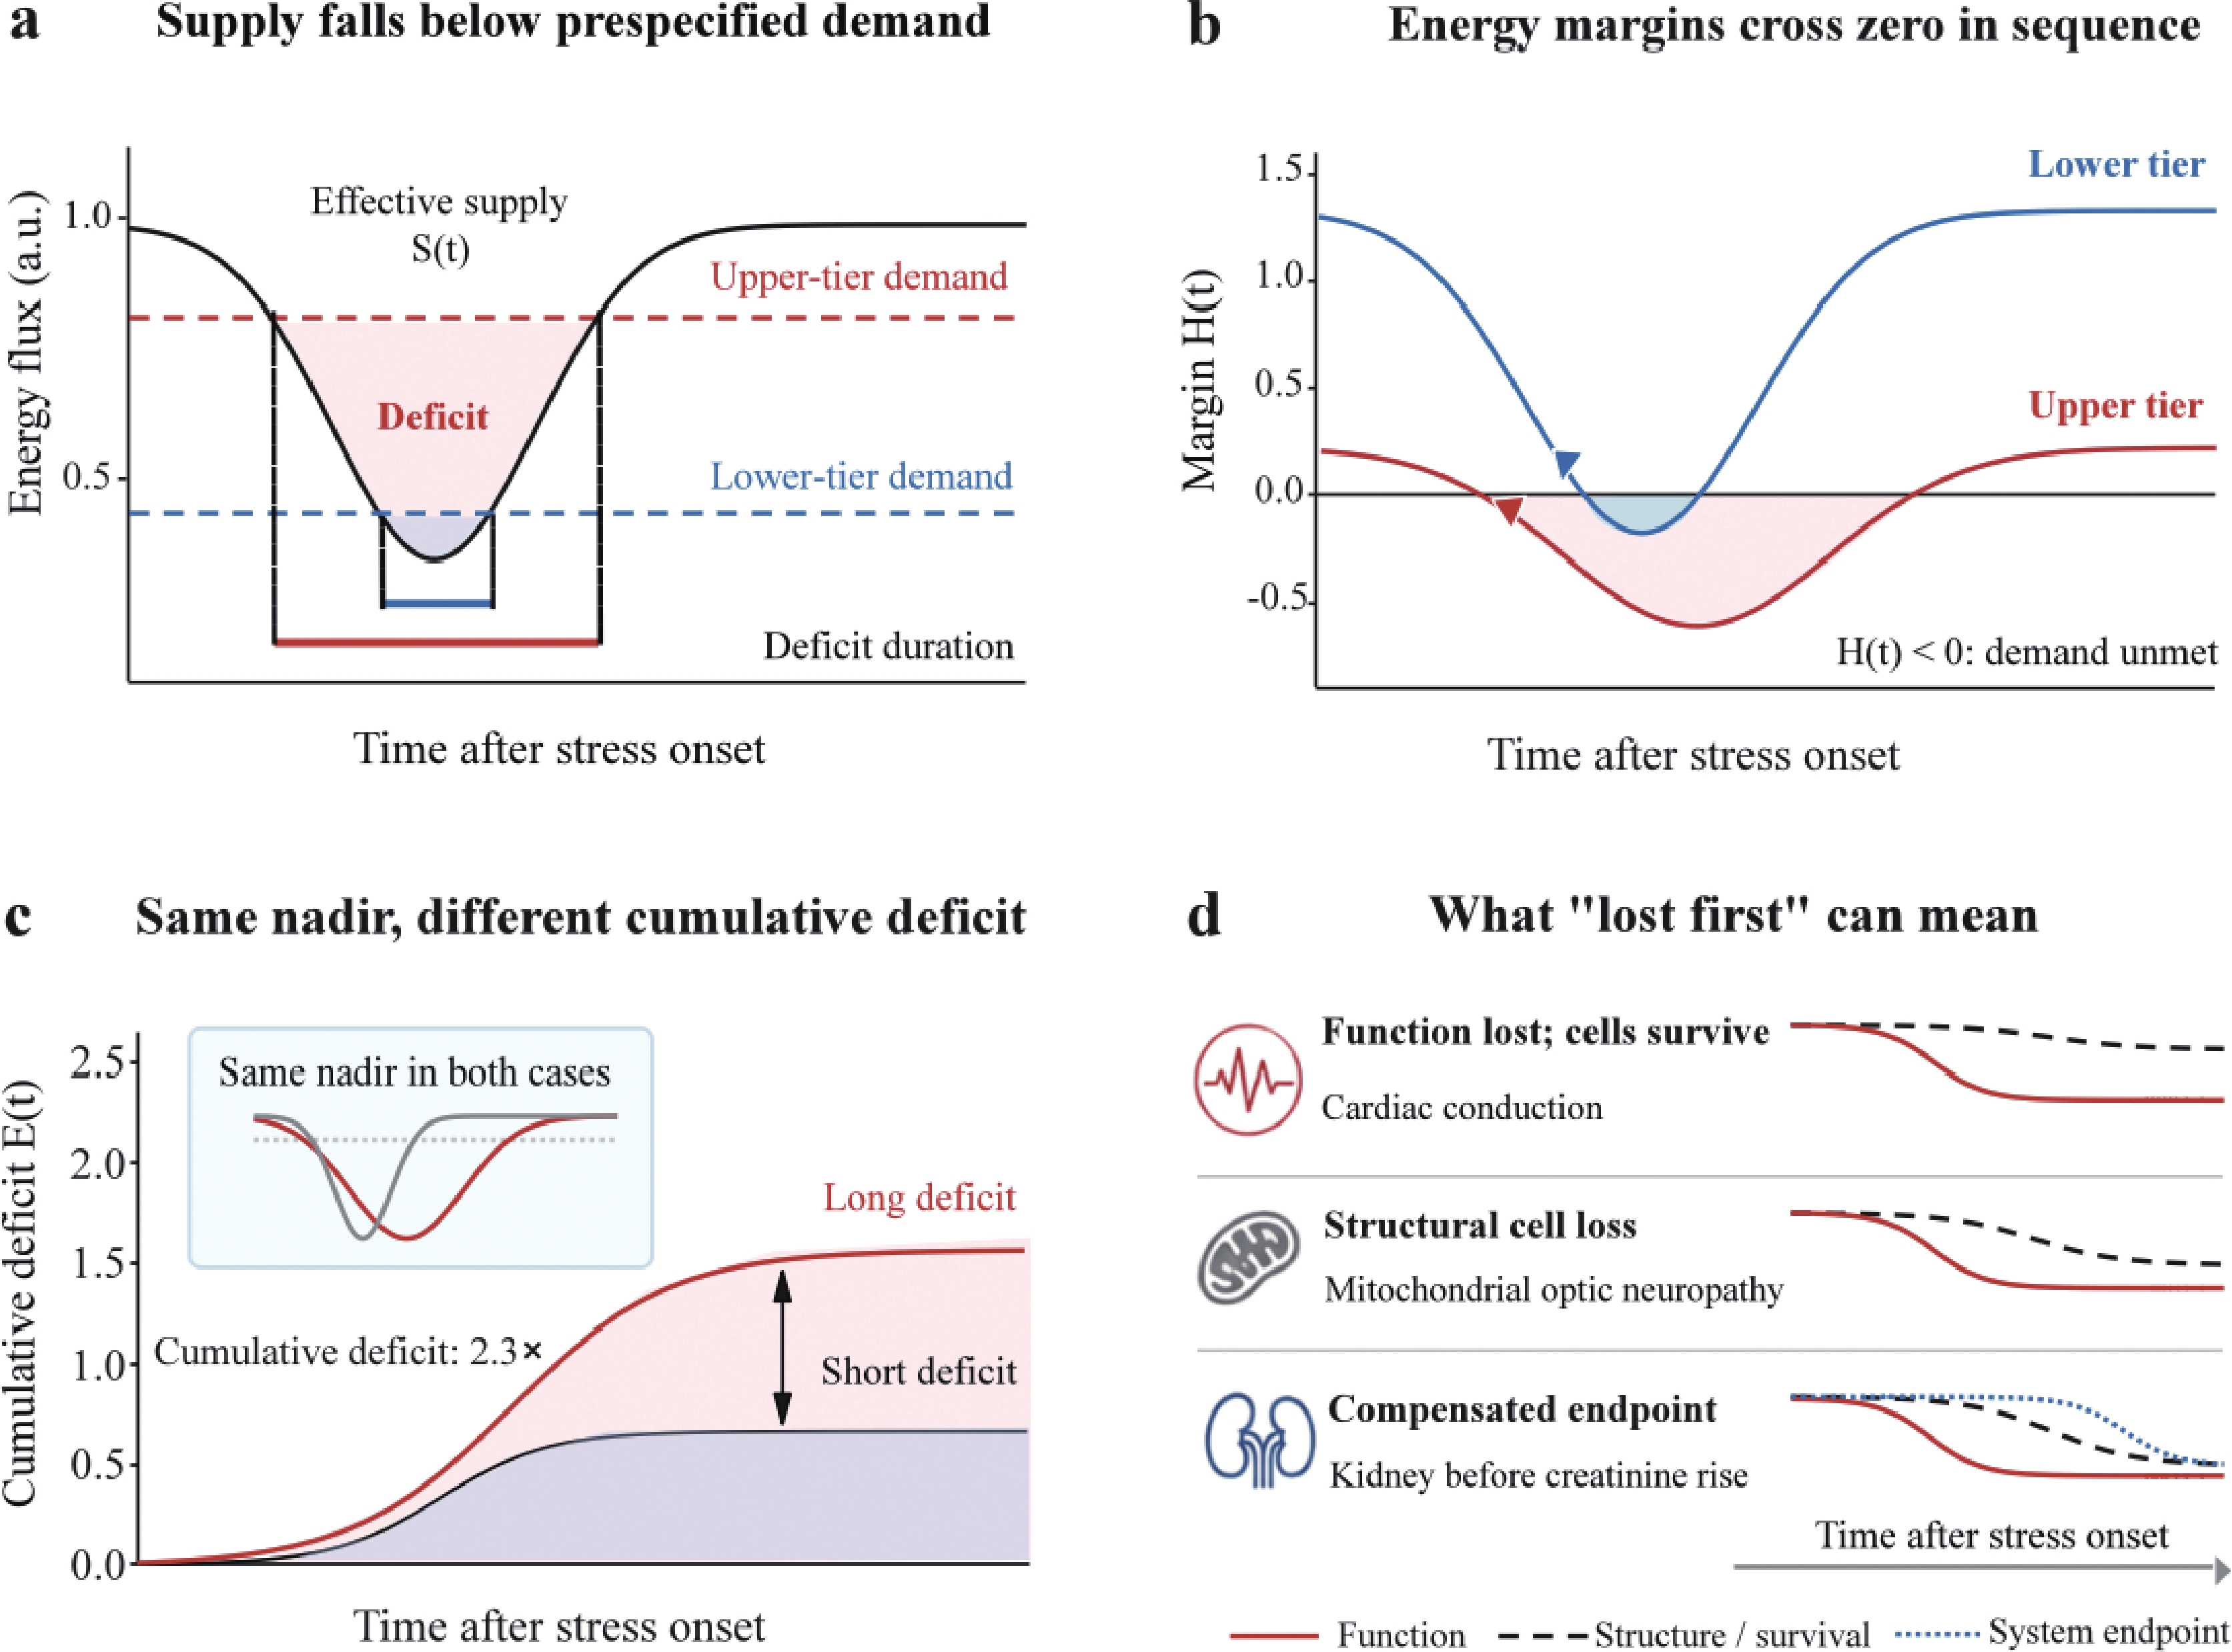
a, Schematic effective supply S(t) and two prespecified demands D(t); the higher-demand component develops a deficit earlier under the same supply trajectory. b, H(t) calculated from Equation 3; it contains neither N nor R and is not derived directly from V. c, E(t) is the time integral of the positive difference D(t) − S(t). The illustrative 2.3-fold ratio is generated by arbitrary schematic parameters and only shows that deficit duration changes cumulative burden; E does not measure the unpaid cost of repair. d, Functional abnormality with cell survival, structural cell loss, and component injury masked at the system level are three different meanings of “lost first”. Panels a–c are schematic, not measured data.
The cardiac evidence accordingly requires functional sensitivity to be separated from energetic consumption and structural survival. Conduction may become unreliable after a relatively small disturbance of ionic homeostasis while the relevant cells remain viable, whereas working myocardium may retain electrical activity as mechanical output declines. The candidate description is thus functional hypersensitivity with structural tolerance, not general energetic fragility (Figure 4b). Species differences, mixed tissue sampling and the high mitochondrial volume of ventricular myocardium further limit quantitative comparison.[54,58] A valid test must measure conduction, contraction, ATP turnover and viability in parallel under the same graded stress. Concordance across those endpoints would support a common tier; dissociation would show that the apparent ordering depends on the outcome chosen.
The urinary system: transport demand meets marginal delivery
The kidney is well suited to within-organ comparison because transport load, local oxygenation, and functional output can be measured by nephron segment. The proximal tubule performs extensive active reabsorption; the thick ascending limb also depends strongly on Na+/K+-ATPase; and collecting-duct demand varies with hormonal and solute conditions.[59-61] Table 1 nevertheless compares the proximal tubule, the entire loop of Henle, and the collecting duct, even though thin limbs and the thick ascending limb use different transport mechanisms. Future tests must disaggregate these segments. Current V values are working hypotheses, not a whole-kidney failure sequence.
The renal mechanism is informative because it is geometric rather than merely correlational. Ischaemia and nephrotoxins often preferentially injure the proximal tubule, particularly the S3 segment, where high transport demand meets marginal oxygen supply in the outer medulla.[62-64] Demand and supply can be measured independently and their intersection is anatomically localised. This geometry also predicts that the order can change: medulla-focused insults or segment-specific transporter perturbations could move the thick ascending limb or collecting duct toward earlier decompensation irrespective of its baseline working rank.
Where a novelty-dominant model gives the wrong renal prediction
The loop of Henle is an internal stress test for the novelty term. The mammalian urine-concentrating apparatus is relatively derived, and Equation 2 assigns the loop the third-highest novelty value in Table 1, N = 0.94. Much of the loop, however, operates passively, while active transport is concentrated in the thick ascending limb.[65] A novelty-dominant model would place the entire loop at the renal apex (Figure 4c), whereas a demand-dominant model predicts a lower, insult-dependent position. The current parameterisation favours the proximal tubule by the narrow margin reported in Table 1, and the absence of comparable segment-specific measurements means that this order could reverse. Such a reversal would discriminate between the proposed determinants and expose limitations in the current inputs; it should not be read retrospectively as confirmation of either model.
Urinary neutrophil gelatinase-associated lipocalin (NGAL) and related markers may rise before serum creatinine, supporting temporal dissociation between tubular injury and whole-kidney filtration indices.[66] NGAL is an injury signal, while creatinine is influenced by systemic compensation and its own kinetics. Neither directly measures segmental transport function, so neither can validate an order among the proximal tubule, thick ascending limb, and collecting duct. Recovery order requires serial, segment-specific functional measurements; existing data are too limited to claim that loss and recovery already occur in reverse order.[67]
The digestive system: hierarchy among functions of one cell population
The liver case compares functions performed by overlapping hepatocyte populations rather than a simple anatomical hierarchy. CYP450 reactions require electron transfer, NADPH regeneration, and enzyme-protein turnover; gluconeogenesis, ureagenesis, and protein synthesis have different substrate and temporal constraints.[68-69] Table 1 contrasts a CYP450-enriched zone with a gluconeogenic zone, but the specific traits represented by T = 200 Ma and 500 Ma are not yet defined, and M values are not contemporaneous functional fluxes. V = 14.0 and V = 1.67 are therefore planning values for measurement, not an established hepatic order.
Clinical evidence is suggestive but confounded by intrinsic marker kinetics. Drug clearance changes in cirrhosis and critical illness, whereas transaminases indicate injury, prothrombin time integrates several processes, and albumin has a half-life of approximately three weeks.[70-73] Markers with different response times can create an apparent hierarchy even under uniform injury. This is the null hypothesis that the framework must exclude. Prospective studies must therefore compare contemporaneous functional fluxes, such as labelled-substrate clearance and a synthetic rate, rather than infer order from static assays.
Lobular zonation supplies a plausible mechanistic link between hepatic function and metabolic vulnerability. Centrilobular hepatocytes combine high expression of several P450 enzymes with the lowest oxygen tension in the lobule, and toxins requiring P450 activation preferentially injure this region.[74] The coincidence of high fixed cost and marginal delivery also recurs in the renal outer medulla and prelaminar optic nerve. This recurrent geometry provides a structural rationale for treating dynamic energetic margin as a cross-system variable; in the liver, however, the operative term may be local oxygen delivery or toxicant activation rather than energy demand itself.
The endocrine system: vulnerability created by metabolic coupling
Pancreatic β-cells illustrate tight metabolic–secretory coupling: glucose-stimulated insulin secretion depends on an increased ATP/ADP ratio, so oxidative-metabolic disturbance can rapidly alter output.[75-76] This implies a sensitive functional threshold, not necessarily a high basal M. α-cells use different sensing and secretory mechanisms and may become dysregulated rather than simply preserved. The β/α difference in Table 1 is driven mainly by working M and R assignments and requires direct testing under matched stress and functional endpoints.
Limited antioxidant defence may further narrow β-cell energetic margin: classic comparative data show markedly lower glutathione peroxidase and catalase activity in islets than in most other tissues.[20] This is consistent with limited redox reserve, but it does not justify equating R in Equation 1 with a single antioxidant measurement. In the endocrine system, functional redundancy may involve cell number, secretory plasticity, substrate switching, stress-response capacity, and repair or regeneration; no single antioxidant marker represents these dimensions, which should in principle be quantified separately. The α-cell R value in Table 1 is a rule-based illustrative assignment, not a direct measurement.
Systemic observations support state-dependent resource allocation while cautioning against a fixed endocrine ladder. Type 2 diabetes develops through interaction between insulin resistance and progressive β-cell dysfunction, while α-cell regulation is altered rather than simply preserved; a component assigned a lower candidate rank is therefore not necessarily unchanged during disease.[77-78] In another context, critical illness suppresses reproductive axes while maintaining stress responses of more immediate relevance to survival.[79-80] These are genuine examples of allocation priority, but they operate through different feedback loops and on different time scales. They should therefore be treated as related tests of the allocation pillar, not as rungs of a single hierarchy.
The immune system: allocation made explicit
Immune comparisons must match cellular state and functional output. Quiescent, activated, and memory states have markedly different metabolic programmes, and activated macrophages, neutrophils, and lymphocytes all undergo metabolic reprogramming. Activated T cells carry inducible costs of clonal expansion, biosynthesis, and memory formation, but those costs cannot be compared directly with an unspecified resting innate-cell state.[81-82] The V values in Table 1 therefore motivate state-matched experiments; they do not establish that adaptive immunity is universally more vulnerable than innate immunity.
Undernutrition provides early clinical observations while also exposing their principal limitation. Cell-mediated immunity, vaccine responses, and lymphocyte proliferation are impaired by protein-energy malnutrition, establishing the sensitivity of antigen-specific responses to resource restriction.[83-85] Innate defence is not spared, however, because severe malnutrition also compromises barrier integrity, phagocyte function, and complement. The defensible claim is comparative and must be measured within individuals: selected adaptive outputs may decline at milder resource restriction than selected innate outputs. The categorical proposition that adaptive immunity fails while innate immunity remains preserved is inaccurate and should be avoided.
Immune recovery tests reconstruction as well as restoration within surviving cells. During nutritional rehabilitation, selected innate-cell counts and functions may normalise before antigen-specific repertoire and memory, but timing depends on infection, thymic function, age, and prior immunity.[86] In the dynamic model, repopulation and repertoire rebuilding can themselves increase Di(t) during recovery, creating a testable mismatch between high reconstruction demand and still-limited supply. Cell replacement and restoration within surviving cells must not be treated as the same repair mechanism.
The musculoskeletal system: ATP turnover against mitochondrial abundance
Skeletal muscle tests whether fixed energy cost predicts vulnerability better than mitochondrial abundance. Type I fibres are mitochondria-rich and fatigue-resistant, whereas Type II fibres generate rapid force and have greater activity-dependent calcium-handling demands.[87-88] Preferential Type II atrophy in some catabolic or denervating states challenges a simple “more mitochondria, more vulnerable” account but does not validate Table 1. The current M values of 7.5 and 3.5 mix activity-dependent and basal demand and should be replaced by ATP-flux measurements in matched recruitment states.
A candidate discriminator is the energy cost of maintaining rapid excitation-contraction machinery and fibre size rather than glycolytic metabolism itself. Type II fibres show greater ATP use for calcium handling in several preparations and express different sarcoplasmic-reticulum ATPase isoforms.[89-91] Human studies do not reproduce every large effect reported in rodents, and maximal uptake rates can be similar between fibre types. For a valid parameterisation, M should estimate basal metabolic rate under a defined recruitment state and should be interpreted together with the additional variable cost of activation; it cannot be assigned from a fibre-type label, glycolytic phenotype, or mitochondrial content alone.
Preferential Type II fibre atrophy has been reported in critical illness, denervation, cachexia, and ageing, but it is neither universal nor sufficient to establish a functional loss or recovery sequence.[92-96] Neural injury, unloading, corticosteroid exposure, inflammation, and motor-unit remodelling can alter the observed order. Muscle remains experimentally useful because recruitment can be manipulated to change activity-dependent demand while much of the cellular machinery is held approximately constant. A within-muscle perturbation can therefore test whether changing the ratio of fixed to variable cost alters decompensation and recovery in the predicted direction, creating a discriminating within-system comparison.
The respiratory system: a qualitative case that reveals interdependence
The respiratory system is retained only as a qualitative case of repair interdependence because comparable component-level metabolic parameters are unavailable for Type I and Type II alveolar epithelial cells. Type I cells form most of the gas-exchange surface, whereas Type II cells synthesise and recycle surfactant and serve as progenitors.[97-98] These differences justify comparison of functional, structural, and regenerative thresholds, but do not justify assigning an apex/base rank or calculating V.
Experimental hyperoxia illustrates non-linear state change but does not identify an energetic hierarchy. Excess oxygen alters mitochondrial gene expression and ATP metabolism in rat Type II cells, with an early compensatory phase followed by deterioration.[99] This course is compatible with threshold behaviour in energetic margin, but equally compatible with direct oxidant injury; mitochondrial membrane potential may remain normal even after ATP content changes. The data support compensation and threshold dynamics more strongly than any particular respiratory rank.
Alveolar repair reveals network dependence among components. Type I cells have limited proliferative capacity, whereas Type II cells self-renew and generate Type I cells after injury.[100] Type II injury may therefore restrict restoration of the Type I surface, but this is repair-network coupling, not a hierarchy derived from M, N, and R. Intervention studies should measure function, survival, and regeneration concurrently.
The differing efficacy of exogenous surfactant in adult acute respiratory distress syndrome and neonatal surfactant deficiency shows that replacing a product is not equivalent to restoring the cell state that produces, regulates, and recycles it.[101-104] Adult disease also involves inflammation, oedema, endothelial injury, and surfactant inhibition. These observations define the boundary of an energetic explanation and cannot be treated as validation of the Hierarchical Principle.
Integration: What Recurs Across Systems—and What Does Not
What recurs across systems is the relation among within-system demand, effective supply, functional thresholds, and repair mode—not a universal ranking of whole organs. The evidence includes longitudinal observations, tissue physiology, mechanistic analogy, and boundary cases with unequal weight. Optic neuritis shows asynchronous multidimensional recovery, nephron anatomy shows spatial separation of demand and delivery, and skeletal muscle shows that mitochondrial density alone is insufficient. Before any sequence is interpreted, functional abnormality, structural loss, and system-level compensation must be distinguished.[105]
Three meanings of “lost first”
The phrase “lost first” conceals at least three different outcomes. First, function may become abnormal while cells remain alive, as in cardiac conduction. Second, a cell population may be structurally lost, as in advanced mitochondrial optic neuropathy. Third, a component may be substantially injured while a system-level endpoint remains stable through compensation, as in the kidney before serum creatinine rises. These outcomes have different thresholds, time constants, and reversibility. V ranks a prespecified component comparison; it does not determine which endpoint an individual patient will cross. Every test must define the endpoint in advance.
Energetic margin describes actual supply–demand state, but no calibrated mapping currently derives H or a functional threshold from V. Components do not fail because V is high; they fail when effective supply no longer meets the demand of the defined function. Under standardised stress and comparable delivery, a higher preregistered V should predict earlier threshold crossing, while measured H records whether that prediction occurs. Discordance must trigger a prespecified response—parameter revision, domain restriction, or rejection—not post hoc invention of another tier.
Loss and recovery are related but need not be mirror images. Recovery may require metabolic normalisation, remyelination, channel relocalisation, network reconfiguration, regeneration, or complete cell replacement, each with different cost and rate-limiting steps. Myocardial stunning demonstrates a measurable lag between restoration of high-energy phosphates and mechanical recovery.[21-23] On this basis, the framework further proposes that the lag may relate to cumulative supply–demand deficit rather than only to nadir depth. The asymmetry prediction fails if, after comparable reversible injury, recovery consistently follows the same order as loss or proves independent of repair mode.
Recurring architecture, not a cross-organ ladder
The renal outer medulla, pericentral hepatic region, and prelaminar optic nerve each place relatively high or inflexible demand near marginal delivery.[29,31,64,74] This convergence supports local supply–demand difference as a measurable variable and motivates comparative research, but the tissues differ in exposure, cell composition, and functional endpoints. Existing evidence does not show that they share one quantitative law.
Architectural similarity does not make numerical inputs commensurate. Demand may be reported per cell, tissue mass, organ, or individual; evolutionary dates may refer to gene duplication or functional innovation; and R combines distinct forms of substitutability. Table 1 discloses working inputs and must not be used to infer which organ fails first. Multiorgan-dysfunction studies have not validated a V-based cross-organ ranking.[106-108]
Within-system comparison permits better matching of component definition, stressor, and endpoint, but score span is not robustness. The visual 24.0-fold, urinary 3.3-fold, and endocrine 3.8-fold differences all arise from current assignments. Stability requires uncertainty in R, the functional form of N, substitute-tissue selection, and parameter correlation to be incorporated. Table 3 therefore presents temporal evidence, mechanistic support, and a decisive falsifier rather than interpreting V ratios as effect sizes.[109]
Mechanistic Basis: Why a Hierarchy Might Arise
Functional performance under energetic constraint can be decomposed into four measurable processes: demand, delivery, buffering, and repair. D is the demand required for a prespecified function; S is effective supply; H is the instantaneous margin computed from D and S; R provisionally represents substitutability and the propagation of component deficit to system output; and cumulative deficit E records historical burden during injury. N is a candidate historical prior, not an energetic mechanism. These processes must be measured separately so that discordance can be attributed to demand, supply, endpoint buffering, or repair rather than to post hoc reranking.
Fixed costs set the lower bound of expenditure below which the defined function cannot be maintained. They include Na+/K+-ATPase activity, membrane-potential maintenance, protein and lipid turnover, and mitochondrial proton leak; synaptic, secretory, and contractile activity add state-dependent demand above that floor.[10-13,15-17] Cytochrome-oxidase activity is a proxy for sustained neural activity, not a direct measure of ATP flux.[110] The discriminating quantity is the fraction of demand that remains when activity approaches zero, which must be measured rather than assigned by cell-type label.
Delivery determines whether demand can be met and may outperform the static rank under a particular stressor. Si(t) includes local perfusion, oxygen extraction, substrate transport, and anatomical diffusion distance. The same component may fail early during hypoxaemia yet remain unaffected by a toxin that spares its supply route. Marginal delivery in the renal outer medulla, pericentral liver, and unmyelinated prelaminar optic nerve shows that architecture alone can narrow energetic margin without any active sacrifice of function.[29,31,64,74] The framework therefore predicts stressor-dependent changes in order.
Buffering determines how component-level deficit becomes a system-level phenotype. Antioxidant defence, substrate switching, parallel pathways, cell number, network degeneracy, and regenerative capacity are distinct processes and do not naturally collapse into one ratio quantity.[20,105,111-112] Research on neural design and sensory-system evolution also shows that energetic efficiency depends on circuit architecture and channel biophysics and cannot be inferred directly from evolutionary age.[113-115] R should therefore be measured by domain in future studies; the single value in Table 1 is demonstrative, and its uncertainty must enter sensitivity analysis.
Repair explains why restoration of supply need not restore function. Protein damage, mitochondrial quality-control responses, demyelination, and loss of precise connectivity may continue to create reconstruction demand after the initiating deficit has resolved. Myocardial stunning separates energetic from mechanical recovery, while immune repopulation and alveolar regeneration show that reconstruction has multiple mechanisms with different rate-limiting steps.[21-23,86,100] The energy–function lag should therefore be modelled independently rather than inferred from the order of failure.
Resource allocation also requires regulated redistribution to be distinguished from passive constraint. Sympathetic redistribution of blood flow, endocrine suppression of reproductive axes, and coordinated stress-response programmes are regulated allocation; low renal-medullary oxygen tension and pericentral toxic exposure are passive constraints. Both can produce selective loss or preservation in retrospective observations. Prospective studies must measure supply, demand, and function concurrently so that allocation terminology is reserved for regulated reprioritisation.
Clinical Significance: A Research Agenda, Not Clinical Guidance
Clinical translation comprises three independent tasks: detect early reversible functional change, describe longitudinal trajectories of energy, function, and structure, and test whether mechanism-matched interventions improve patient-important outcomes. Biological plausibility cannot substitute for any of these validations. Candidate measures must first demonstrate reliability and within-person lead time, then incremental prediction; interventions require staged evidence of target engagement, safety, and clinical utility.
Hierarchical biomarkers: from early signal to clinical utility
A hierarchical biomarker is a reproducible measure of a prespecified function that changes before a clinically important endpoint during a defined stress. Validation requires analytical validity, within-person temporal precedence, incremental value beyond existing models, and decision utility. An early change that is irreproducible or merely reflects nonspecific injury is not a functional hierarchical biomarker; even a marker with lead time should not guide care until intervention on that information improves outcomes.
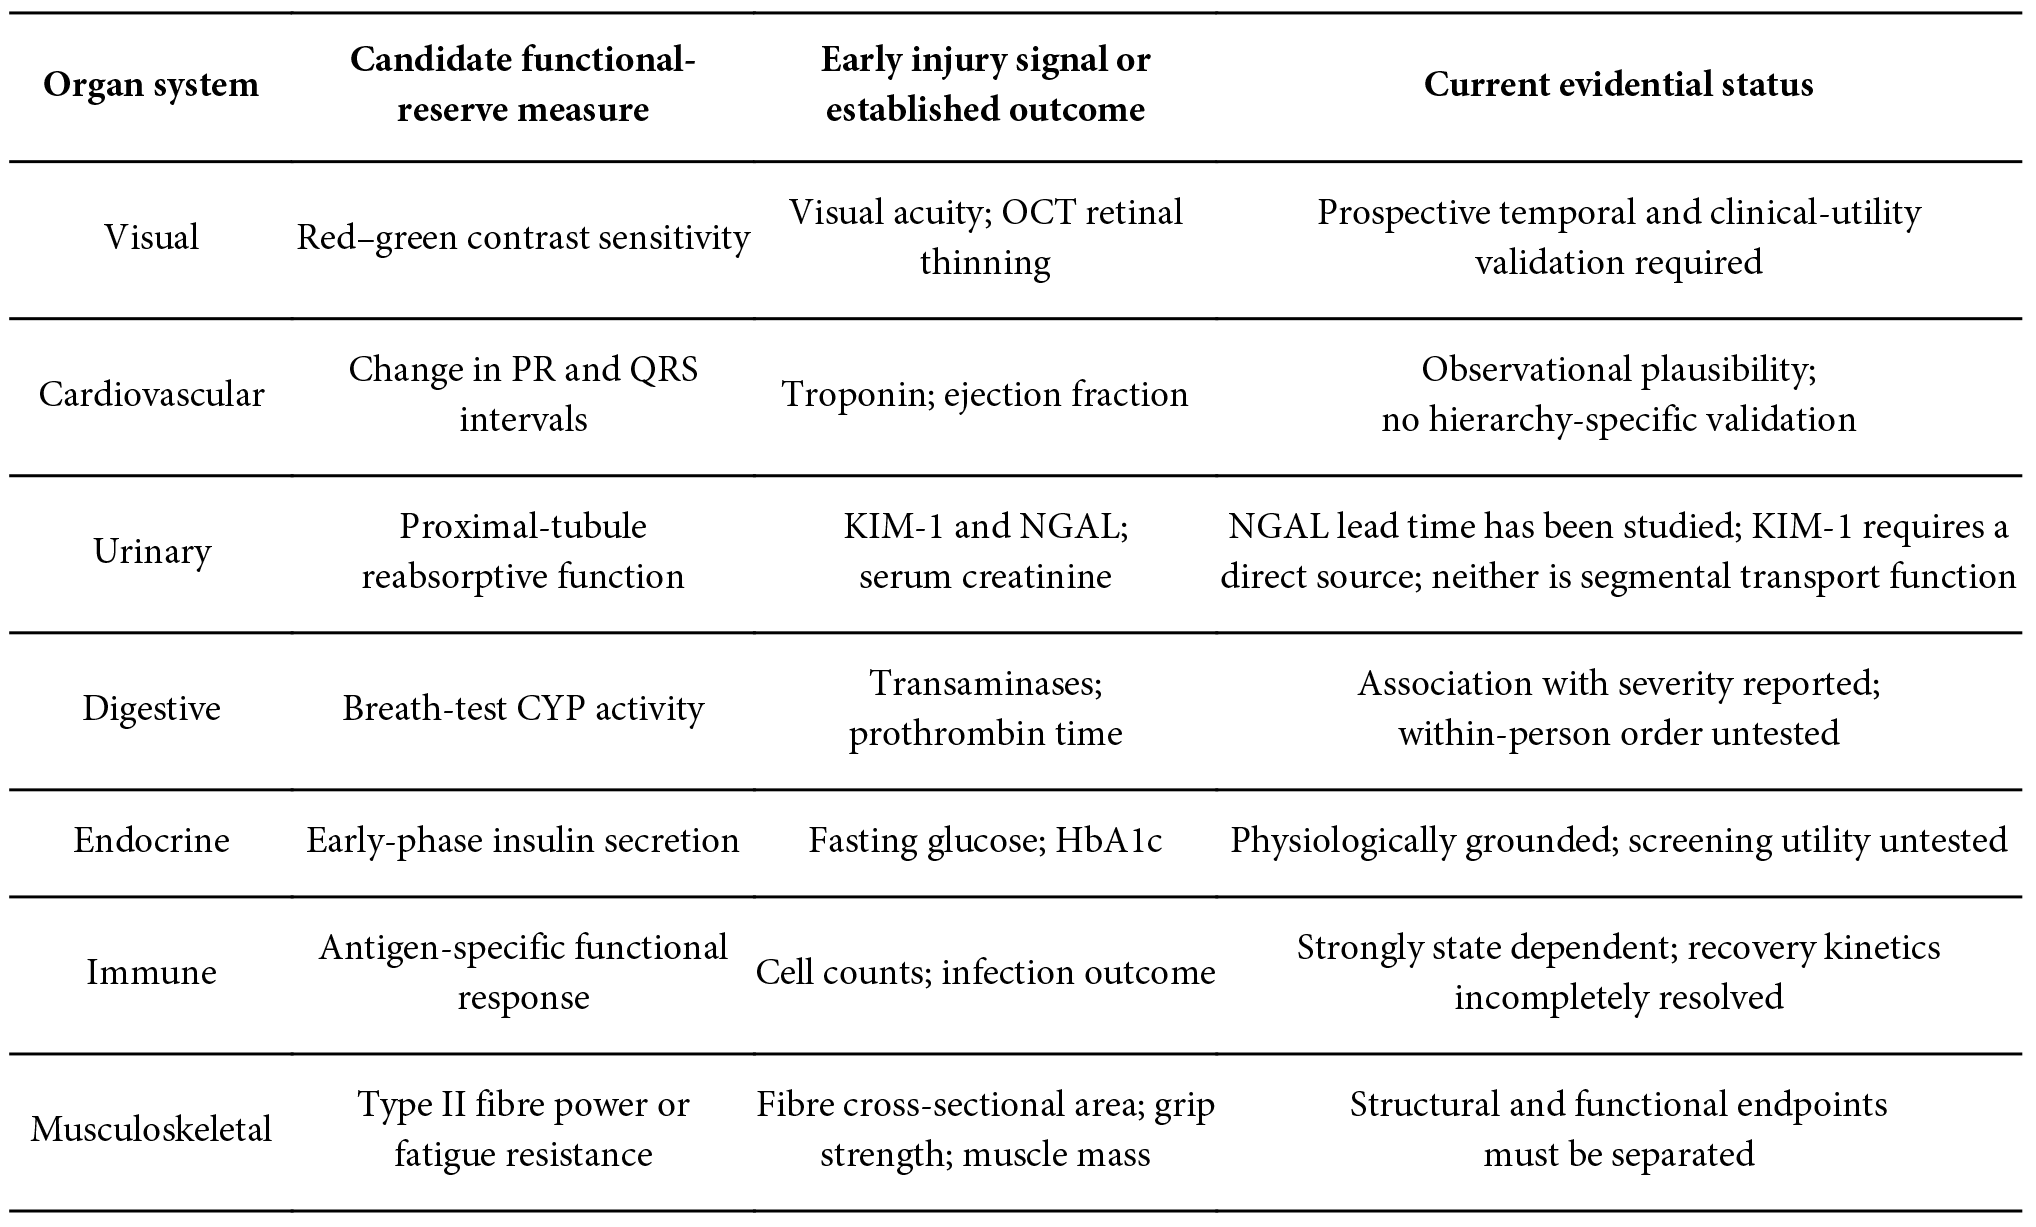
Candidates occupy different positions along this pathway (Figure 6c). Urinary NGAL and kidney injury molecule-1 (KIM-1) are early tubular-injury signals that may precede creatinine-based diagnosis. They report injury rather than a reversible higher-rank function; they may therefore show that tubular injury precedes creatinine change but cannot alone prove that a candidate higher-order function decompensates first.[66] Functional candidates include labelled-substrate CYP clearance, early-phase insulin secretion, cardiac conduction intervals, and red–green contrast sensitivity.[52,73,116-117] Their within-person temporal relationships and incremental value remain unestablished. Longitudinal change within an individual should take precedence over cross-sectional cut-offs because the framework predicts a trajectory rather than a universal threshold.
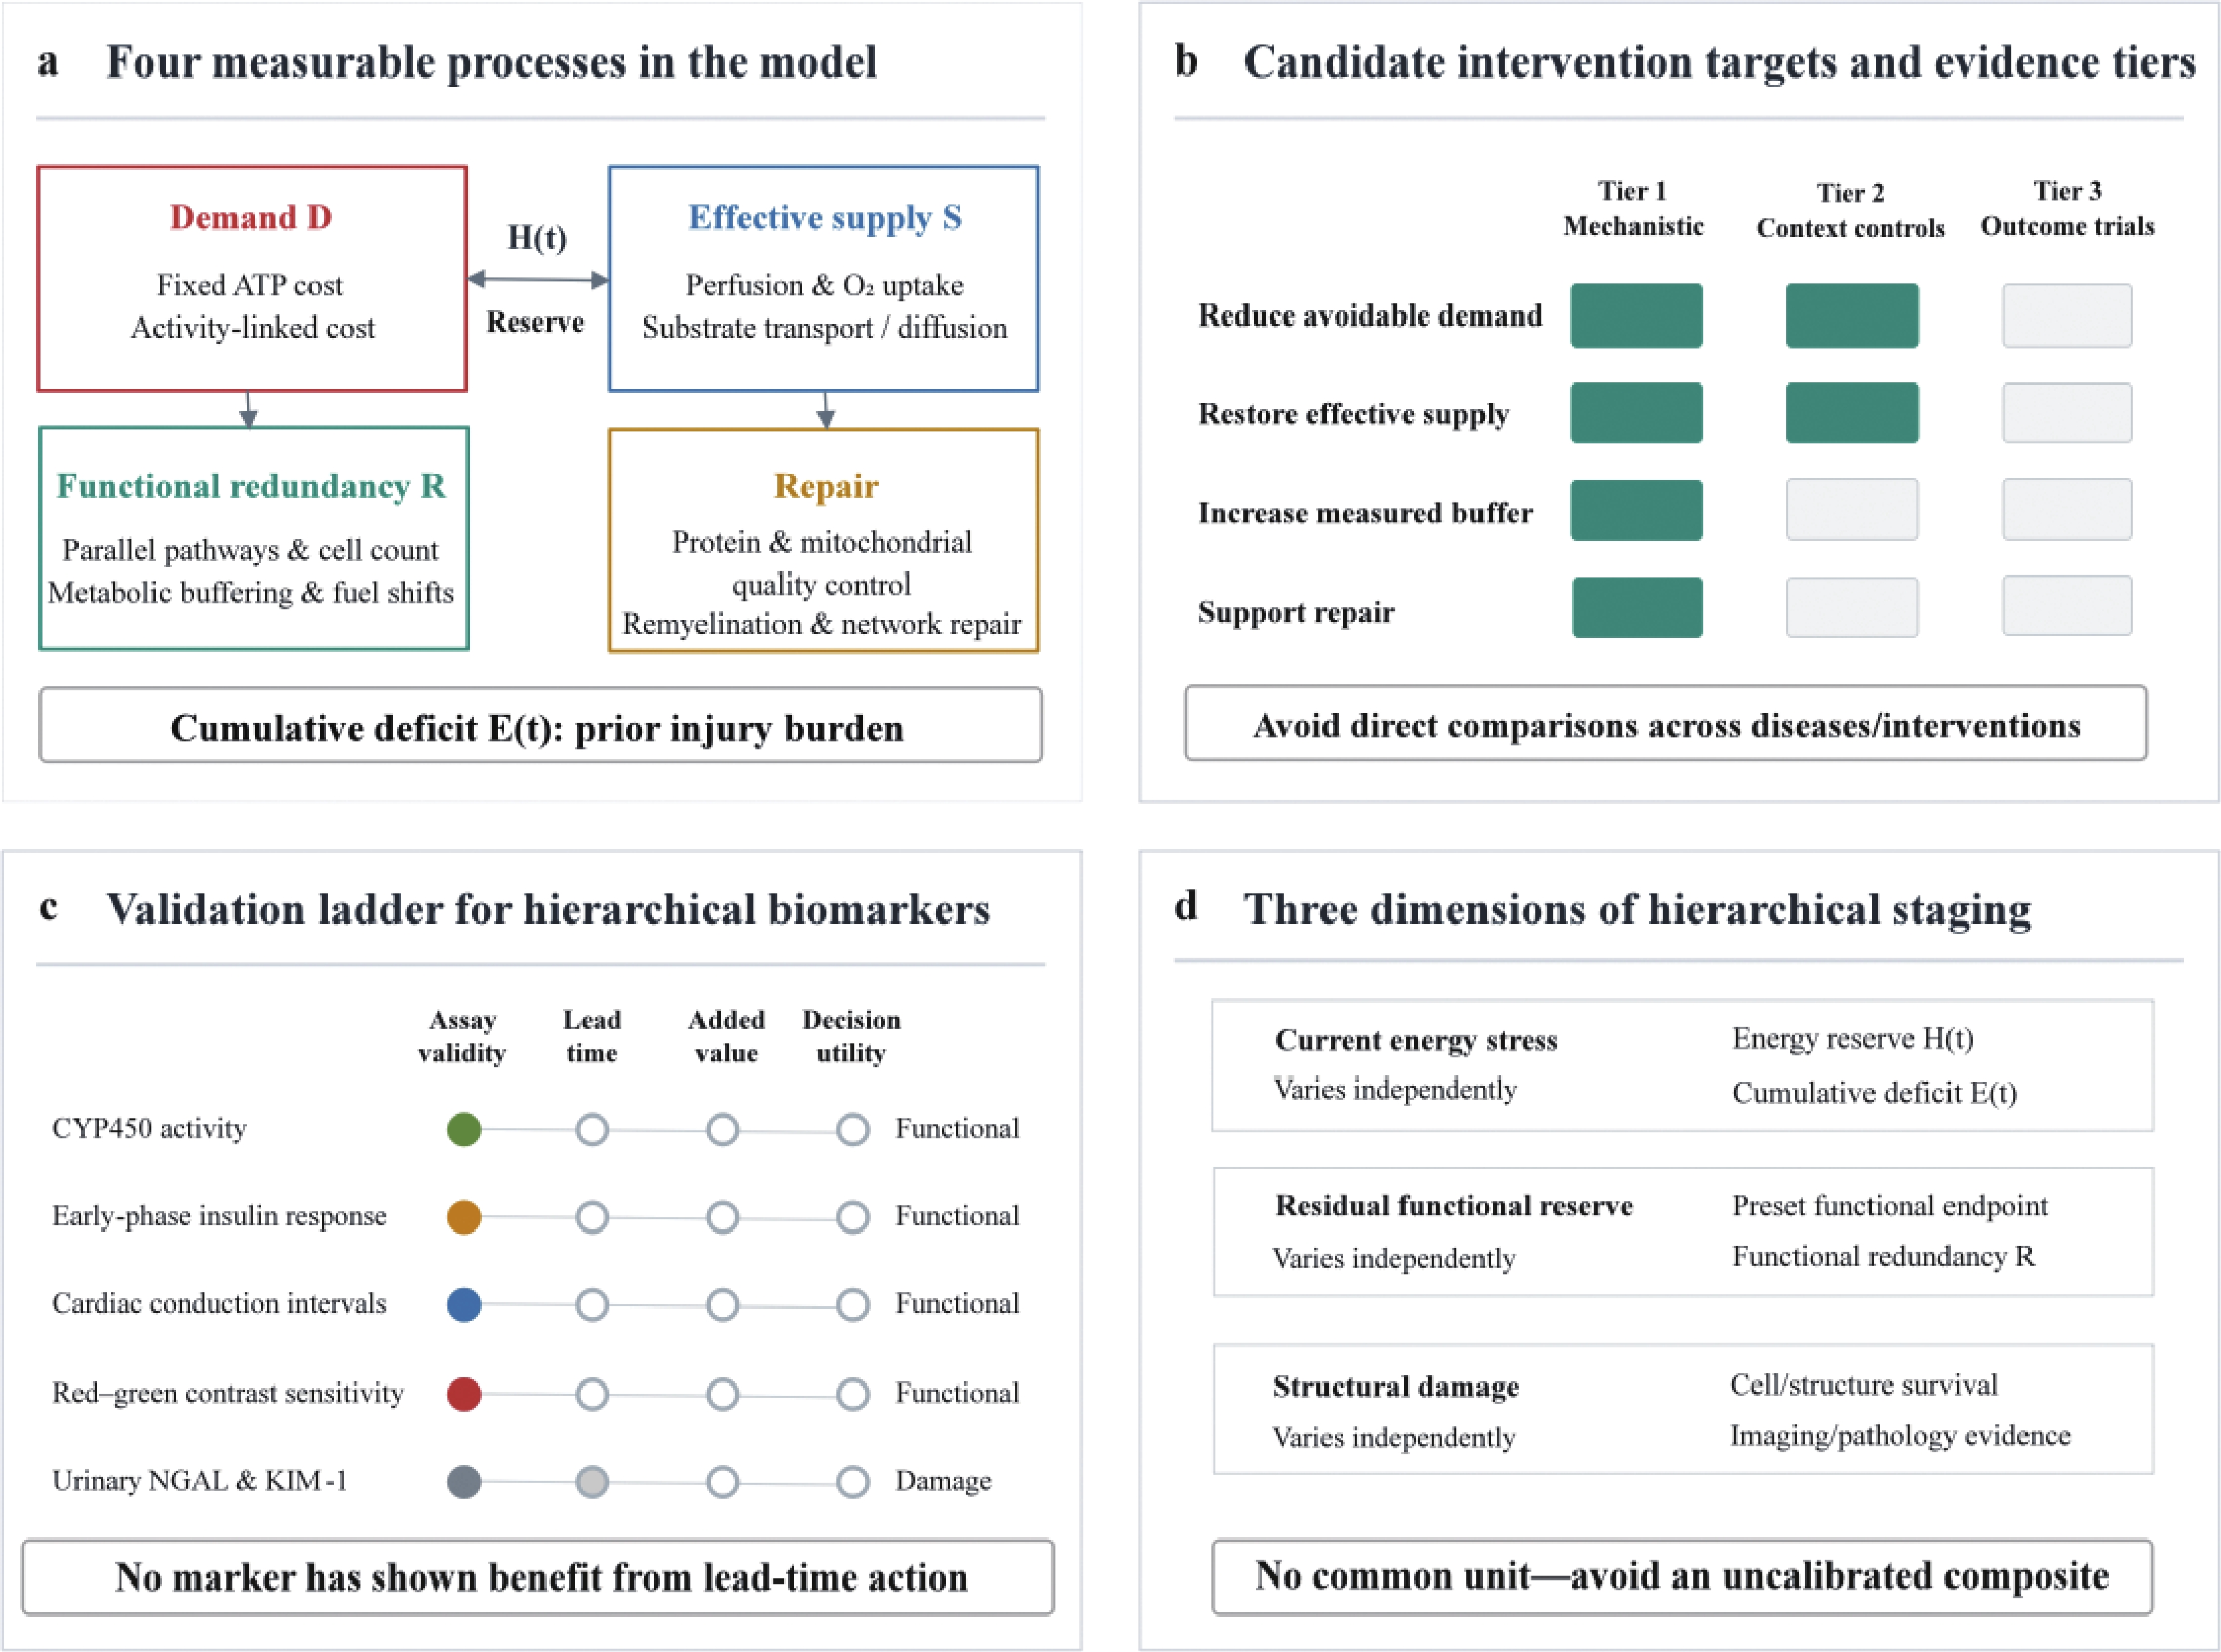
a, Positions of demand D, effective supply S, energetic margin H, functional redundancy R, repair, and cumulative deficit E; N is a testable historical prior rather than an energetic mechanism. b, Three evidence levels for candidate intervention targets: mechanistic rationale, context-specific controlled study, and randomised outcome evidence. Levels are not a treatment order. Findings from different diseases and interventions cannot be compared directly, and no candidate intervention has yet reached the third tier. c, Functional candidates, early injury signals, and clinical outcomes require separate validation; no functional hierarchical biomarker has shown that acting on its lead time improves outcomes. d, Current energetic stress, remaining functional reserve, and established structural injury have no common unit and should not be compressed into an uncalibrated universal score.
Hierarchical Staging: trajectories rather than a score
Staging should describe mechanism and trajectory rather than compress the framework into an unvalidated universal score. A minimal scheme requires three observable dimensions: current energetic stress, remaining functional reserve, and established structural injury. These dimensions are conceptually distinct and may change in different directions, so scalar staging would discard key information (Figure 6d). Literature on multiple sclerosis and diabetic complications likewise shows that disease-specific neurological, cognitive, and vascular trajectories cannot be merged into a single energetic stage.[118-120] Thresholds must be externally calibrated within each disease before they can guide care.
Hierarchical Protective Therapeutics: four mechanistic targets and their evidence
Four candidate intervention targets are to reduce avoidable demand, restore effective supply, increase measured buffering capacity, and support repair. These are mechanistic variables for trial design, not a treatment order derived from hierarchical rank. Emergency stabilisation, reperfusion, oxygenation, and treatment of the initiating cause remain governed by existing indications. Because one component may support another's recovery, intervention endpoints should include function, structure, and safety.
General metabolic evidence must be separated from hierarchy-specific evidence. Demand reduction can extend ischaemic tolerance in selected settings, and controlled studies of nicotinamide and pyruvate in glaucoma show that retinal function can be modified metabolically.[121-123] Evidence for coenzyme Q10, NAD precursors, exercise, and ketone strategies varies by disease and endpoint.[124-128] None of these studies demonstrates preferential benefit to a preregistered apex function, validates the M–N–R model, or justifies cross-organ extrapolation without disease-specific trials.
From a hierarchical strategy to a clinical trial
A trial of hierarchy-specific effects must prespecify the compared components, functional thresholds, and observation window; identify whether the intervention targets demand, supply, buffering, or repair; and report energetic variables, functional endpoints, safety, and patient-important outcomes together. Early mechanistic trials may test target engagement and change in energetic margin; later studies must establish clinical validity and utility. Existing optic-neuritis studies show the value of prespecified visual endpoints but do not validate a hierarchy-based treatment strategy.[3]
Experimental Predictions: Four Prediction Families
A framework spanning several systems must be tested by predictions that distinguish competing explanations. The 12 specific predictions below are grouped into four pathways: cross-species comparison, metabolic intervention, recovery kinetics, and cross-system association. For each, the study unit, comparison endpoint, and failure condition are specified. The predictions test different levels of the framework: some address individual terms such as N, M, or R, whereas others address dynamic margin or incremental clinical value. Failure of one component need not invalidate every other component, but it must trigger a prespecified deletion or restriction.
Family 1: cross-species comparisons
Prediction 1. Trait-dependent vulnerability. Under matched optic-nerve energetic stress, species with conventional trichromatic vision should develop a selective, persistent red–green deficit, whereas species lacking the corresponding channel should not. Once measurement validity is established, an equivalent selective deficit in dichromatic species would refute the prediction.
Prediction 2. Incremental value of evolutionary novelty. Among homologous components, after demand, supply, and redundancy have been measured, N should improve out-of-sample prediction of failure order. No incremental value, or a stable effect in the opposite direction, would refute this prediction and require removal of N from the index while leaving the allocation model open to further testing.
Prediction 3. Independent origins. High-resolution or chromatic channels that evolved independently should show vulnerability that varies with measured demand and substitutability rather than taxonomic identity. A lineage effect unrelated to these energetic properties would refute the prediction.
Family 2: metabolic intervention predictions
Prediction 4. Fixed cost versus mitochondrial density. Under graded substrate restriction, the fraction of ATP consumption attributable to fixed costs should predict failure order better than mitochondrial density. Consistent superiority of mitochondrial density would refute the prediction; cardiac conduction and skeletal muscle are the two most informative test settings.
Prediction 5. Separability of demand and substitutability. Reducing demand should delay energetic threshold crossing, whereas increasing functional redundancy should delay system-level functional loss with less effect on component-level energetic recovery. Indistinguishable effects of the two manipulations would refute the prediction and require M and R to be merged.
Prediction 6. Targeted energetic rescue. Restoring effective supply or mitochondrial function should increase Hi(t) and preferentially preserve the preregistered higher-rank function under matched stress. Uniform benefit would reject only the hierarchy-specific effect; preferential protection of the comparator, or functional benefit without any measured improvement in energetic margin, would refute the prediction.
Family 3: recovery kinetics predictions
Prediction 7. Conditional reversal. After reversible, uniform stress, recovery order within the same system and repair mode should reverse the order of functional decompensation. Reproducible recovery of the first-lost function before its comparator would refute the prediction.
Prediction 8. Energy–function lag. Effective supply and high-energy metabolites should recover before specialised function, and the lag should vary with cumulative supply–demand deficit rather than nadir depth. Synchronous energetic and functional recovery, or no association between lag and integrated deficit, would refute the prediction.
Prediction 9. Age and rescue timing. Age and rescue delay do not enter V directly. This extension is retained only if their pathways are prespecified—for example, altered recovery of S, repair capacity, or increased D during recovery, thereby changing cumulative deficit. If these pathways do not explain recovery time after injury depth is matched, or if all prespecified components are affected equally, the extension fails.
Family 4: cross-system association predictions
Prediction 10. Within-person covariance. Repeated measures of higher-rank functional reserve should covary across systems beyond what common risk factors and measurement error can explain. Disappearance of the association after reliability correction and appropriate adjustment would refute the prediction.
Prediction 11. Cascade under common stress. During standardised systemic stress, prespecified component-level energetic-margin thresholds should be crossed in a reproducible sequence. If exposure and perfusion fully explain the sequence, the prediction is refuted and the Hierarchical Principle should be restricted to local physiology.
Prediction 12. Added clinical value. An independently validated candidate biomarker or panel should outperform conventional measures in within-person lead time, calibration, and decision utility. If it provides no clinically meaningful incremental value, the biomarker or panel should be abandoned; this rejects its translational use, not every bioenergetic mechanism.
Relationship to Existing Theories
Selective vulnerability, energetic constraint, and evolutionary history already have mature literatures. The incremental claims of the Hierarchical Principle are narrower: within a prespecified system, stressor, and functional endpoint, do measured maintenance demand, effective supply, and redundancy improve prediction of decompensation and recovery times, and does evolutionary novelty add out-of-sample information beyond them? If demand or local supply alone predicts equally well, the more complex model is not justified.
Neural energy-budget studies established the costs of signalling and cellular maintenance and showed why sustained ion flux accounts for a large share of neural energy use.[11-13,15-16] The present framework adds no new budget measurement. It proposes that directly measured energetic quantities be evaluated as predictors of temporal order alongside axon geometry, network topology and disease-specific exposure, using the same preparation and prespecified endpoints.
Allometric and life-history theories describe constraints on energy use across organisms and scales.[45-47,129-132] Their exponents do not establish component order within an organ and should not be transferred to variables measured on different scales. The Hierarchical Principle instead addresses the response of predefined components when available energetic margin becomes insufficient, making it a proposed complement to metabolic scaling rather than an alternative account of scaling itself.
Disease-specific accounts of selective vulnerability remain indispensable and are often better supported than the present framework. Pacemaker activity and axonal arbour size contribute to nigral vulnerability, network topology shapes neurodegenerative spread, and complex I deficiency selectively affects retinal ganglion cells in mitochondrial optic neuropathy.[6,40-44,112-115,133] A general model is useful only if it predicts temporal order beyond these local mechanisms, the distribution of the initiating insult and measurement sensitivity. That incremental comparison has not yet been completed.
Evolutionary medicine explains how mismatch, trade-offs, and historical constraints shape disease risk.[134-136] N carries this historical concern into the present framework, but faces a stronger empirical requirement: evolutionary age must add prediction beyond demand, supply, and redundancy. If it does not, N should be removed even if the remaining allocation framework proves useful; that outcome is a successful test, not an interpretive failure.
The potential contribution is to place a candidate static rank, measurable dynamic margin, functional thresholds, and structural survival in one test design. The framework should be compared with parsimonious models based on demand alone, supply alone, structural exposure, disease-specific mechanism, general organ reserve, and network resilience. More complex terms such as N or R are justified only if they improve preregistered out-of-sample prediction.
Limitations and Caveats
Current evidence is sufficient to formulate a testable law-like hypothesis but not to treat it as an established law. Six limitations define the present scope.
First, the constructs are incompletely operationalised. M mixes tissue metabolism, activity-dependent cost, and mechanistic estimates; N depends on the dating target and transformation; and R combines pathway degeneracy, numerical reserve, metabolic buffering, and repair capacity. M is not a unified dimensionless scale, and R is not a validated ratio quantity. Therefore, V values and ratios cannot be interpreted as effect sizes.
Second, the multiplicative form of Equation 1, the linear mapping of N, and the placement of R in the denominator lack derivation and external calibration. No validated mathematical mapping connects V to H, a functional threshold, or repair. The score can only preregister an order within one system and scale; shared display in Table 1 and Figure 1 does not create a cross-organ ranking.
Third, this is not a systematic review. Cases and literature were assembled retrospectively after the proposed pattern was recognised, creating risks of selective example choice and circular interpretation. Some parameter assignments partly reflect known vulnerability, so predictors and outcomes are not yet independent. Diseases, stressors, species, timescales, and endpoints differ across the nine systems. Preregistration, independent parameter measurement, negative controls, and out-of-sample prediction are essential.
Fourth, causal ambiguity remains substantial. High fixed cost often coexists with marginal delivery, specialised exposure, limited antioxidant defence, network centrality, and low repair capacity. Measuring Hi(t) can make competing demand and supply explanations explicit, but the dynamic extension itself has not yet received prospective validation.
Fifth, recovery mechanisms are heterogeneous. Metabolic normalisation, remyelination, protein turnover, network reconfiguration, regeneration, and cell replacement are not one process. E accumulates supply–demand burden during injury and cannot by itself represent the cost of each repair pathway. Reverse recovery order can be tested only when comparison units, reversibility, and repair modes are comparable.
Sixth, clinical translation is unvalidated. No candidate hierarchical biomarker has simultaneously established hierarchy specificity, prospective lead time, and outcome benefit from acting on that lead time; trajectory-based staging lacks disease-specific calibration; and Hierarchical Protective Therapeutics has not been tested as a treatment-selection strategy. The framework cannot replace current guidelines, causal treatment, or life support.
The discriminating next step is a prospective, preregistered within-system comparison. Before outcomes are examined, investigators must fix the components, common stressor, functional thresholds, parameter measurement methods, and competing models. Demand, effective supply, structural exposure, and recovery time should then be measured concurrently. If V adds no out-of-sample prediction beyond measured H and simpler models, the static score should be revised or removed; repeated high-quality falsification of the prespecified order would reject the corresponding law-like claim.
Conclusion
The Hierarchical Principle converts a familiar clinical observation—asynchronous functional recovery—into a measurable question of within-system temporal order. Optic neuritis shows that colour vision and high-contrast acuity can recover asynchronously after injury to the same optic nerve, but does not prove a fixed retinal-pathway order.[1-2] The framework distinguishes two levels: the pre-stress candidate rank is jointly influenced by M, N, and R, whereas actual decompensation and recovery times also depend on effective supply, functional thresholds, and repair burden. Structural geometry and disease-specific mechanisms remain mandatory comparators.
Three distinct quantities organise the argument and reduce ambiguity by separating static rank, dynamic state, and cumulative supply–demand deficit. The static score V = M × N / R states a candidate within-system order that can be specified before injury; its illustrative parameterisation exposes uncertainty rather than calibrating risk. The dynamic margin Hi(t) states when a component approaches energetic deficit, and cumulative deficit E is a candidate explanation for recovery lag. Intrinsic vulnerability has no consequence without stress, and restoration of supply does not guarantee restoration of function.
The most informative observations across nine systems are those that constrain the model. Cardiac conduction separates functional sensitivity from structural survival; the loop of Henle shows that evolutionary novelty may predict the wrong order; skeletal muscle shows that mitochondrial density cannot substitute for fixed cost; and alveolar repair demonstrates network dependence among components. These cases do not prove Equation 1, but they specify the comparison units, endpoints, and competing models required for valid tests.
Clinical implications remain conditional. Functional candidates may change before structural damage, longitudinal trajectories may complement existing staging, and mechanism-matched interventions may protect prespecified functions. These uses separately require analytical validity, clinical validity, and clinical utility; none currently justifies changing individual care.
The framework will stand or fall through prospective discrimination rather than the number of examples. It is supported only if measured energetic margin and preregistered component rank improve prediction beyond axonal geometry, mitochondrial density, local exposure, and general reserve. If M, R, or N provides no independent information, that term should be removed or redefined. If prespecified orders are repeatedly falsified under rigorous conditions, the corresponding law-like claim should be abandoned.
Correction notice
None
Acknowledgements
The authors thank colleagues at the Zhongshan Ophthalmic Center for discussion of the clinical observations that prompted this work.
Author contributions
(I) Conception and design: Haotian Lin
(II) Administrative support: Haotian Lin
(III) Provision of study materials or patients: Haotian Lin
(IV) Collection and assembly of data: Wei Wang
(V) Data analysis and interpretation: Wei Wang, Haotian Lin
(VI) Manuscript writing: Haotian Lin
(VII) Final approval of manuscript: Wei Wang, Haotian Lin
Conflict of Interests
None of the authors has any conflicts of interest to disclose. All authors have completed the ICMJE uniform disclosure form.
Patient consent for publication
None
Ethics approval and consent to participate
None
Data availability statement
Table 1, Supplementary Tables 2 and 3, and the accompanying figure inputs report the working values, ranges, evidence classes, transformations, and conditional perturbation results used in the illustrative parameterisation. Every V value is recalculated from the M, N, and R values in its row. The analysis tables, code, random seed, and version information will be deposited in a persistent public repository at submission; before public release, they are available from the corresponding author on reasonable request.
Open access
This is an Open Access article distributed in accordance with the Creative Commons Attribution Non Commercial-No Derivs 4.0 International License(CC BY-NC-ND 4.0), which permits the non-commercial replication and distribution of the article with the strict proviso that no changes or edits are made and the original work is properly cited(including links to both the formal publication through the relevant DOI and the license).
Declaration of generative AI use
In the preparation of this manuscript, the authors used ChatGPT for language polishing. After using this tool, the authors reviewed and edited the content as necessary and take full responsibility for the content of this publication.
BOXES
Box 1. The Hierarchical Principle: formal statement and scope
Statement. Under a prespecified common energetic stress, functionally defined components within the same biological system and at the same scale may cross decompensation and sustained-recovery thresholds at different times. A candidate pre-stress order is constructed from basal metabolic rate M, evolutionary-novelty prior N, and functional-redundancy proxy R. Actual timing also depends on effective supply, exposure, functional thresholds, and repair mode, described separately by H and E.
Static rank. Vi=(Mi×Ni)/Ri is a within-system ordinal hypothesis. Its multiplicative form is assumed, inputs must be defined at the same biological scale, and magnitudes are not calibrated across organs. The illustrative parameterisation is shown in Table 1.
Dynamic state. Hi(t)=(Si(t)−Di(t))/(Di(t)) is a proposed dynamic measure of instantaneous energetic margin using commensurate effective-supply and total functional-demand fluxes. M represents the baseline or lower-bound component of D rather than an interchangeable measure. H contains neither N nor R because neither produces energy.
Cumulative deficit. Ei(t) is the time integral of the positive difference Di(t)−Si(t). It is a candidate explanation for recovery lag and measures accumulated burden during injury, not an unpaid repair debt.
Endpoints. Time to functional failure, depth of functional loss, structural survival, and time to functional recovery are distinct endpoints with different thresholds. Reverse recovery order is predicted only after comparable reversible injury under the same repair mode.
Falsification. If preregistered component rank and measured energetic margin do not improve prediction beyond structural exposure, local delivery, mitochondrial density, and general reserve—or if N adds no out-of-sample information after measurable variables are included—the framework must be restricted, simplified, or rejected.
Box 2. Twelve falsifiable predictions across four validation pathways
Cross-species comparison. Trait-dependent vulnerability; incremental predictive value of evolutionary novelty; convergence among independent evolutionary origins.
Metabolic intervention. Fixed cost versus mitochondrial density; separability of demand and redundancy; association between targeted rescue and measured improvement in energetic margin.
Recovery kinetics. Conditional reversal; energy–function lag in relation to cumulative deficit; modifying effects of age and rescue timing through prespecified pathways.
Cross-system association. Within-person covariance of reserve; sequence of threshold crossing under common stress; added clinical value of a validated biomarker or panel.
The population or model, comparator, endpoint, and falsifying result for each prediction are specified in the Experimental Predictions section.
Box 3. Candidate measures for testing hierarchical biomarkers
This matrix separates candidate measures of functional reserve from early injury signals and established organ outcomes. Classification alone establishes neither lead time, reversibility, nor clinical utility. Before any candidate can guide care, it requires a prespecified within-person temporal study, comparison with current standards, and an intervention study.
SUPPLEMENTARY INFORMATION
Supplementary Table 1 reports the enzyme-activity ratios used in Figure 4a. Supplementary Table 2 identifies, row by row, the input type, working range, dating target, redundancy basis, and principal uncertainty for Table 1. Supplementary Table 3 reports conditional order retention under the limited perturbation scheme and explicitly excludes uncertainty in R, the form of N, substitute-tissue selection, and correlations among inputs.