





HIGHTLIGHTS
1.Critical Discoveries and Outcomes
Our analysis of over 110,000 cataract surgery patients over a ten-year period shows a steady decline in the median age at surgery of around three years between 2014 and 2023. During this time, however, patients' metabolic health deteriorated, with the proportion exhibiting abnormal preoperative blood glucose levels rising from 19.6% to 39.3%, and those with abnormal cholesterol levels increasing from 31.6% to 47.3%. Additionally, liver, kidney, and electrolyte abnormalities became more prevalent. Therefore, although patients now undergo surgery at an earlier age, they are burdened with an increasing number of chronic conditions, such as diabetes and dyslipidemia.
2.Methodological Innovations
Unlike tightly controlled clinical trials, real-world research captures patients as they present in routine care. Based on ten years of routine medical records from over 110,000 cataract surgery patients, this study provides a substantial and highly representative sample. The findings are derived directly from clinical practice, offering practical reference value for preoperative assessment and chronic disease management across healthcare institutions. To address changes in laboratory analyzers and reference ranges over the decade, we standardised all results onto a common scale and applied statistical models adjusted for age, sex and annual sample size. This ensured the reliability of the long-term trend analysis.
3. Prospective Applications and Future Directions
Our results suggest two practical opportunities. For clinicians, they offer up-to-date benchmarks that help identify high-risk patients before surgery and guide better preparation, such as controlling blood sugar and lipids in advance. For public health, the millions of people who routinely receive blood tests before cataract surgery could serve as an early-warning "sentinel" group for tracking chronic diseases in the aging population. Future studies across multiple hospitals, linking these preoperative data to long-term health outcomes and lifestyle factors, are needed to confirm this potential and explain what is driving these trends.
Introduction
Cataract remains the leading cause of global blindness, accounting for half of all blindness cases in low- and middle-income countries.[1-2] Age-related cataract (ARC), the most prevalent subtype, typically affects individuals over 50 years of age, with its prevalence increasing markedly with age.[3-4] By 2050, the ARC population in China is projected to more than double,[5] thereby placing increasing demands on healthcare resources and exacerbating the societal burden. Cataract surgery, with over 20 million procedures performed annually worldwide, is now the most frequently performed ophthalmic surgery.[6] Its evolution from simple lens extraction to a refractive procedure aimed at optimizing visual outcomes reflects, and is partly driven by, a growing public emphasis on visual health and quality of life. This trend is further accelerated by improving socioeconomic conditions and health awareness in developing nations.[7-9]
Preoperative evaluations for ARC patients typically include blood biochemistry, coagulation profiles, complete blood counts, and infectious disease screenings to assess surgical risks, identify high-risk patients, and mitigate complications. 10-11] However, the necessity of routine preoperative testing remains debated, with some countries recommending self-administered health questionnaires as an alternative to certain tests, such as blood work.[12-13] In developing nations, this questionnaire-based risk assessment model faces significant limitations due to low healthcare utilization rates and the underdiagnosis of chronic diseases, which hinders comprehensive medical history collection.[11, 14] This constraint is particularly acute in ARC populations, which are characterized by complex metabolic profiles, a high prevalence of multiple medical comorbidities, and a notable frequency of critical laboratory values.[11, 15] Consequently, preoperative biochemical testing remains critical in developing countries for informing clinical decisions and surgical planning.
Accelerated global population aging and the rising prevalence of metabolic disorders, such as diabetes and dyslipidemia, have heightened the burden of chronic diseases.[16-17] Among ARC surgical patients, age-related systemic and biochemical abnormalities have become increasingly prevalent.[11] These metabolic abnormalities not only exacerbate cataract pathogenesis but also increase the risk of perioperative complications, including postoperative macular edema, exacerbation of retinopathy, and impaired wound healing.[17-20] Furthermore, liver dysfunction, reflected by elevated aspartate aminotransferase (AST) and alanine aminotransferase (ALT) levels, is a recognized risk factor for cataract formation.[21] Moreover, HBV infection has been hypothesized to accelerate cataract progression through mechanisms involving transaminase (AST and ALT) pathways.[22] Additionally, studies have shown that chronic kidney disease (CKD) is closely associated with an increased risk of cataract, with the risk escalating as kidney function deteriorates.[23-24] The prevalence of cataract is higher in patients with end-stage renal disease, who are also more likely to undergo surgery at a younger age.[25] Consequently, perioperative biochemical profiling in ARC patients not only enhances surgical safety but also serves as a valuable window for early detection of chronic diseases, enabling targeted interventions and integrated healthcare strategies.
Despite these recognized associations, large‑scale, long‑term, real‑world evidence regarding the evolving demographic and preoperative biochemical profiles of ARC patients remains scarce, particularly given China's rapidly changing socioeconomic and epidemiological landscape. Therefore, this serial cross-sectional study was conducted to elucidate temporal trends in demographic characteristics and biochemical markers, drawing on a decade of data from patients undergoing ARC surgery. By evaluating age- and sex- adjusted temporal changes in standardized means and prevalence of abnormal values for these markers, we aimed to: (1) provide updated real-world benchmarks for preoperative risk stratification in ARC surgery; (2) identify shifting patterns in metabolic and systemic health that may inform perioperative management; and (3) explore the potential utility of routine preoperative biochemical data as a means of monitoring chronic disease burden in the aging population, thereby facilitating the integration of ophthalmic and systemic healthcare.
METHODS
Study design and setting
This was a retrospective cross-sectional, real-world study using routinely collected data from the electronic medical record (EMR) system of Zhongshan Ophthalmic Center, Sun Yat-sen University, a tertiary referral eye hospital in Guangzhou, Southern China. All data were derived from routine clinical practice without any protocol-driven interventions. The study was conducted in accordance with the Declaration of Helsinki. Ethics approval was obtained from the Institutional Ethics Committee of Zhongshan Ophthalmic Center (2018KYPJ140-4). The requirement for informed consent was waived due to the retrospective nature of the study and the use of anonymized data.
Participants
The study enrolled patients diagnosed with ARC who underwent cataract surgery and preoperative blood testing at the study hospital from January 1, 2014 to December 31, 2023. The inclusion criteria were: (1) a confirmed diagnosis of ARC by ophthalmologists based on standard clinical criteria; (2) completion of cataract surgery at the study hospital; (3) availability of preoperative biochemical test results from the same institution. The exclusion criteria were: (1) cataracts of non-age-related etiologies (e.g., secondary, traumatic, drug-induced, or congenital); (2) incomplete or missing biochemical data. For patients who underwent bilateral cataract surgery during the study period, each eye was treated as a separate case, and the preoperative biochemical data from the first surgery were used for analysis. For patients who underwent repeated preoperative testing within 3 months due to initial abnormal results, only the initial test result was included.
Data sources
Baseline data extracted from the hospital’s electronic medical record (EMR) system included age, sex, biochemical analyzer models, and preoperative blood biochemical parameters. The biochemical panel comprised 13 parameters: total cholesterol (TC), triglycerides (TG), glucose (GLU), alanine aminotransferase, aspartate aminotransferase, total protein (TP), albumin (ALB), urea, creatinine (Cr), potassium (K⁺), sodium (Na⁺), chloride (Cl⁻), and calcium (Ca²⁺). Biochemical analyses were performed using four automated platforms: Siemens Dimension RLX-1/2 (Germany), Ortho Clinical Diagnostics VITROS350 (USA), Ortho Clinical Diagnostics VITROS4600 (USA), and Roche COBAS8000 C702 (Switzerland).
Data categorization and standardization
Patients were stratified into six age groups at 10-year intervals (40-49, 50-59, 60-69, 70-79, 80-89, and ≥ 90 years). All biochemical results and metadata were retrieved from the laboratory information system. For analysis, biochemical markers were categorized into four classes: (1) metabolic markers (TC, TG, GLU); (2) liver function (ALT, AST, TP, ALB); (3) renal function (urea, Cr); and (4) electrolyte balance (K⁺, Na⁺, Cl⁻, Ca²⁺). Each parameter was classified as normal or abnormal based on standardized reference ranges. Given that different biochemical analyzers with distinct reference intervals were used over the 10‑year study period, raw test values were standardized to enable valid temporal comparisons using the following formula: Standardized Value = (Actual Value - Reference Lower Limit) / (Reference Upper Limit - Reference Lower Limit). Values between 0 and 1 were considered within the normal range, while corresponding values < 0 (reduced) or > 1 (increased) indicated abnormalities. To minimize annual fluctuation, standardized means and the prevalence of abnormal values were aggregated biennially into five periods (2014-2015, 2016-2017, 2018-2019, 2020-2021, 2022-2023).
Patient and public involvement
No patients were involved in the design, conduct, or reporting of this study. The research question and outcome measures were developed based on clinical and epidemiological considerations rather than patient priorities. Results will be disseminated through peer-reviewed publication.
Statistical Analysis
Demographic characteristics were analyzed descriptively. Categorical variables were expressed as frequencies (%) and continuous variables as medians with interquartile ranges (IQR). Gender differences were assessed using binomial tests. Weighted linear regression models, weighted by annual sample size, were employed to analyze trends in median age, with the median age as the dependent variable and the year of surgery as the independent variable. For biochemical markers, generalized linear models (GLMs) were constructed to evaluate temporal trends. The dependent variable was either the standardized mean value or the prevalence of abnormal values for each marker, the independent variable was the year of surgery. Model goodness-of-fit was assessed using the adjusted R², and statistical significance was determined via t-tests (P-values). Biochemical abnormalities were reported as counts (n) and proportions (%) with 95% CIs calculated using the Clopper-Pearson method, while standardized means were presented with 95% CIs via normal approximation. Temporal trends in the prevalence of abnormal values were analyzed using GLM with a Gamma distribution (zero-inflated data were replaced by 0.0001), and biennial percentage changes were derived from the exponentiated regression coefficients. Standardized means were assessed via GLM with a normal distribution. All GLMs included gender and age group as covariates to adjust for potential confounding. All analyses were performed using SPSS 26.0 (IBM Corp., Armonk, NY, USA). Statistical significance was defined as a two-sided P < 0.05.
Results
Participants and demographic characteristics
A total of 116,103 patients who underwent cataract surgery for age-related cataracts between 2014 and 2023 were included in this study (Table 1). The annual sample size ranged from 9,281 to 15,573 patients. Female patients consistently outnumbered male patients each year, comprising 58.52% of the cohort compared to 41.48% for males. This gender difference was statistically significant throughout the study period (P < 0.001).
|
Year |
Patient number |
Sex* |
Age group /years (%) |
Median age /years (IQR) |
|||||||||
|
male (%) |
female (%) |
40-49 |
50-59 |
60-69 |
70-79 |
80-89 |
≥ 90 |
male |
female |
total |
|||
|
2014 |
11,540 |
41.48 |
58.52 |
1.41 |
10.26 |
29.25 |
40.35 |
17.78 |
0.94 |
72 (64, 78) |
72 (65, 78) |
72 (65, 78) |
|
|
2015 |
11,540 |
41.08 |
58.92 |
1.52 |
10.70 |
30.22 |
38.83 |
17.81 |
0.93 |
72 (64, 78) |
71 (65, 78) |
72 (64, 78) |
|
|
2016 |
12,242 |
41.41 |
58.59 |
0.10 |
11.63 |
30.40 |
36.79 |
19.93 |
1.14 |
72 (64, 79) |
72 (65, 78) |
72 (64, 79) |
|
|
2017 |
9,949 |
40.73 |
59.27 |
0.94 |
12.41 |
32.53 |
36.26 |
16.99 |
0.86 |
70 (63, 78) |
71 (64, 77) |
71 (64, 77) |
|
|
2018 |
11,328 |
40.77 |
59.23 |
0.69 |
9.50 |
35.07 |
35.96 |
17.70 |
1.08 |
71 (64, 78) |
71 (65, 77) |
71 (64, 78) |
|
|
2019 |
11,857 |
40.82 |
59.18 |
0.90 |
9.63 |
34.70 |
36.51 |
17.30 |
0.96 |
71 (64, 78) |
70 (65, 77) |
71 (65, 77) |
|
|
2020 |
9,281 |
42.31 |
57.69 |
0.84 |
12.77 |
35.45 |
34.71 |
15.31 |
0.93 |
70 (63, 77) |
70 (64, 76) |
70 (64, 76) |
|
|
2021 |
11,624 |
41.75 |
58.25 |
0.28 |
16.05 |
34.43 |
35.05 |
13.39 |
0.80 |
69 (62, 76) |
69 (64, 76) |
69 (63, 76) |
|
|
2022 |
11,169 |
43.43 |
56.57 |
5.42 |
16.61 |
32.65 |
32.32 |
12.19 |
0.81 |
67 (59, 75) |
69 (62, 75) |
68 (61, 75) |
|
|
2023 |
15,573 |
42.32 |
57.68 |
0.04 |
16.99 |
33.53 |
35.43 |
13.04 |
0.97 |
69 (61, 76) |
70 (64, 76) |
69 (63, 76) |
|
|
Total |
116,103 |
41.48 |
58.52 |
1.41 |
10.26 |
29.25 |
40.35 |
17.78 |
0.94 |
70 (63, 77) |
70 (64, 77) |
70 (64, 77) |
|
|
Data are presented as number (%) or median (IQR). N, number of patients (percentages are based on n). *For all year group, P<0.001; calculated by binomial tests to compare the difference of gender among years. |
|||||||||||||
In terms of age distribution, the 70-79 age group was the most prevalent, accounting for 40.35% of the total patient cohort, followed by the 60-69 age subgroup (29.25%). Patients aged 80-89 years accounted for 17.78%, while those in the 40-49 (1.41%) and ≥ 90-year (0.94%) categories represented smaller proportions. Over the 10-year study period, the proportions of patients aged 50-59 and 60-69 years increased, whereas declining trends were observed in the 70-79 and 80-89 age groups.
Analysis of Median Age Trends
Weighted linear regression analysis of the median age of patients with age-related cataracts from 2014 to 2023 (Table 2) revealed a significant downward trend in the overall cohort, decreasing from 72 years (IQR: 65-78) in 2014 to 69 years (IQR: 63-76) in 2023. Similar downward trends were observed among both male and female patients. The adjusted R² for the overall population was 0.874, indicating a strong model fit. The regression coefficient was -0.434 (t = -897.89, P < 0.001), indicating an annual decline of 0.434 years in the median age of all patients.
|
Group |
Patient number |
Adjusted R² |
B Coefficient |
t |
P* |
|
Male |
48,329 |
0.751 |
-0.458 |
-381.646 |
<0.001 |
|
Female |
67,774 |
0.726 |
-0.294 |
-423.919 |
<0.001 |
|
Total |
116,103 |
0.874 |
-0.434 |
-897.893 |
<0.001 |
|
*P<0.001 calculated by weighted linear regression method. |
|||||
Among male patients, the adjusted R² was 0.751, with a regression coefficient of -0.458 (t = -381.65, P < 0.001), suggesting an annual decrease of 0.458 years. Similarly, for female patients, the adjusted R² was 0.726, with a regression coefficient of -0.294 (t = -423.92, P < 0.001), reflecting an annual decline of 0.294 years. These results demonstrate a substantial decrease in the median age of patients over the study period, with the decline more pronounced among male patients.
Trends in biochemical marker abnormalities
Among ARC surgery patients, the observed prevalence of abnormal values for the measured parameters were as follows: TG (31.94%), GLU (31.06%), TC (39.78%), ALT (10.23%), AST (5.55%), ALB (4.86%), TP (5.80%), Cr (12.52%), urea (21.59%), Na⁺ (4.60%), K⁺ (3.19%), Cl⁻ (5.45%), and Ca²⁺ (2.73%) (Table 3).
|
Biochemical Markers |
2014-2015 |
2016-2017 |
2018-2019 |
2020-2021 |
2022-2023 |
Total |
|
Patient number |
23,080 |
22,191 |
23,185 |
20,905 |
26,742 |
116,103 |
|
TG |
27.98 (27.40, 28.56) |
32.23 (31.62, 32.85) |
32.66 (32.06, 33.27) |
32.83 (32.19, 33.47) |
33.80 (33.23, 34.36) |
31.94 (31.67, 32.21) |
|
GLU |
19.57 (19.06, 20.08) |
29.98 (29.37, 30.58) |
30.08 (29.49, 30.67) |
35.44 (34.79, 36.08) |
39.32 (38.73, 39.90) |
31.06 (30.79, 31.33) |
|
TC |
31.57 (30.97, 32.17) |
36.10 (35.47, 36.73) |
39.57 (38.94, 40.20) |
43.39 (42.72, 44.06) |
47.28 (46.68, 47.88) |
39.78 (39.50, 40.06) |
|
ALT |
2.61 (2.41, 2.82) |
4.80 (4.52, 5.08) |
9.39 (9.01, 9.76) |
12.94 (12.48, 13.39) |
19.93 (19.45, 20.41) |
10.23 (10.06, 10.40) |
|
AST |
2.02 (1.84, 2.20) |
6.11 (5.80, 6.43) |
7.05 (6.72, 7.38) |
6.35 (6.02, 6.68) |
6.20 (5.91, 6.49) |
5.55 (5.42, 5.68) |
|
ALB |
12.57 (12.14, 13.00) |
4.34 (4.07, 4.60) |
3.50 (3.26, 3.73) |
2.43 (2.22, 2.63) |
1.72 (1.56, 1.88) |
4.86 (4.74, 4.98) |
|
TP |
1.30 (1.15, 1.45) |
4.81 (4.53, 5.09) |
6.19 (5.87, 6.50) |
7.56 (7.20, 7.92) |
8.82 (8.48, 9.16) |
5.80 (5.67, 5.93) |
|
Cr |
9.58 (9.20, 9.96) |
13.01 (12.57, 13.46) |
12.81 (12.38, 13.24) |
13.67 (13.20, 14.13) |
13.48 (13.07, 13.89) |
12.52 (12.33, 12.71) |
|
UREA |
24.14 (23.59, 24.69) |
12.32 (11.89, 12.75) |
19.68 (19.16, 20.19) |
23.59 (23.02, 24.17) |
27.18 (26.65, 27.72) |
21.59 (21.35, 21.83) |
|
Na+ |
4.44 (4.18, 4.71) |
3.85 (3.60, 4.11) |
5.02 (4.74, 5.30) |
5.64 (5.33, 5.96) |
4.20 (3.96, 4.44) |
4.60 (4.48, 4.72) |
|
K+ |
2.00 (1.82, 2.18) |
2.34 (2.14, 2.54) |
3.66 (3.42, 3.90) |
4.24 (3.97, 4.51) |
3.70 (3.47, 3.92) |
3.19 (3.09, 3.29) |
|
Cl- |
1.63 (1.47, 1.80) |
2.33 (2.13, 2.52) |
6.88 (6.56, 7.21) |
9.54 (9.14, 9.94) |
6.89 (6.58, 7.19) |
5.45 (5.32, 5.58) |
|
Ca2+ |
N/M |
1.03 (0.80, 1.26)* |
1.99 (1.81, 2.17) |
2.86 (2.63, 3.09) |
3.18 (2.97, 3.39) |
2.73 (2.62, 2.84) |
|
TG, triglycerides; GLU, glucose; TC, total cholesterol; ALT, alanine aminotransferase; AST, aspartate aminotransferase; ALB, albumin; TP, total protein; Cr, creatinine; Na⁺, sodium; K⁺, potassium; Cl⁻, chloride; Ca²⁺, calcium. Data are presented as percentage (95% confidence interval). 95% CI are calculated by Clopper-Pearson method. N/M, not measured (calcium was excluded from the measurement protocol in 2014–2015). *Ca²⁺ data were collected from 2017 onward (n = 7,409). |
||||||
After adjusting for gender and age group as covariates, GLM analysis revealed significant temporal trends in multiple biochemical markers (Table 4). Among metabolic markers, GLU exhibited the most pronounced biennial increase, with the prevalence of abnormal values rising by 16.65% (95% CI: 14.23% to 19.25%, P < 0.001). The prevalence of TC abnormalities increased at a biennial rate of 10.08% (95% CI: 8.65% to 11.63%, P < 0.001), and TG showed a 3.36% increment (95% CI: 1.31% to 5.34%, P = 0.001).
|
Biochemical Markers |
Coefficient (B) |
Percentage Change (%)* |
95% CI |
95% CI (%)§ |
Wald χ² |
P† |
|
TG |
0.033 |
3.36 |
(0.013, 0.052) |
(1.31, 5.34) |
10.692 |
0.001 |
|
TC |
0.096 |
10.08 |
(0.083, 0.110) |
(8.65, 11.63) |
188.432 |
<0.001 |
|
GLU |
0.155 |
16.65 |
(0.133, 0.176) |
(14.23, 19.25) |
197.040 |
<0.001 |
|
ALT |
0.348 |
41.76 |
(0.259, 0.436) |
(29.53, 54.66) |
59.682 |
<0.001 |
|
AST |
0.188 |
20.68 |
(0.110, 0.265) |
(11.63, 30.35) |
22.569 |
<0.001 |
|
ALB |
-0.484 |
-38.74 |
(-0.545, -0.423) |
(-42.16, -34.45) |
241.555 |
<0.001 |
|
TP |
0.397 |
48.74 |
(0.332, 0.463) |
(39.36, 58.85) |
143.098 |
<0.001 |
|
Cr |
0.115 |
11.85 |
(0.067, 0.162) |
(6.93, 17.58) |
22.173 |
<0.001 |
|
UREA |
0.089 |
9.31 |
(0.043, 0.135) |
(4.39, 14.46) |
14.195 |
<0.001 |
|
Na+ |
0.032 |
3.15 |
(-0.002, 0.065) |
(-0.20, 6.72) |
3.364 |
0.067 |
|
K+ |
0.183 |
19.84 |
(0.144, 0.222) |
(15.49, 24.85) |
84.249 |
<0.001 |
|
Cl- |
0.453 |
57.30 |
(0.382, 0.525) |
(46.48, 69.17) |
153.276 |
<0.001 |
|
Ca2+ |
0.105 |
10.85 |
(0.042, 0.168) |
(4.29, 18.30) |
10.546 |
0.001 |
|
TG, triglycerides; GLU, glucose; TC, total cholesterol; ALT, alanine aminotransferase; AST, aspartate aminotransferase; ALB, albumin; TP, total protein; Cr, creatinine; Na⁺, sodium; K⁺, potassium; Cl⁻, chloride; Ca²⁺, calcium. *Percentage change (%) was calculated by exponentiating the regression coefficient (B), representing the biennial change in the prevalence of abnormal biochemical markers. §95% CI (%) was calculated by exponentiating the regression 95% CI. †P calculated by Generalized Linear Model method. |
||||||
Liver function indices revealed concerning patterns: the prevalence of ALT abnormalities increased by 41.76% (95% CI: 29.53% to 54.66%, P < 0.001) and AST increased by 20.68% (95% CI: 11.63% to 30.35%, P < 0.001). TP abnormalities rose sharply by 48.74% (95% CI: 39.36% to 58.85%, P < 0.001), while ALB abnormalities declined by 38.74% biennially (95% CI: −42.16% to −34.45%, P < 0.001)—the only marker showing a significant decrease.
Renal biomarkers showed consistent deterioration, with the prevalence of urea and Cr increasing by 9.31% and 11.85%, respectively (both P < 0.001). Among electrolyte disturbances, Cl⁻ exhibited the most marked increase of 57.30% (95% CI: 46.48% to 69.17%, P < 0.001), while K⁺ and Ca²⁺ abnormalities increased by 19.84% and 10.85%, respectively (both P < 0.001).
Different alterations of metabolic biomarkers among genders
Figure 1 illustrates marked gender differences in the age-stratified prevalence of metabolic abnormalities among patients with ARC. For TC and TG, the prevalence in males declined after age 50. In contrast, the prevalence in females peaked in the 60-69 age group before gradually declining, remaining consistently higher than that in males from age 50 onwards. Regarding GLU, the age-related patterns were similar between genders: males exhibited a higher prevalence than females in the 40-49 age group, with both groups showing an upward trend; the rates then converged after the 60s and gradually declined. Overall, across the observation period, females had higher abnormality rates for TC and TG than males, whereas GLU rates were similar between genders. Over the ten-year period, the abnormality rates for all three markers showed a similar upward trend in both males and females.
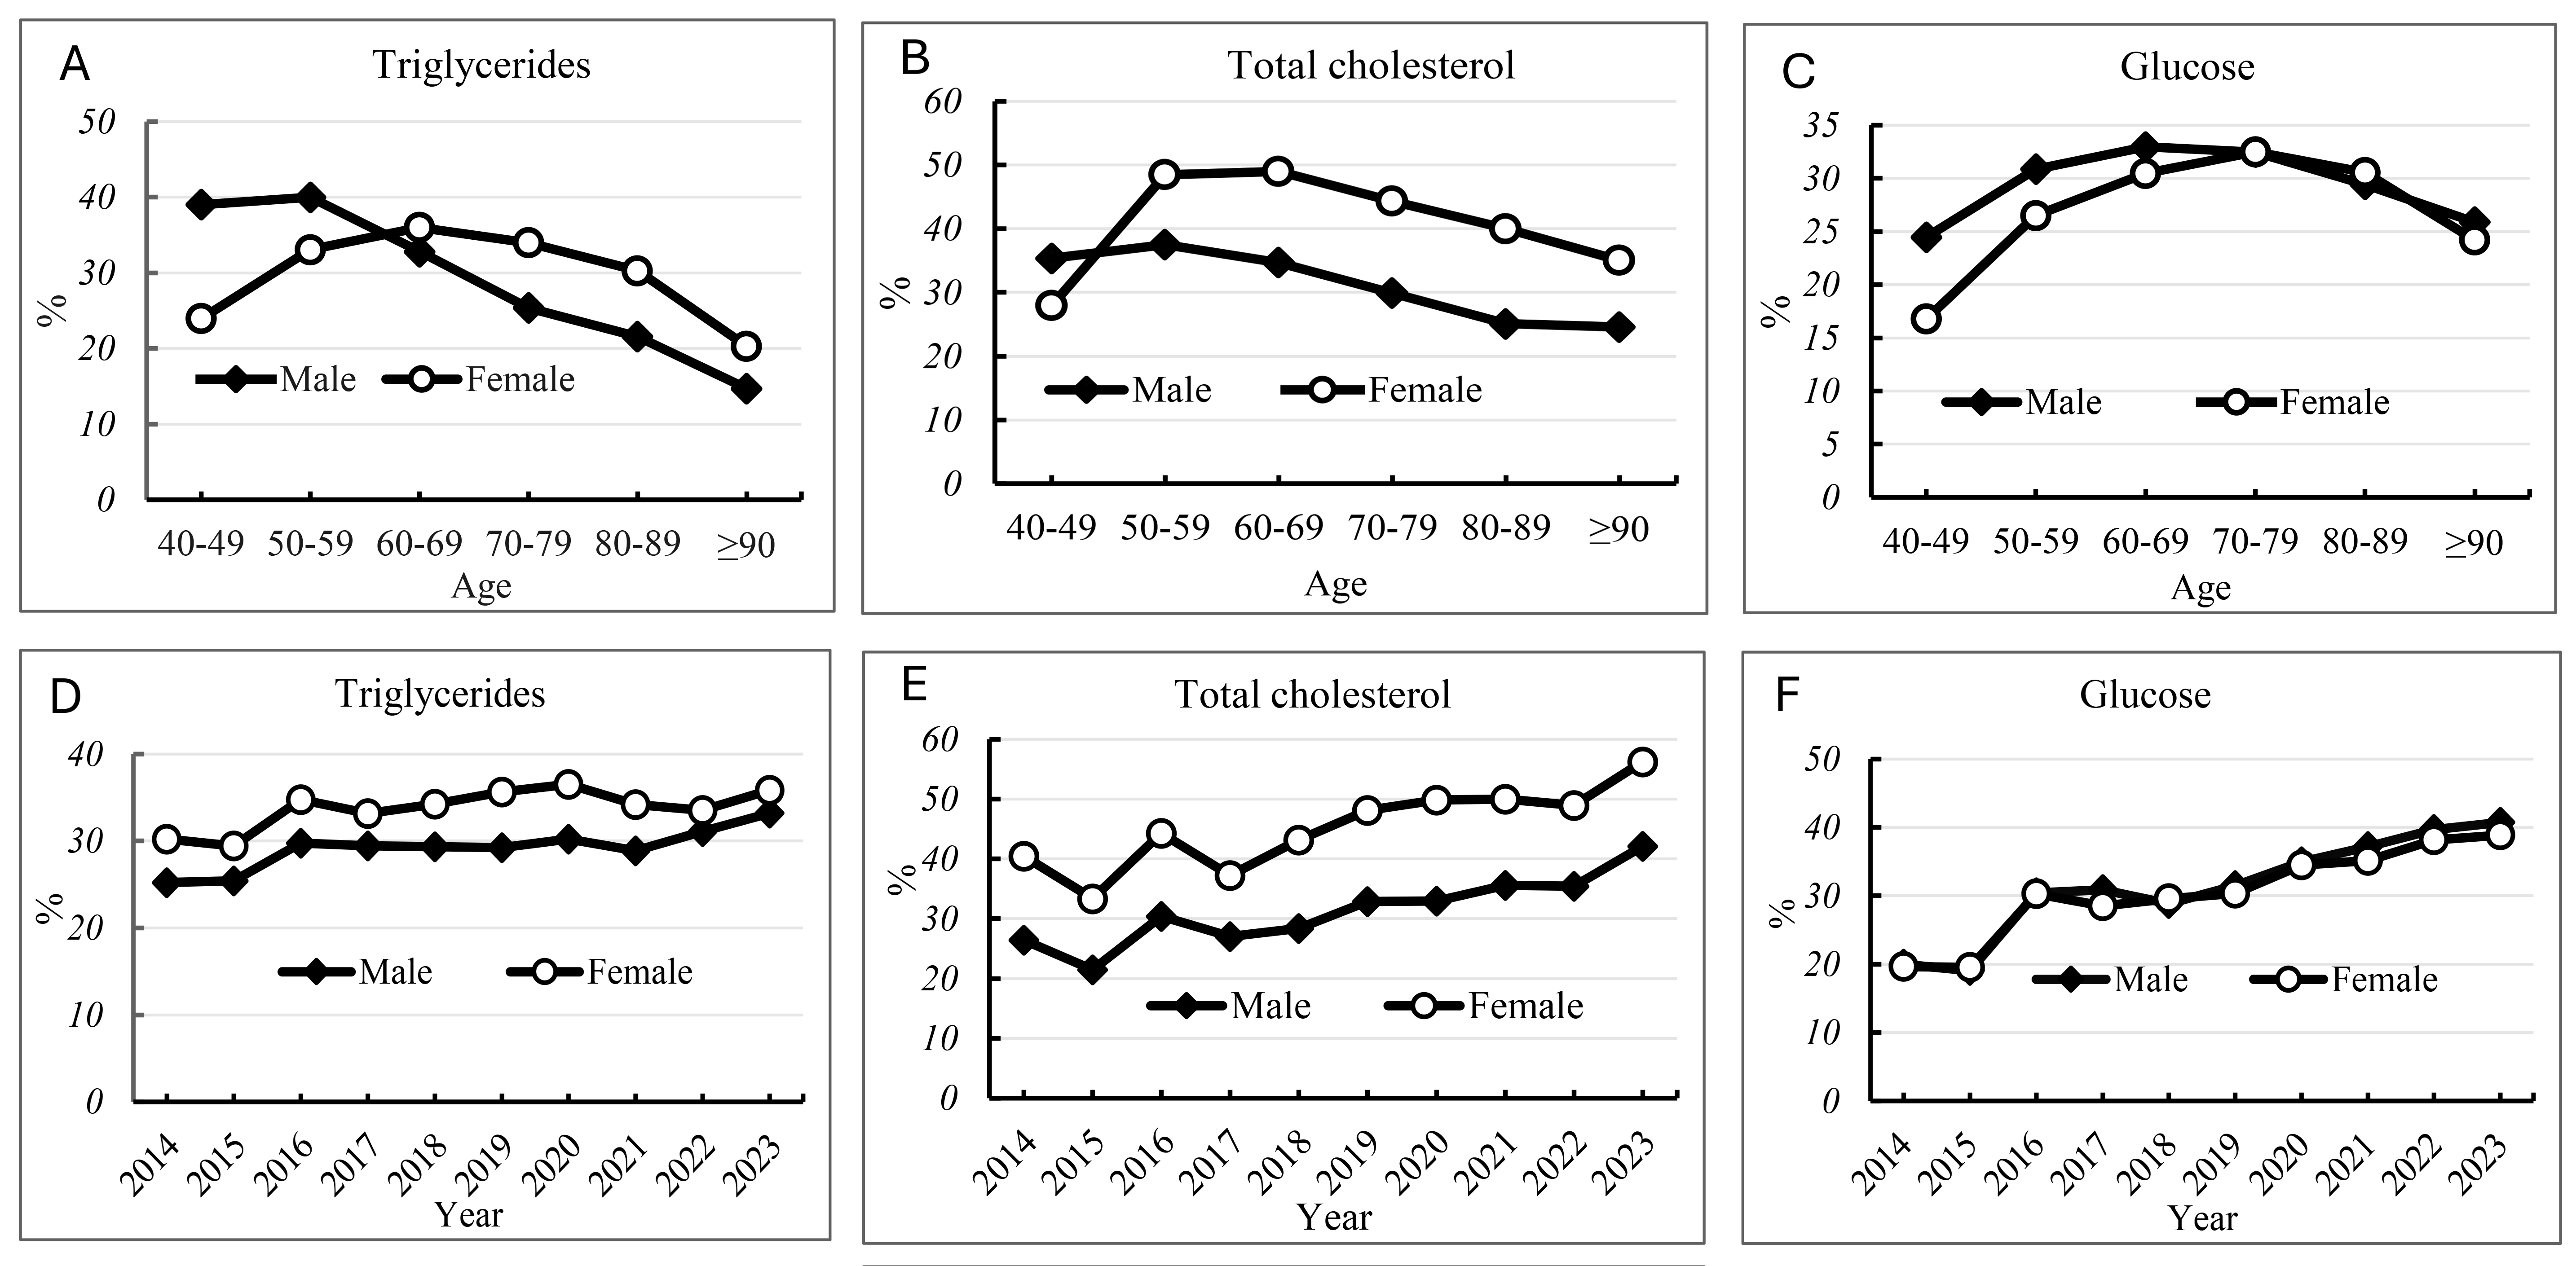
Panels showed abnormality rates based on the age groups (A-C) and year groups (D-F) from 2014 to 2023.
Trends in biochemical marker levels
From 2014 to 2023, trends in the standardized mean values of biochemical markers in ARC surgery patients were analyzed (Table 5). Data were aggregated into two-year intervals to examine temporal changes in biochemical marker values over the study period. After adjusting for gender and age group as covariates, GLM analysis revealed significant temporal trends in the mean values of several biochemical markers (Table 6). The standardized mean values of lipid and glucose metabolism parameters demonstrated statistically significant upward trends. Specifically, GLU exhibited the most pronounced increase (B = 0.093, 95% CI: 0.079 to 0.107, P < 0.001), reflecting a significant temporal rise in glycemic levels. Both TC (B = 0.045, 95% CI: 0.040-0.050, P < 0.001) and TG (B = 0.021, 95%CI: 0.011 to 0.031, P < 0.001) also showed consistent upward trajectories. Among hepatic parameters, ALB showed a significant increase (B = 0.078, 95% CI: 0.059 to 0.096, P < 0.001). Renal biomarkers exhibited opposing trends: urea increased significantly (B = 0.034, 95%CI: 0.014 to 0.055, P < 0.001), while Cr decreased (B = -0.017, 95%CI: -0.026 to -0.009, P < 0.001). K+ levels showed a steady increase (B = 0.031, 95% CI: 0.027 to 0.035, P < 0.001), while Ca2+ levels significantly decreased (B = -0.037, 95% CI: -0.044 to 0.031, P < 0.001).
|
Biochemical Markers |
2014-2015 |
2016-2017 |
2018-2019 |
2020-2021 |
2022-2023 |
Total |
|
Patient number |
23,080 |
22,191 |
23,185 |
20,905 |
26,742 |
116,103 |
|
TG |
0.84 (0.80, 0.86) |
0.93 (0.92, 0.94) |
0.95 (0.94, 0.96) |
0.95 (0.94, 0.96) |
0.96(0.95, 0.97) |
0.93 (0.93, 0.93) |
|
GLU |
0.80 (0.80, 0.81) |
0.85 (0.84, 0.86) |
0.92 (0.91, 0.92) |
0.95 (0.95, 0.96) |
0.98 (0.98, 0.98) |
0.90 (0.90, 0.90) |
|
TC |
0.71 (0.70, 0.72) |
1.00 (0.99, 1.01) |
1.01 (1.00, 1.02) |
1.09 (1.07, 1.10) |
1.13 (1.12, 1.14) |
0.99 (0.98,1.00) |
|
ALT |
0.28 (0.27, 0.28) |
0.31 (0.30, 0.31) |
0.32 (0.31, 0.32) |
0.28 (0.27, 0.28) |
0.23 (0.22, 0.23) |
0.28 (0.28, 0.28) |
|
AST |
0.39 (0.39, 0.39) |
0.34 (0.34, 0.35) |
0.38 (0.38, 0.39) |
0.41 (0.40, 0.41) |
0.41 (0.40, 0.41) |
0.39 (0.38, 0.39) |
|
ALB |
0.17 (0.17, 0.17) |
0.57 (0.57, 0.58) |
0.50 (0.50, 0.51) |
0.55 (0.55, 0.55) |
0.59 (0.59, 0.59) |
0.48 (0.48, 0.48) |
|
TP |
0.51 (0.51, 0.51) |
0.56 (0.55, 0.56) |
0.49 (0.49, 0.50) |
0.49 (0.49, 0.50) |
0.55 (0.54, 0.55) |
0.52 (0.52, 0.52) |
|
Cr |
0.64 (0.63, 0.64) |
0.62 (0.61, 0.63) |
0.60 (0.59, 0.61) |
0.56 (0.55, 0.57) |
0.56 (0.55, 0.57) |
0.59 (0.59, 0.60) |
|
UREA |
0.80 (0.79, 0.81) |
0.53 (0.52, 0.53) |
0.69 (0.69, 0.70) |
0.77 (0.76, 0.78) |
0.82 (0.82, 0.83) |
0.73 (0.72, 0.73) |
|
Na+ |
0.44 (0.44, 0.45) |
0.47 (0.47, 0.48) |
0.40 (0.40, 0.40) |
0.36 (0.36, 0.36) |
0.51 (0.50, 0.51) |
0.44 (0.44, 0.44) |
|
K+ |
0.38 (0.38, 0.38) |
0.43 (0.4, 0.43) |
0.48 (0.48, 0.49) |
0.52 (0.51, 0.52) |
0.49 (0.49, 0.50) |
0.46 (0.46, 0.46) |
|
Cl- |
0.49 (0.48, 0.49) |
0.46 (0.4, 0.47) |
0.44 (0.44, 0.45) |
0.45 (0.44, 0.45) |
0.50 (0.50, 0.50) |
0.47 (0.47, 0.47) |
|
Ca2+ |
N/M |
0.50 (0.50, 0.51) |
0.47 (0.46, 0.47) |
0.48 (0.47, 0.48) |
0.39 (0.39, 0.39) |
0.45 (0.44, 0.45) |
|
TG, triglycerides; GLU, glucose; TC, total cholesterol; ALT, alanine aminotransferase; AST, aspartate aminotransferase; ALB, albumin; TP, total protein; Cr, creatinine; Na⁺, sodium; K⁺, potassium; Cl⁻, chloride; Ca²⁺, calcium. Data are presented as percentage (95% confidence interval). 95% CI are calculated by normal approximation method. N/M, not measured (calcium was excluded from the measurement protocol in 2014-2015). *Ca²⁺ data were collected from 2017 onward (N = 7,409). If the upper and lower limits round to the same value after rounding, these indicates that the true difference between the interval limits is less than 0.01.
|
||||||
|
Biochemical Markers |
Coefficient (B) |
95% CI |
Wald χ² |
P* |
|||
|
TG |
0.021 |
0.011, 0.031 |
16.213 |
<0.001 |
|||
|
TC |
0.045 |
0.040, 0.050 |
291.150 |
<0.001 |
|||
|
GLU |
0.093 |
0.079, 0.107 |
168.370 |
<0.001 |
|||
|
ALT |
-0.016 |
-0.026, -0.005 |
8.986 |
0.003 |
|||
|
AST |
0.011 |
-0.001, 0.023 |
3.120 |
0.077 |
|||
|
ALB |
0.078 |
0.059, 0.096 |
67.497 |
<0.001 |
|||
|
TP |
0.000 |
-0.005, 0.006 |
0.006 |
0.940 |
|||
|
Cr |
-0.017 |
-0.026, -0.009 |
15.133 |
<0.001 |
|||
|
UREA |
0.034 |
0.014, 0.055 |
10.972 |
0.001 |
|||
|
Na+ |
0.004 |
-0.006, 0.013 |
0.537 |
0.464 |
|||
|
K+ |
0.031 |
0.027, 0.035 |
233.443 |
<0.001 |
|||
|
Cl- |
0.003 |
-0.001, 0.007 |
1.969 |
0.161 |
|||
|
Ca2+ |
-0.037 |
-0.044, -0.031 |
129.891 |
<0.001 |
|||
|
TG, triglycerides; GLU, glucose; TC, total cholesterol; ALT, alanine aminotransferase; AST, aspartate aminotransferase; ALB, albumin; TP, total protein; Cr, creatinine; Na⁺, sodium; K⁺, potassium; Cl⁻, chloride; Ca²⁺, calcium. *P calculated by Generalized Linear Model method. |
|||||||
Discussion
This decade‑long serial cross-sectional analysis of 116,103 ARC surgery patients in Southern China, derived from routine clinical practice data, provides real‑world evidence on the evolving demographic and preoperative biochemical profiles of cataract surgical candidates. Over the past decade, China has experienced major transitions in diet, physical activity, health insurance coverage, surgical technology, and vision care. All these factors may influence both surgical timing and patients' metabolic status. Analyzing long‑term trends helps disentangle these multifactorial drivers and offers a stronger evidence base for clinical and policy decisions. The study reveals several key trends: a significant decrease in the median age at surgery over the decade (by 3 years, P < 0.001) with a more pronounced decline in the male cohort; a continuous increase in the prevalence of metabolic biomarker abnormalities (e.g., dyslipidemia and hyperglycemia); and a marked decline in the rate of ALB abnormalities. These findings, grounded in real‑world clinical data, provide valuable evidence to inform the optimization of preoperative risk assessment and support the integration of ARC management with chronic disease care. Importantly, as a serial cross-sectional analysis, these trends reflect population-level shifts across different patient cohorts over time rather than within-individual longitudinal changes.
According to data from the National Bureau of Statistics of China, the proportion of the male and female populations aged 40 and above in 2023 was 49.63% and 50.37%, respectively (www.stats.gov.cn/sj/ndsj/). In contrast, our results showed a significant female predominance among patients undergoing ARC surgery (58.52% female vs. 41.48% male), along with gender-specific trends in certain metabolic markers. These findings are consistent with those of previous studies which reported a higher prevalence of cataracts in females compared to males.[26-27] This gender differential may be attributed to a multifactorial interplay involving biological, demographic, and health behavioral determinants. Some studies indicate the protective role of estrogen against lens oxidative stress, while postmenopausal estrogen decline accelerates cataractogenesis by diminishing this protective mechanism.[27-28] Concurrently, women's longevity advantage extends cumulative exposure to cataract risk factors, leading to a faster rise in prevalence among elderly females within aging populations. These findings underscore the necessity for optimized gender-specific cataract screening protocols and enhanced ocular health education targeting premenopausal women, particularly in the context of global aging trends.
Notably, a significant downward trend in median surgical age was observed during the study period, potentially attributable to multifactorial influences. China's improved healthcare system and national cataract prevention programs have enhanced early screening coverage, facilitating timely interventions.[29] Optimized health insurance policies and financial support from government or health organizations have substantially reduced treatment costs, expanding surgical accessibility,[30] and demonstrating the socioeconomic benefits of synergistic technological innovation and policy support in combating blinding eye diseases. Advancements in surgical techniques, particularly the widespread adoption of phacoemulsification and intraocular lens implantation, have promoted earlier interventions through improved safety profiles.[31] Concurrently, China's economic development and rising living standards have heightened public health awareness, with growing demands for visual quality. Enhanced health education and increased social engagement have fostered proactive healthcare-seeking behaviors across populations, particularly regarding quality-of-life expectations. The accelerated age reduction in male surgical candidates may correlate with multiple factors such as gender-specific risk exposures, including prevalent lifestyle factors (smoking: male 52.1% vs. female 2.5%; alcohol abuse: male 33% vs. female 2%).[32-33] These collective factors contribute to the trend of younger age at cataract surgery, with gender-specific patterns influenced by risk profiles and societal roles, underscoring the imperative for targeted public health strategies including risk-specific health education, occupational protection programs, and behavioral interventions. Beyond patient demand and health awareness, changes in physician decision-making have also contributed to the younger surgical age. Surgeons are increasingly willing to operate on patients with less advanced cataracts, driven by the excellent safety record of modern phacoemulsification and the availability of premium intraocular lenses that address refractive errors. The expansion of health insurance coverage has lowered financial barriers, enabling earlier access to surgical care. These systemic and technological drivers, together with patient level factors, collectively explain the observed trend.
From 2014 to 2023, ARC surgical patients exhibited significant upward trends in biochemical abnormalities, indicating population-level shifts in systemic metabolic profiles. Lipid (TC, TG) and GLU levels exhibited sustained increase. These trends likely correlate with the high prevalence of chronic comorbidities such as diabetes and hypertension in elderly Chinese patients.[34-35] Standardized mean analysis further confirmed progressive elevations in TG, TC, and GLU, highlighting dynamic deterioration of lipid and glucose homeostasis. These shifts align with China's socioeconomic transformation, characterized by dietary transitions from plant-based to Westernized patterns high in animal products and refined carbohydrates, alongside reduced physical activity due to mechanization.[27, 36-38] The shift towards Westernized dietary patterns, characterized by higher intake of animal fats, processed foods, and refined carbohydrates, along with declining occupational and leisure-time physical activity, are well-established drivers of metabolic syndrome in developing populations.[36] These lifestyle changes have been documented at the national level in China over the past decades and likely underpin the rising prevalence of dyslipidemia and hyperglycemia observed in our surgical cohort.[38] It is important to note, however, that the observed increases in biochemical abnormalities among surgical candidates could also be influenced by changing surgical selection criteria, shifting patient demographics, and variations in referral patterns over time, rather than solely reflecting a direct worsening of population health. Additionally, lipid-glucose dysregulation possibly exacerbates cataract progression and postoperative risks through oxidative stress and inflammatory pathways.[17-18, 39-41] These findings not only underscore the necessity of preoperative metabolic profiling to optimize surgical outcomes, but also highlight how rising dyslipidemia (TC, TG) and hyperglycemia (GLU) call for nationwide public health measures, such as dietary campaigns promoting low-fat and low-sugar intake and expanded community metabolic screening. Meanwhile, integrating ophthalmic exams into metabolic syndrome protocols and fostering ophthalmology-internal medicine collaboration can strengthen early prevention and comprehensive care for high-risk ARC patients.
Hepatic parameters exhibited significant temporal trends, with ALT and AST abnormality rates rising substantially. This increased abnormality indicated hepatic dysfunction, potentially influenced by factors such as high hepatitis B prevalence in the cohort (predating universal HBV vaccination) and alcohol-related liver disease.[42-44] In addition, the rise in the abnormality rate was much more pronounced for ALT than for AST. Given that ALT is a more liver-specific enzyme than the widely distributed AST, the observed elevation suggests a primarily hepatic origin of liver dysfunction in these ARC patients. This underscores the importance of preoperative liver function evaluation to assess metabolic and inflammatory risks, thereby optimizing surgical safety and postoperative outcomes. Furthermore, protein metabolism markers exhibited divergent trends, with a 48.74% increase in TP and a 38.74% decrease in ALB abnormalities. Comprising albumin and globulins, elevated TP abnormalities may indicate immunoglobulin increases, suggesting chronic inflammation in ARC patients. However, the standardized mean TP showed no significant shift, implying that the elevated abnormality rate reflects an increased proportion of extreme values within the cohort. Conversely, declining ALB abnormalities alongside rising standardized levels may reflect improved nutritional status in this population[45] or alternatively, could be influenced by changes in case mix, preoperative screening practices, or laboratory assay standardization over time. Specifically, the proportion of patients with abnormally low albumin decreased, but this finding should be interpreted cautiously as it may be affected by multiple factors including improved general nutrition, earlier surgical intervention before nutritional decline, or changes in the patient population undergoing surgery. These paradoxical patterns warrant further investigation but suggest potential clinical utility in monitoring inflammatory biomarkers for both cataract risk stratification and the health management of the aged population.
Renal biomarkers demonstrated concerning trends, with Cr and urea abnormalities showing progressive increases, aligning with the rising prevalence of CKD in recent decades.[46] Electrolyte metabolism parameters, including K⁺ and Cl⁻, demonstrated relatively low overall abnormality rates, nevertheless exhibited significant upward trends with respective increases of 19.84% and 57.30%. Although these electrolyte disturbances exhibit limited direct impact on cataractogenesis, their clinical significance lies in anesthesia risk mitigation, particularly potassium imbalances, which substantially elevate perioperative cardiovascular risks.[47-48] These findings underscore the necessity of preoperative electrolyte profiling to ensure homeostasis and optimize surgical safety.
Collectively, the observed shifts in preoperative biochemical profiles among ARC surgery patients suggest that this routinely-screened population may serve as a valuable sentinel surveillance system for monitoring the evolving burden of metabolic and systemic chronic diseases in the aging population. The increasing prevalence of dyslipidemia, hyperglycemia, and renal function abnormalities observed in this surgical cohort mirrors broader epidemiological trends in China and other rapidly developing nations. This alignment suggests that routine preoperative data, which are already systematically collected in clinical practice, could be leveraged for population health surveillance beyond their immediate perioperative utility. However, we acknowledge that this is a preliminary observation and that the generalizability of these findings to the broader aging population requires further validation.
While the primary strength of this study lies in its utilization of a decade‑spanning large sample size derived from routine clinical practice, providing real‑world evidence with high external validity, it has some limitations. First, the single‑center design may limit the generalizability of findings, particularly regarding population representativeness. Second, critical confounding factors including lifestyle determinants and environmental exposures were not systematically incorporated. Thirdly, the serial cross-sectional design inherently restricts causal relationship establishment and limits the interpretation of observed trends to population-level shifts rather than individual-level changes. Fourth, changes in laboratory platforms and assay methods over the ten-year period, while adjusted for in sensitivity analyses, may still introduce measurement variability. Fifth, the study lacked postoperative clinical outcomes data, precluding direct assessment of the clinical impact of observed biochemical trends. Finally, the precise physiological mechanisms underlying alterations in specific biochemical parameters require further exploration through in‑depth mechanistic investigations.
Conclusions
This decade-long serial cross-sectional analysis of 116,103 ARC surgical patients revealed dynamic shifts in preoperative biochemical profiling. The median age at surgery decreased by 3 years. Concurrently, the prevalence of most biochemical abnormalities increased, while the rate of abnormal albumin levels decreased. Our findings provide valuable insights for perioperative patient management, facilitating tailored preoperative optimization and postoperative monitoring. These results also suggest that the cataract surgery population could serve as a sentinel cohort for monitoring chronic conditions such as diabetes and dyslipidemia in the aging adults, potentially supporting the design of targeted disease management programs and the promotions of healthy lifestyle within routine geriatric care. Future multicenter studies linking preoperative data to longitudinal health outcomes, and incorporation of lifestyle and socioeconomic variables are needed to validate these observations and elucidate the underlying drivers of these trends. By bridging ophthalmic practice with systemic health management and translating real‑world data into clinically applicable evidence, this work contributes to the overarching goal of improving population-level health in older adults.
List of abbreviations
ALT: alanine aminotransferase
ALB: albumin
ARC: age-related cataract
AST: aspartate aminotransferase
Ca²⁺: calcium
Cl⁻: chloride
CKD: chronic kidney disease
Cr: creatinine
GLU: glucose
GLM: generalized linear model
IQR: interquartile range
K⁺: potassium
Na⁺: sodium
TC: total cholesterol
TG: triglycerides
TP: total protein
Correction notice
None
Acknowledgements
We acknowledge Ling Jin, the clinical laboratory staff for technical assistance for administrative coordination.
Author contributions
(I) Conception and design: Chao Cheng, Kaili Wu;
(II) Administrative support: Chao Cheng, Kaili Wu;
(III) Provision of study materials or patients: Chao Cheng, Kaili Wu;
(IV) Collection and assembly of data: Jingyu Liao, Yubin Yu, Jiaqi Lin;
(V) Data analysis and interpretation: Yidan Fan, Sihao Liu, Yunxi Lai, Jiaqi Lin;
(VI) Manuscript writing: Yidan Fan, Sihao Liu;
(VII) Final approval of manuscript: All authors.
Conflict of interests
The authors declare that they have no conflicts of interest. All authors have completed the ICMJE uniform disclosure form.
Patient consent for publication
Additional informed consent was obtained from all individual participants for whom identifying information is included in this article.
Ethics approval and consent to participate
This study was approved by the Ethics Committee of Zhongshan Ophthalmic Center, Sun Yat-sen University (2018KYPJ140-4) and was conducted in accordance with the tenets of the Declaration of Helsinki.
Data availability statement
None
Open access
This is an Open Access article distributed in accordance with the Creative Commons Attribution NonCommercial-NoDerivs 4.0 International License (CC BY-NC-ND 4.0), which permits the non-commercial replication and distribution of the article with the strict proviso that no changes or edits are made and the original work is properly cited (including links to both the formal publication through the relevant DOI and the license).
Declaration of generative AI use
No generative artificial intelligence (GenAI) tools were used in the preparation of this manuscript.