





HIGHLIGHTS
1. Critical Discoveries and Outcomes
• Mild and moderate myopia achieve absolute refractive stability around ages 15–16.
• High myopia decelerates at ages 13–14 but continues to progress slowly into young adulthood.
2. Methodological Innovations
• Applied piecewise linear regression to precisely quantify the exact age of deceleration across different severities.
• Employed dual sensitivity analyses (stricter criteria and a pre-2020 cohort) to robustly validate these deceleration milestones against potential treatment bias.
3. Prospective Applications and Future Directions
• Demonstrates that high myopes require sustained clinical monitoring and intervention well beyond mid-adolescence.
Introduction
Myopia is a significant public health challenge projected to affect nearly half of the global population by 2050.[1] It imposes substantial health and economic burdens[2] and leads to a decreased quality of life.[3] While extensive research has focused on the onset and progression of myopia,[4–8] its final phase—stabilization—remains relatively understudied. Investigating myopia stabilization provides a deeper understanding of its complete clinical course and informs clinical decision-making.
Previous studies have investigated myopia stabilization across different ages and ethnicities,[9–12] suggesting that myopia tends to stabilize at approximately 15 years of age. However, these studies were largely limited by small sample sizes or the use of non-cycloplegic refraction. Furthermore, evidence indicates that individuals with varying severities of myopia may exhibit distinct progression trajectories. For instance, unlike those with mild and moderate myopia, individuals with high myope may experience continued progression into adulthood.[13-14] To date, there remains a significant knowledge gap regarding whether the age of stabilization differs among children with mild, moderate and high myopia, as well as at what refractive error these groups ultimately stabilize.
To gain deeper insight into myopia stabilization patterns, we retrospectively reviewed clinical records from 2009 to 2022 at the Zhongshan Ophthalmic Center (ZOC). Specifically, we aimed to determine the age and spherical equivalent (SE) at myopia stabilization across varying severities of myopia.
Methods
Study population
This retrospective study reviewed the electronic medical records (EMR) of outpatients at the optometry clinic of ZOC from 2009 to 2022. The inclusion criteria were as follows: (1) ≥3 outpatient visits with SE measured by cycloplegic refraction; (2) age ≤12 years at the first visit and age ≥15 years at the last visit; (3) SE between −15.00 D and +0.50 D in both eyes at all visits; (4) best-corrected visual acuity (BCVA) ≥0.8 in both eyes at the final visit; (5) achievement of myopia stabilization. Myopia stabilization was defined as a mean SE progression rate within ±0.5 D/year between the last two visits, with a minimum interval of 365 days. This definition was based on the following considerations: the threshold of ±0.5D/year was adopted from a previous study in a Chinese population,[12] and a minimum 1 year interval between the last two visits was required to ensure the robustness of the stabilization assessment. To effectively characterize the transition toward myopia stabilization, we specifically included children whose longitudinal records spanned from ≤12 to ≥15 years of age. This age range was selected to encompass the peak years of myopic progression in early adolescence, as well as the typical period during which stabilization begins to emerge.[11]
The exclusion criteria were as follows: (1) presence of strabismus and amblyopia in either eye; and (2) significant hyperopic shifts or non-progression during the follow-up period, defined as a mean annual SE change rate ≥0D/year (where positive values indicate a hyperopic shift) between the baseline and penultimate examinations, or a cumulative SE increase of > 1.00D over the study period.
The study was approved by the Ethics Committee of ZOC, Sun Yat-sen University, Guangzhou, China, and was conducted in accordance with the Declaration of Helsinki. Given the retrospective nature of the study, the requirement for written informed consent was waived by the committee. All data were extracted from existing medical records and anonymized before analysis to ensure patient confidentiality.
Eye examinations
Data were extracted from EMR. As part of routine clinical practice, cycloplegia was performed in accordance with Chinese Expert Consensus on Cycloplegic Refraction and Safe Medication Use in Children (2019). Cycloplegia was induced using 0.5% tropicamide eye drops, with one drop instilled every 5 minutes for a total of three instillations. Adequate cycloplegia was defined as a pupil diameter ≥ 6 mm and the absence of a pupillary light reflex. Trained optometrists then performed autorefraction.
Statistical analysis
The SE was calculated as the spherical power plus half the cylindrical power. Given the high interocular correlation of SE, only data from the right eye were included in the analyses. Based on their final SE, patients were stratified into mild (>−3D), moderate (≤−3D to >−6D), and high (≤−6D) myopia groups.[15] ANOVA was used to compare the final SE across sex and baseline SE groups. For each myopia severity group, the longitudinal trajectory of SE progression with age was plotted for each participant and fitted using the Generalized Additive Model (GAMs) with smooth curve fitting. To identify the "turning point", defined as the age of stabilization or the point of deceleration, a piecewise linear regression model was applied using the chngpt R package. This model evaluated the threshold effect of age on SE by iteratively testing candidate change points across the age range. A sensitivity analysis was conducted using stricter criteria: (1) ≥4 cycloplegic visits; (2) an average SE progression rate in both eyes within ±0.5D/year over the last three eye examinations; and (3) a minimum follow-up interval of ≥730 days across the last three eye examinations. Furthermore, to control for the potential confounding effects of intensive myopia control interventions that became widely adopted after 2020, a second sensitivity analysis was performed by using a historical sub-cohort restricted to examinations conducted strictly prior to 2020. All statistical analyses were performed using R 4.4.1, and with statistical significance defined as P < 0.05.
Results
A total of 1,807 children were finally included (52.7% male), of whom 266 (14.7%), 1,010 (55.9%), and 531 (29.4%) were classified as having mild, moderate, and high myopia, respectively (Supplementary Table 1). Overall, 331 patients (18.3%) had ≥6 visits. The median follow-up duration was 5.45 years (IQR: 4.20 to 6.79). The median age at baseline was 11.0 years (IQR: 10.0, 12.0), and the median age at final visit was 16.0 years (IQR: 15.0 to 17.0). The median baseline SE was −2.50 D (IQR: −3.88 to −1.5), and the median final SE was −4.88 D (IQR: −6.88 to −3.7).
The mean final SE, representing the stabilized degree of myopia, was −2.34 D (SD = 0.612), −4.57 D (SD = 0.816), and −7.61 D (SD = 1.33) for children in the mild, moderate, and high myopia groups, respectively (Supplementary Table 2). Within the same myopia severity group, no significant difference in the final SE was observed between sexes (Supplementary Table 2). However, a significant difference in final SE was observed across baseline myopia severity groups, with more severe baseline myopia associated with a more myopic final SE (Supplementary Table 2).
Figure 1A displays the individual spherical equivalent (SE) trajectories over age, stratified by myopia severity, while Figure 1B shows the corresponding smoothed fitting curves. The results indicated a notable deceleration in myopia progression at approximately 15 years of age across all severity levels. However, unlike the mild and moderate myopia groups, which trend toward stabilization, children with high myopia appeared to continue progressing beyond the age of 15. These results were similar across sexes (Supplementary Figure 1).
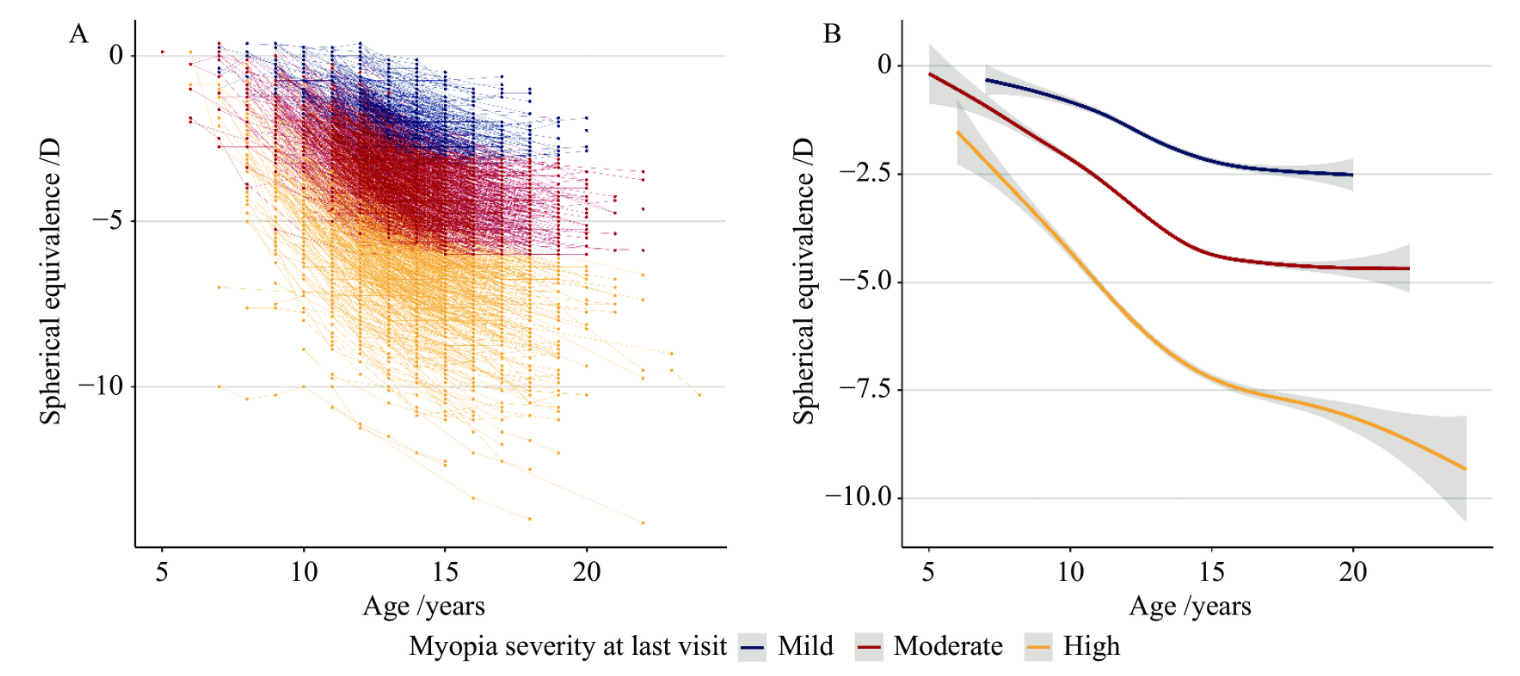
A: the individual trajectories in stabilized myopia patients stratified by myopia degree at last visit; B: the smoothed trajectories in stabilized myopia patients stratified by myopia severity at last visit; the grey area stood for 95% confidence interval.
To quantify the SE trajectory and identify change points, piecewise linear regression was applied (Table 1 and Supplementary Figure 2). Both the mild and moderate myopia group exhibited a significant deceleration in myopia progression around the age of 15, followed by a near-zero progression rate. In the mild myopia group, the estimated progression rate was −0.28 D/year (95%CI, −0.32 to −0.25; P < 0.001) before the age of 15. This rate slowed significantly by 0.21 D/year (95%CI, 0.16 to 0.32; P < 0.001), resulting in a near-stable trend rate of −0.07 D/year (95%CI, −0.16 to 0.07) after the age of 15. Similarly, in the moderate myopia group, the estimated progression rate was −0.45 D/year (95%CI, −0.51 to −0.43; P < 0.001) before the age of 15, which then decreased by 0.41 D/year (95%CI, 0.36 to 0.44; P < 0.001), leading to a near-stable rate of −0.04 D/year (95%CI, −0.15 to 0.01) after the age of 15. In contrast, the high myopia group continued to progress, despite a notable deceleration observed around age 14. Before age 14, the progression rate was −0.67 D/year (95%CI, −0.8 to −0.6; P < 0.001), which showed by 0.41 D/year (95%CI, 0.36 to 0.44; P < 0.001), resulting in a slower rate of −0.2 D/year (95%CI, −0.4 to −0.03) after age 14. Subtle sex discrepancies were observed in myopia stabilization; boys tended to stabilize earlier in the mild myopia group, while girls exhibited an earlier deceleration change point in the high myopia (Supplementary Table 3 and Supplementary Figure 3).
|
Myopia severity |
β (95% CI) |
P value |
|
Mild |
|
|
|
Breakpoint (Std. Error) |
15 (0.51) |
|
|
Age < 15 |
−0.28 (−0.32, −0.25) |
<0.001 |
|
Age > 15 |
0.21 (0.16, 0.32) * |
<0.001 |
|
Medium |
|
|
|
Breakpoint (Std. Error) |
15 (0.26) |
|
|
Age < 15 |
−0.45 (−0.51, −0.43) |
<0.001 |
|
Age > 15 |
0.41 (0.36, 0.44) * |
<0.001 |
|
High |
|
|
|
Breakpoint (Std. Error) |
14 (0.51) |
|
|
Age < 14 |
−0.67 (−0.80, −0.60) |
<0.001 |
|
Age > 14 |
0.47 (0.40, 0.57) * |
<0.001 |
|
* The value indicated the change of β compared to the β before breakpoint |
||
The sensitivity analysis included 1,083 children (55.6% male) with a median follow-up duration of 5.98 years (IQR: 4.92, 7.09) (Supplementary Table 4). The mean final SE was −2.29 D, −4.63 D, and −7.73 D for the mild, moderate, and high myopia groups, respectively. The mean final SE across severity groups was comparable to that of the primary cohort (Supplementary Table 5). Plots depicting individual SE trajectories over age, stratified by myopia severity and sex, along with the corresponding smoothed fitted curves, are presented in Figure 2 and Supplementary Figure 4. Importantly, this analysis confirmed the primary findings: mild and moderate myopia reached refractive stability around age 14, whereas high myopia exhibited a significant deceleration change point at age 13 but continued to progress at a slower rate (Table 2 and Supplementary Figure 5). Furthermore, similar sex differences in these progression trajectories were observed (Supplementary Table 6 and Supplementary Figure 6).
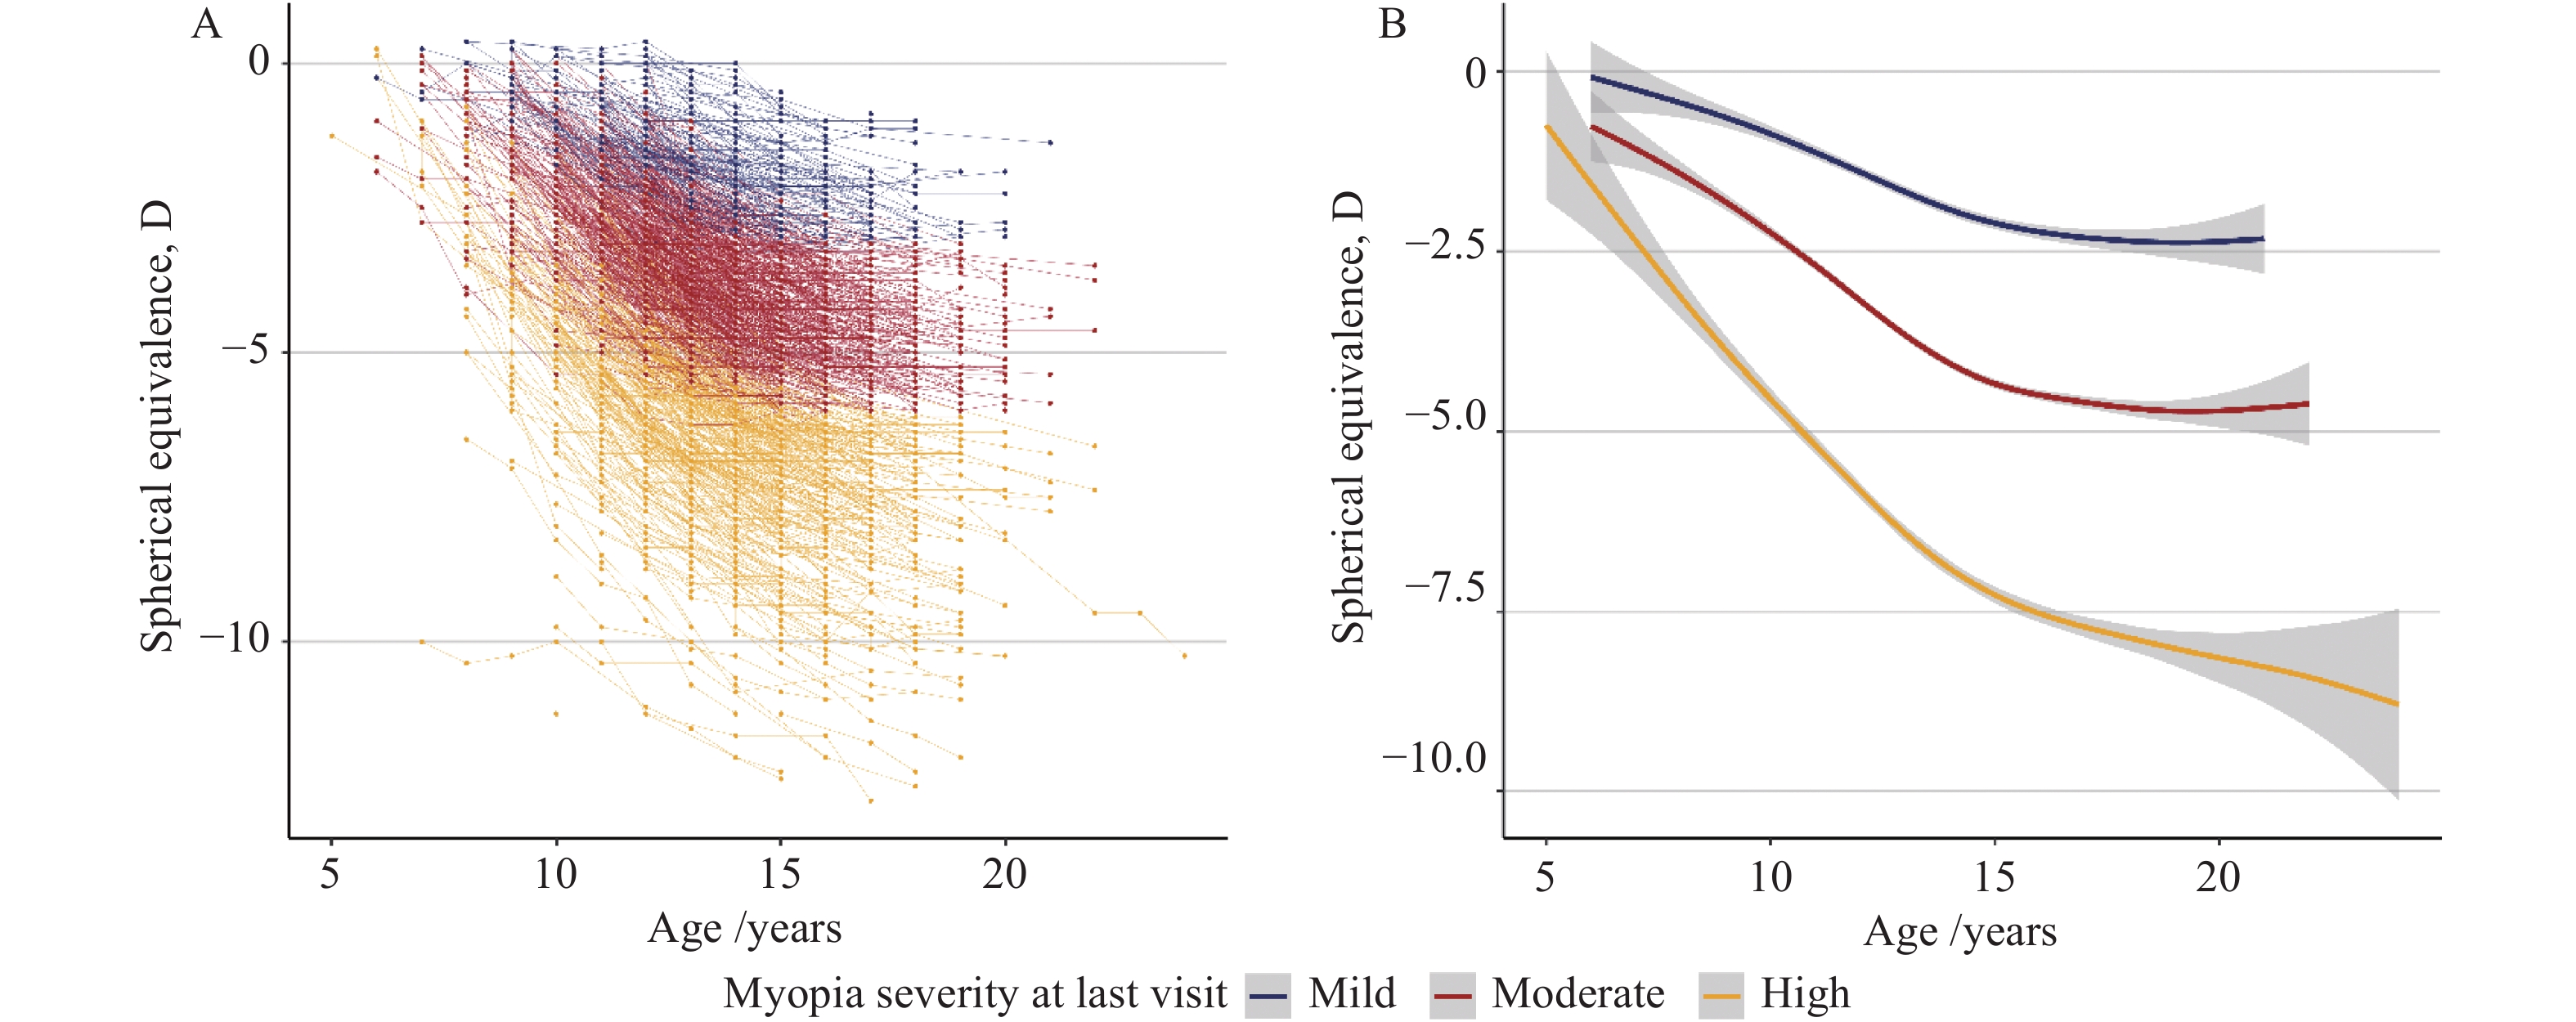
A: the individual trajectories in stabilized myopia patients stratified by myopia degree at last visit; B: the smoothed trajectories in stabilized myopia patients stratified by myopia severity at last visit; the grey area stood for 95% confidence interval.
|
Myopia severity |
β (95% CI) |
P value |
|
Mild |
|
|
|
Breakpoint (Std. Error) |
14 (1.28) |
|
|
Age < 14 |
−0.27 (−0.34, −0.20) |
<0.001 |
|
Age > 14 |
0.20 (0.13, 0.47) * |
0.018 |
|
Medium |
|
|
|
Breakpoint (Std. Error) |
14 (0.51) |
|
|
Age < 14 |
−0.41 (−0.48, −0.34) |
<0.001 |
|
Age > 14 |
0.34 (0.28, 0.40) * |
<0.001 |
|
High |
|
|
|
Breakpoint (Std. Error) |
13 (0.77) |
|
|
Age < 13 |
−0.70 (−0.80, −0.50) |
<0.001 |
|
Age > 13 |
0.54 (0.42, 0.68) * |
<0.001 |
|
* The value indicated the change of β compared to the β before breakpoint |
||
To further rule out the confounding effects of intensive myopia control interventions widely adopted after 2020, a historical sensitivity analysis was conducted on a sub-cohort of 889 children [mean baseline age: (11.1 ± 1.09) years; mean baseline SE: (−3.06 ± 1.83) D] whose visits occurred prior to 2020 (Supplementary Table 7). Based on their final refraction, 103, 501, and 285 children were classified into the mild, moderate, and high myopia groups, respectively. Piecewise linear regression within this historical cohort confirmed the robustness of our primary findings (Table 3 and Supplementary Figure 7). Mild and moderate myopia reached refractive stability at ages 16 and 15, yielding stable post-breakpoint progression rates of +0.06 D/year and −0.03 D/year, respectively. In contrast, high myopia exhibited a deceleration change point at age 13. Although its progression rate slowed significantly after this breakpoint (from −0.67 D/year to −0.28 D/year), high myopia did not achieve absolute stabilization, demonstrating a continuous, slow myopic shift into later adolescence.
|
Myopia severity |
β (95% CI) |
P value |
|
Mild |
|
|
|
Breakpoint (Std. Error) |
16 (1.02) |
|
|
Age < 16 |
−0.26 (−0.38, −0.23) |
<0.001 |
|
Age > 16 |
0.32 (0.15, 0.49) * |
<0.001 |
|
Medium |
|
|
|
Breakpoint (Std. Error) |
15 (0.26) |
|
|
Age < 15 |
−0.46 (−0.55, −0.44) |
<0.001 |
|
Age > 15 |
0.43 (0.34, 0.48) * |
<0.001 |
|
High |
|
|
|
Breakpoint (Std. Error) |
13 (0.77) |
|
|
Age < 13 |
−0.67 (−0.76, −0.50) |
<0.001 |
|
Age > 13 |
0.39 (0.28, 0.65) * |
<0.001 |
|
* The value indicated the change of β compared to the β before breakpoint |
||
Discussion
To our knowledge, this is the first comprehensive study to investigate myopia stabilization patterns in children across different myopia severities. Our findings indicate that the progression trajectory varies markedly by severity. Mild and moderate myopia tend to reach refractive stability between 14 to 15 years of age. In contrast, high myopia does not achieve complete stabilization during this period; rather, it exhibits a critical deceleration change point around age 14, after which it continues to progress at a slower, steady rate. The mean final SE at the point of stabilization or deceleration were −2.34 D, −4.57 D, and −7.61 D for the mild, moderate, and high myopia groups, respectively, which corrected closely with their baseline SE. These results provide a valuable clinical reference for managing pediatric myopia.
Previous studies have established a relatively consistent age range for myopia stabilization. Goss and Winkler[9] estimated a stabilization age of 14.4 years for girls and 15.0 years for boys based on 299 patients records. Thorn et al.[10] investigated 36 children and determined a stabilization age of 15.2 years. The COMET group used the Gompertz function to model myopia progression in a cohort of 426 ethnically diverse children, establishing a mean stabilization age of 15.61 years.[11] More recently, Qin et al.[12] evaluated a larger sample of Chinese school-aged children (n=773) wearing single-vision lenses. following them until age 16 and reporting an average stabilization age of 14.6 years. However, a notable limitation of these prior investigations was their reliance on non-cycloplegic refractions. Our study, the largest to date to use cycloplegic refraction, largely corroborates these findings, confirming that mild to moderate myopia tends to stabilize between 14 and 15 years of age.
Although it is well established that myopia progression patterns vary by severity, research on whether the age of stabilization differs among children with mild, moderate, or high myopia remains limited. Notably, Polling et al.[14] analyzed spectacle prescription records for 946 individuals and observed that while low myopes tend to stabilize in late adolescence, those with high myopia exhibit prolonged progression extending well into young adulthood. However, their findings were methodologically constrained by categorizing progression into broad age groups rather than analyzing continuous aged data, and relying on non-cycloplegic spectacle prescriptions. Addressing these limitations, our study employed strict cycloplegic refraction criteria and piecewise linear regression to mathematically quantify this trajectory. We identified a precise deceleration change point at approximately 14 years of age for the high myopia group. Importantly, our model confirms that after this inflection point, the progression of high myopia does not halt completely—unlike mild and moderate myopia, which show minimal refractive change after age 15—but rather transitions into a slow, steady progression phase of approximately −0.20D/year. We hypothesize that this persistent progression in high myopes is driven by ongoing biomechanical vulnerabilities of the sclera, which aligns with the findings of Zhang et al.[16] regarding varied AL trajectories in high myopes.
The observation that mild to moderate myopia stabilizes, and high myopia begins to decelerate, within a similar age window is likely attributable to the natural course of physiological axial elongation,[17–20] which typically slows and halts by late adolescence.[21-22] However, the precise regulatory mechanisms remain unclear. We also observed subtle sex differences in the age of stabilization, which likely reflects the influence of pubertal hormones on axial growth.[23] Hormonal changes during puberty, which correlate with somatic growth spurts, are known to affect axial elongation, and thereby influence the timing of myopia stabilization.[24] The exact roles of specific hormones in this process warrant further investigation.
To further validate whether these age-related milestones were confounded by intensive myopia control treatments widely adopted after 2020, we analyzed a historical sensitivity cohort restricted entirely to the pre-2020 era (Table 3). In this sub-cohort, where conventional single-vision spectacles were the predominant standard of care, the core biological windows of progression change remained remarkably consistent; mild and moderate myopia reached complete stabilization at ages 16 and 15, respectively, while high myopia exhibited an earlier deceleration change point at age 13. Notably, high myopes in this pre-2020 cohort displayed a faster residual progression rate after their change point compared to the primary cohort (−0.28 D/year vs. −0.20 D/year). This discrepancy suggests that while the biological timing of progression deceleration is a robust developmental milestone independent of modern treatments, contemporary myopia control modalities implemented after 2020 play a critical role in further flattening the residual progression slope during late adolescence, particularly in high myopes.
Our study has several strengths. First, it is the largest study to date to investigate myopia stabilization using cycloplegic refraction and the first to analyze stabilization patterns across different myopia severities. Second, we employed piecewise linear regression to accurately model longitudinal changes, enabling us to account for non-linear characteristics while maintaining the interpretability of linear models.[25-26] Finally, we conducted rigorous sensitivity analyses to strengthen the robustness of our findings. Clinically, these results enhance the understanding of myopia progression, allowing clinicians to better predict the final stabilized SE. This provides a valuable evidence base for personalizing the frequency of eye examinations and determining the optimal timing for interventions.
Several limitations should be acknowledged. First, there is currently no universally standardized method for defining myopia stabilization. Although the methodology employed in this study was developed based on existing literature and provides a practical approach for identifying stabilized cases, which was further reinforced by sensitivity analyses applying even more rigorous criteria, it remains an approximation. Second, detailed data on specific myopia control treatments were unavailable. Although our historical pre-2020 sensitivity analysis demonstrated that the primary timeline of progression deceleration is biologically robust and independent of modern treatments, future prospective studies with granular treatment tracking are warranted to precisely delineate the long-term impacts of specific intervention on adult stabilization. Third, this study carries a risk of selection bias. Because our inclusion criteria required confirmed myopia stabilization within the follow-up period, our findings primarily describe the age of stabilization for children who reach stability in their mid-teens, which may not be generalizable to individuals with high-progression phenotypes who stabilize much later in life. Fourth, this study focused exclusively on a Chinese population, which may limit the generalizability of our findings to other ethnic groups. Fifth, the specific type of cycloplegic agent was not recorded in the EMR. While compound tropicamide was likely used in most cases per clinical routine, the potential unrecorded use of atropine in a minority of visits could have introduced bias.
In conclusion, the progression trajectories of pediatric myopia differ markedly by severity. Mild and moderate myopia tend to achieve complete refractive stability around 14 to 15 years of age. In contrast, high myopia experiences a critical deceleration change point at a similar age but remains susceptible to ongoing, slow progression. These distinct patterns highlight the necessity for continuous monitoring and management of high myopes well beyond mid-adolescence.
Correction notice
None
Acknowledgements
None
Author contributions
(I) Conception and design: Liangjia Zeng, Xiaotong Han
(II) Administrative support: Xuhua Tan, Xiaotong Han
(III) Provision of study materials or patients: Xuhua Tan, Xiaotong Han
(IV) Collection and assembly of data: Xiaotong Han
(V) Data analysis and interpretation: Liangjia Zeng, Wenlu Yu
(VI) Manuscript writing: All authors
(VII) Final approval of manuscript: All authors
Conflict of interests
The authors declare that they have no conflicts of interest. All authors have completed the ICMJE uniform disclosure form.
Patient consent for publication
None
Ethics approval and consent to participate
None
Data availability statement
None
Open access
This is an Open Access article distributed in accordance with the Creative Commons Attribution NonCommercial-NoDerivs 4.0 International License(CC BY-NC-ND 4.0), which permits the non-commercial replication and distribution of the article with the strict proviso that no changes or edits are made and the original work is properly cited(including links to both the formal publication through the relevant DOI and the license).
Declaration of generative AI use
No generative artificial intelligence (GenAI) tools were used in the preparation of this manuscript.
Supplementary materials
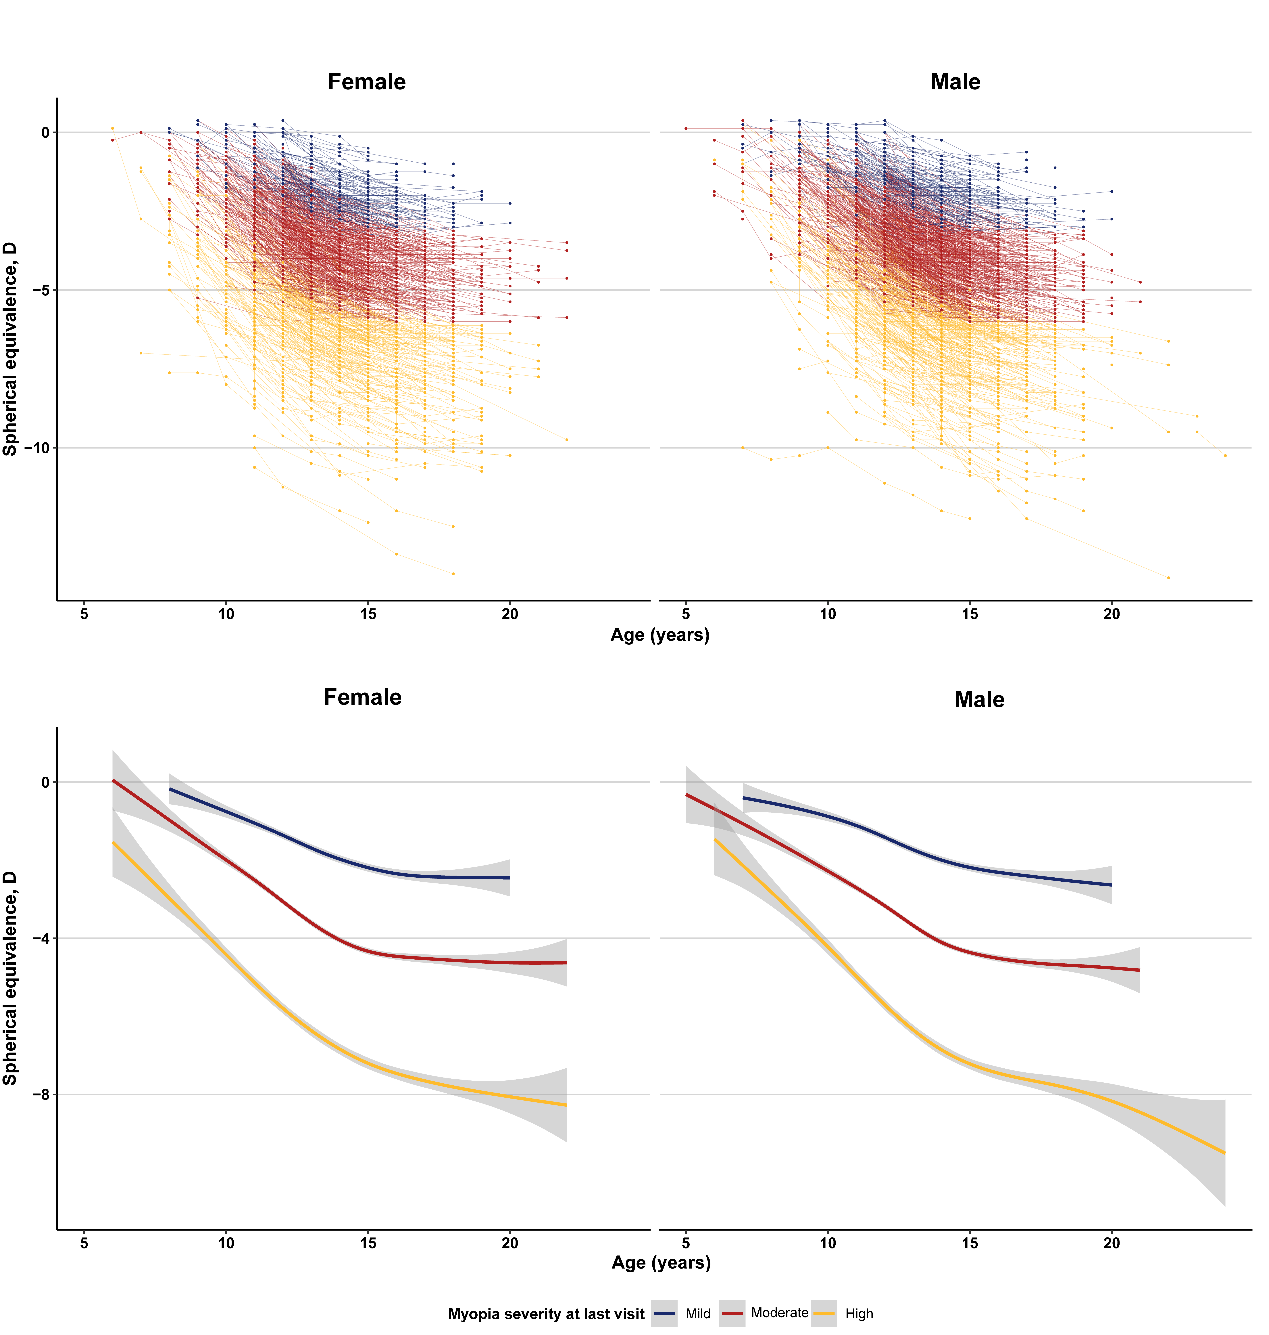
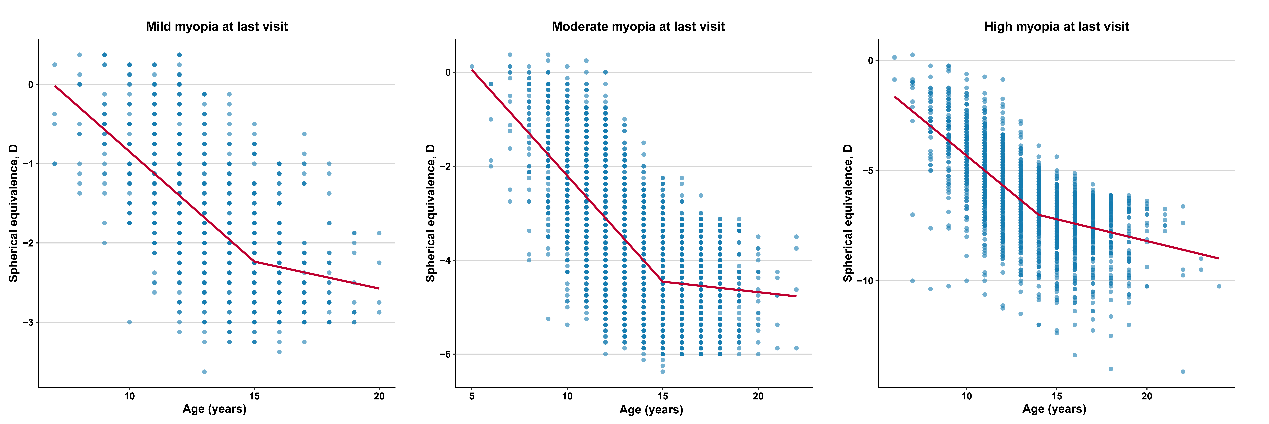
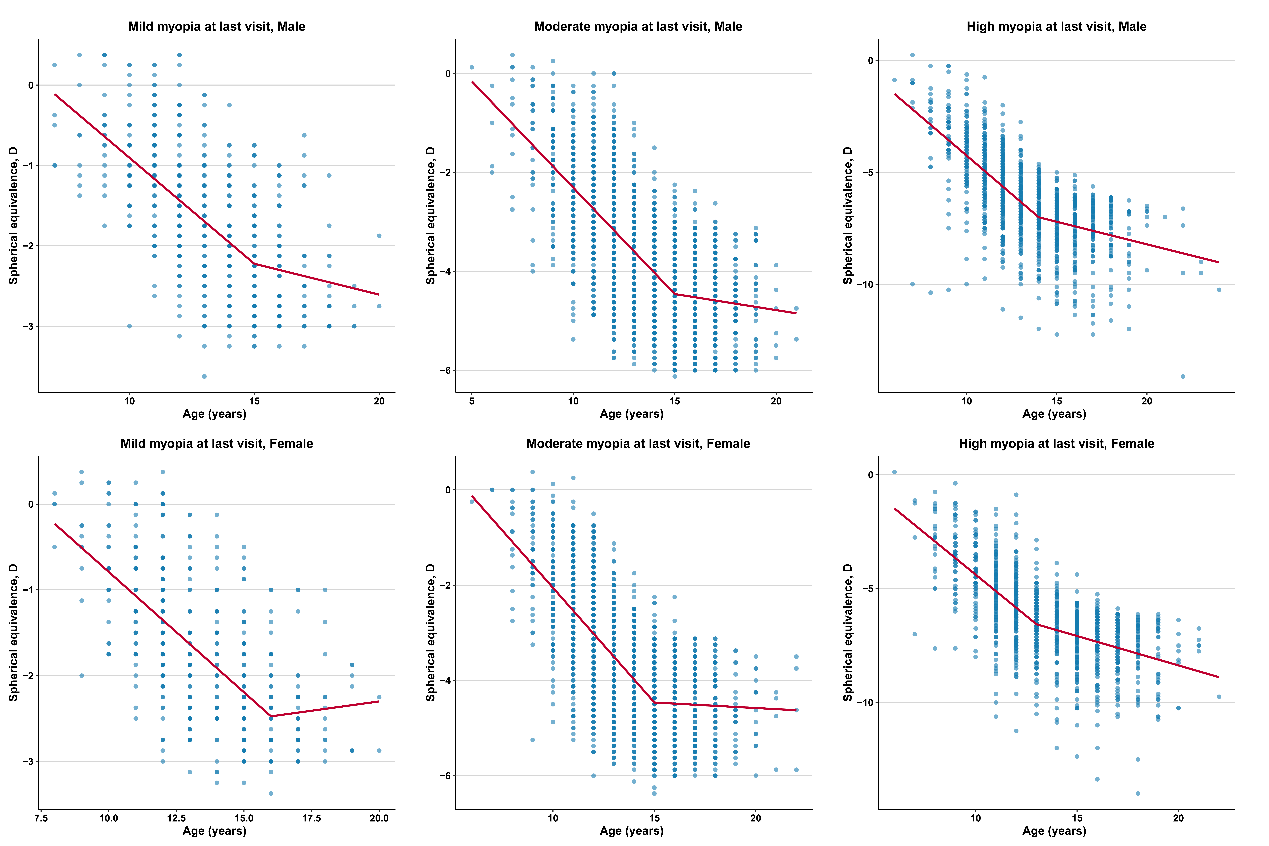
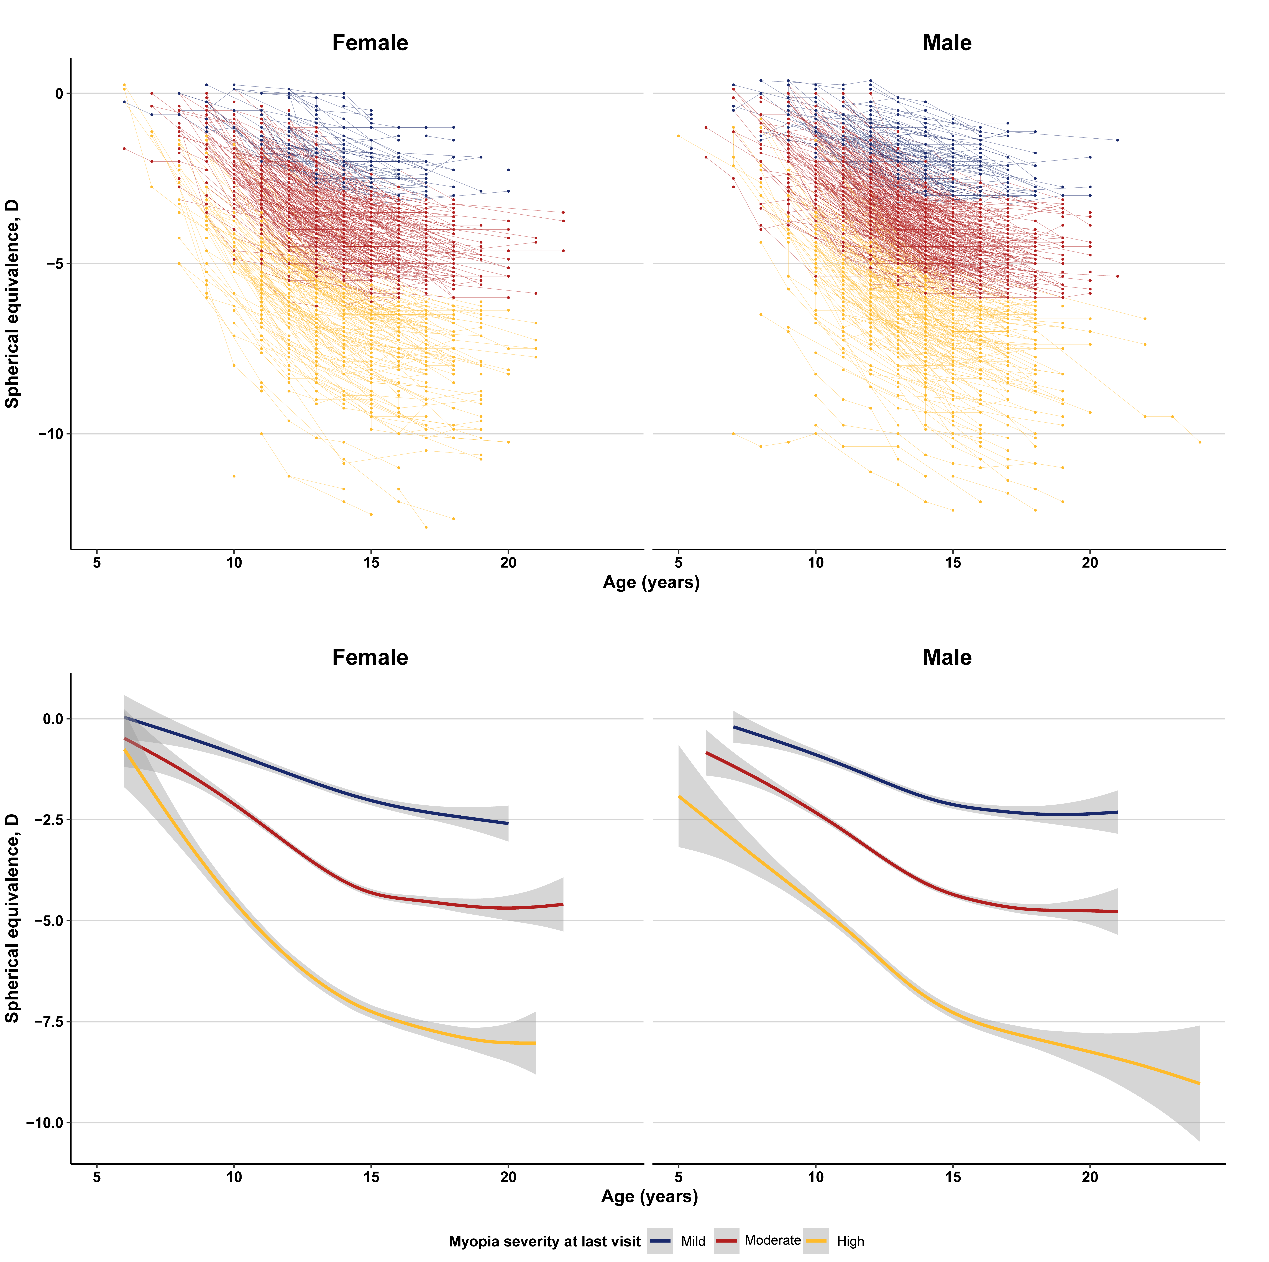
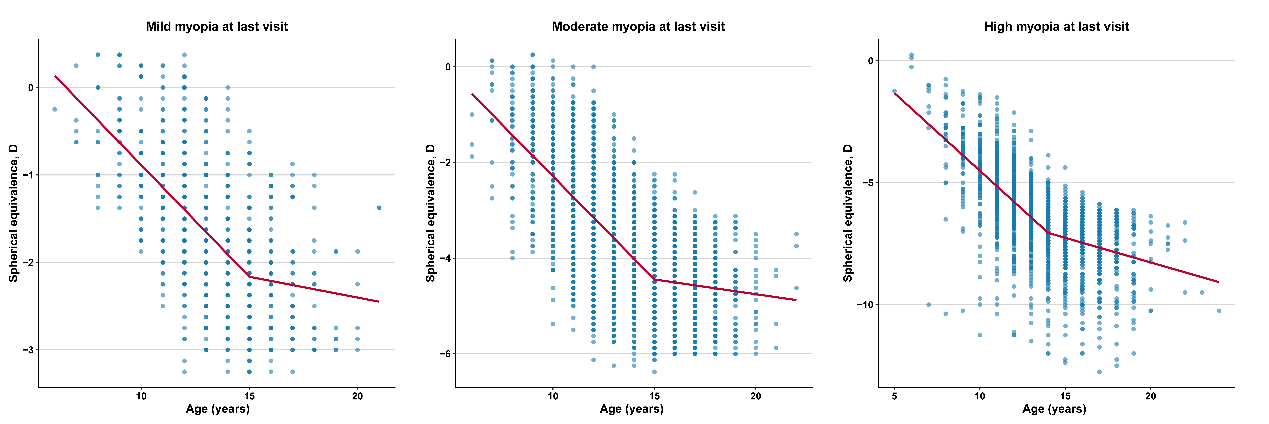
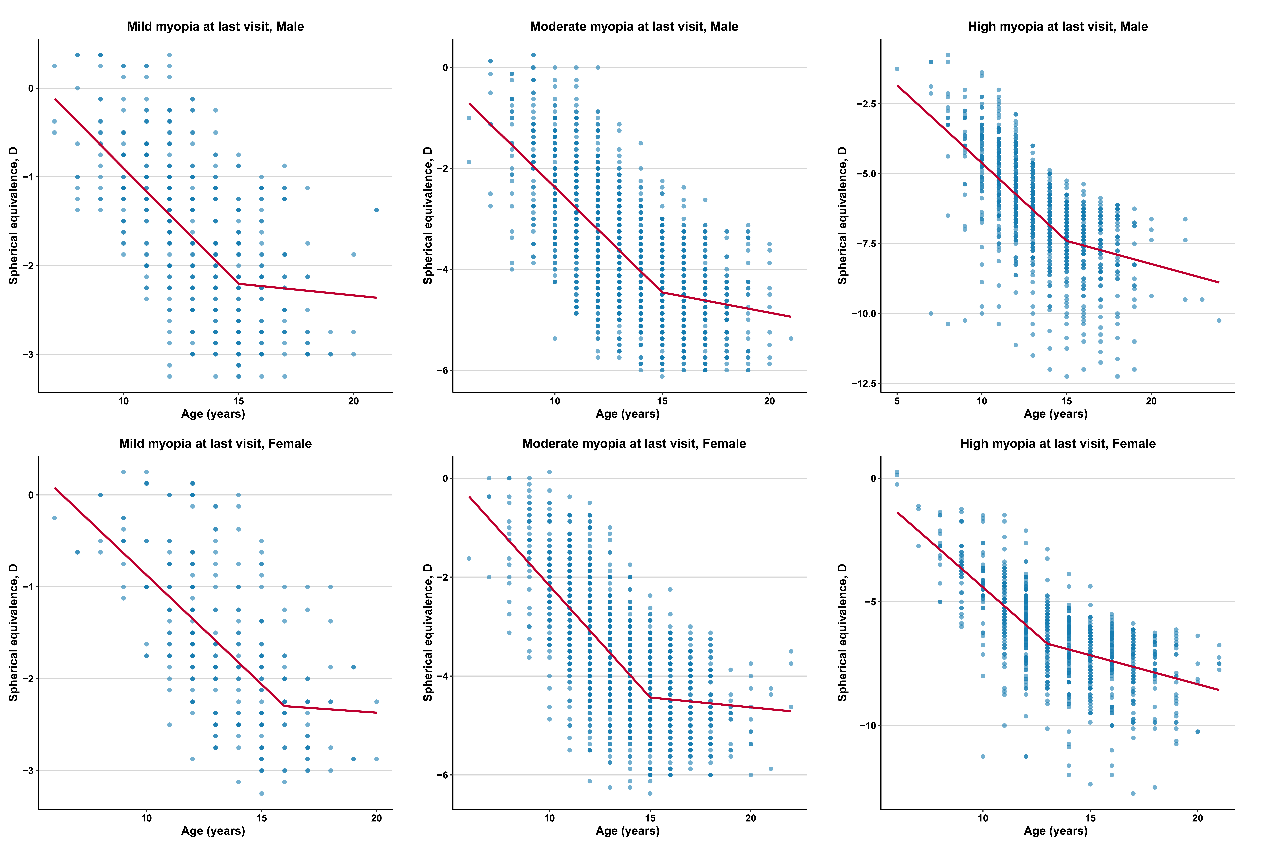
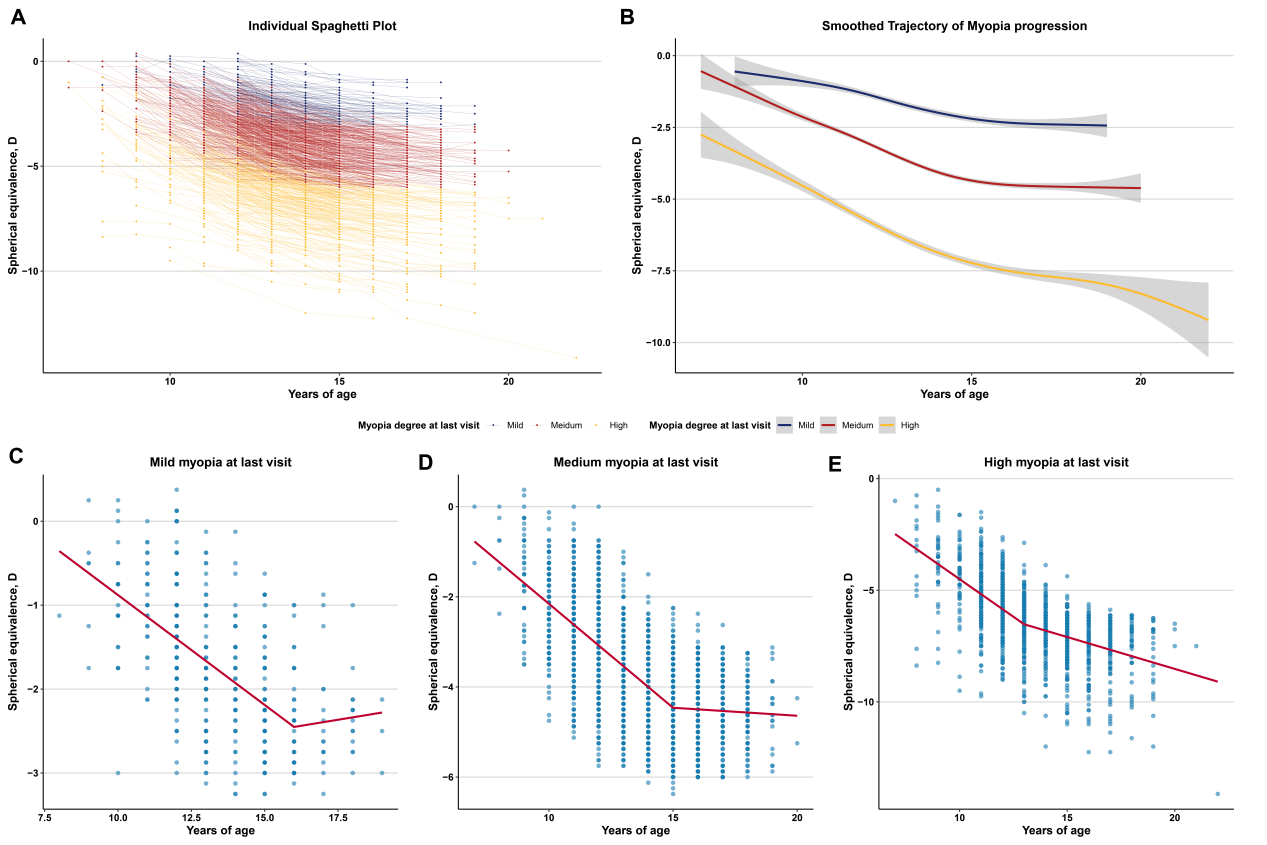
Individual trajectories (A) and smoothed trajectories (B) stratified by myopia severity; Piece-wise linear regression plot in mild (C), medium(D) and high myopia(E).
|
Characteristic |
Mild (-0.5~-3D) |
Moderate (-3D~-6D) |
High (≤-6D) |
Overall |
P value |
|
Sex |
|
|
|
|
0.692 |
|
Female |
132 (49.6%) |
475 (47.0%) |
247 (46.5%) |
854 (47.3%) |
|
|
Male |
134 (50.4%) |
535 (53.0%) |
284 (53.5%) |
953 (52.7%) |
|
|
Baseline age, year |
|
|
|
|
0.001 |
|
Mean (SD) |
11.0 (1.20) |
10.9 (1.22) |
10.7 (1.34) |
10.9 (1.26) |
|
|
Median [Q1, Q3] |
11.0 [10.0, 12.0] |
11.0 [10.0, 12.0] |
11.0 [10.0, 12.0] |
11.0 [10.0, 12.0] |
|
|
Age at last visit, year |
|
|
|
|
<0.001 |
|
Mean (SD) |
16.2 (1.24) |
16.4 (1.39) |
16.8 (1.56) |
16.5 (1.44) |
|
|
Median [Q1, Q3] |
16.0 [15.0, 17.0] |
16.0 [15.0, 17.0] |
17.0 [16.0, 18.0] |
16.0 [15.0, 17.0] |
|
|
Initial SE, D |
|
|
|
|
<0.001 |
|
Mean (SD) |
-0.978 (0.688) |
-2.35 (1.12) |
-4.53 (1.76) |
-2.79 (1.78) |
|
|
Median [Q1, Q3] |
-1.00 [-1.50, -0.50] |
-2.25 [-3.13, -1.50] |
-4.50 [-5.5, -3.5] |
-2.50 [-3.88, -1.5] |
|
|
Final SE, D |
|
|
|
|
<0.001 |
|
Mean (SD) |
-2.34 (0.612) |
-4.57 (0.816) |
-7.61 (1.33) |
-5.14 (2.02) |
|
|
Median [Q1, Q3] |
-2.50 [-2.88, -2.00] |
-4.63 [-5.25, -3.88] |
-7.25 [-8.25, -6.63] |
-4.88 [-6.38, -3.75] |
|
|
n of visit |
|
|
|
|
<0.001 |
|
n < 6 |
231 (86.8%) |
841 (83.3%) |
404 (76.1%) |
1476 (81.7%) |
|
|
n ≥ 6 |
35 (13.2%) |
169 (16.7%) |
127 (23.9%) |
331 (18.3%) |
|
|
Follow-up period, year |
|
|
|
|
<0.001 |
|
Mean (SD) |
5.08 (1.58) |
5.43 (1.64) |
6.11 (1.76) |
5.58 (1.71) |
|
|
Median [Q1, Q3] |
4.89 [3.96, 6.02] |
5.28 [4.09, 6.50] |
5.99 [4.82, 7.31] |
5.45 [4.20, 6.79] |
|
|
Abbreviation: SE, spherical equivalence; SD, standard deviation. |
|||||
|
Characteristic |
Mild |
Medium |
High |
|
Overall |
-2.34 (0.612) |
-4.57 (0.816) |
-7.61 (1.33) |
|
Sex |
|
|
|
|
Male |
-2.33 (0.611) |
-4.59 (0.822) |
-7.59 (1.32) |
|
Female |
-2.35 (0.616) |
-4.54 (0.810) |
-7.64 (1.33) |
|
P value* |
0.837 |
0.374 |
0.629 |
|
Initial myopia degree |
|
|
|
|
Non-myopia |
-1.81 (0.722) |
-4.42 (0.878) |
-6.80 (0.979) |
|
Mild |
-2.50 (0.475) |
-4.35 (0.771) |
-7.11 (0.908) |
|
Medium |
NA |
-5.21 (0.550) |
-7.33 (1.04) |
|
High |
NA |
NA |
-9.14 (1.50) |
|
P value* |
<0.001 |
<0.001 |
<0.001 |
|
The values in box were mean final spherical equivalence (D) with standard deviation in the brackets; *P value yielded by analysis of variance |
|||
|
Myopia severity |
β (95% CI) |
P value |
|
Mild, male |
|
|
|
Breakpoint (Std. Error) |
15 (0.77) |
|
|
Age < 15 |
-0.26 (-0.31, -0.23) |
<0.001 |
|
Age > 15 |
0.19 (0.1, 0.3) * |
<0.001 |
|
Mild, female |
|
|
|
Breakpoint (Std. Error) |
16 (0.77) |
|
|
Age < 16 |
-0.28 (-0.4, -0.26) |
<0.001 |
|
Age > 16 |
0.32 (0.19, 0.43) * |
<0.001 |
|
Medium, male |
|
|
|
Breakpoint (Std. Error) |
15 (0.26) |
|
|
Age < 15 |
-0.43 (-0.49, -0.41) |
<0.001 |
|
Age > 15 |
0.37 (0.29, 0.42) * |
<0.001 |
|
Medium, female |
|
|
|
Breakpoint (Std. Error) |
15 (0.26) |
|
|
Age < 15 |
-0.48 (-0.57, -0.46) |
<0.001 |
|
Age > 15 |
0.46 (0.4, 0.51) * |
<0.001 |
|
High, male |
|
|
|
Breakpoint (Std. Error) |
14 (0.51) |
|
|
Age < 14 |
-0.69 (-0.84, -0.6) |
<0.001 |
|
Age > 14 |
0.49 (0.37, 0.62) * |
<0.001 |
|
High, female |
|
|
|
Breakpoint (Std. Error) |
13 (0.51) |
|
|
Age < 13 |
-0.73 (-0.81, -0.56) |
<0.001 |
|
Age > 13 |
0.47 (0.37, 0.6) * |
<0.001 |
|
* The value indicated the change of β compared to the β before breakpoint |
||
|
Characteristic |
Mild (-0.5~-3D) |
Moderate (-3D~-6D) |
High (<=-6D) |
Overall |
P value |
|
Sex |
|
|
|
|
0.203 |
|
Female |
58 (38.2%) |
264 (44.7%) |
159 (46.8%) |
481 (44.4%) |
|
|
Male |
94 (61.8%) |
327 (55.3%) |
181 (53.2%) |
602 (55.6%) |
|
|
Baseline age |
|
|
|
|
0.475 |
|
Mean (SD) |
10.6 (1.38) |
10.7 (1.32) |
10.6 (1.39) |
10.7 (1.35) |
|
|
Median [Q1, Q3] |
11.0 [10.0, 12.0] |
11.0 [10.0, 12.0] |
11.0 [10.0, 12.0] |
11.0 [10.0, 12.0] |
|
|
Age at last visit |
|
|
|
|
<0.001 |
|
Mean (SD) |
16.4 (1.40) |
16.7 (1.43) |
17.1 (1.52) |
16.8 (1.47) |
|
|
Median [Q1, Q3] |
16.0 [15.0, 17.0] |
16.0 [16.0, 18.0] |
17.0 [16.0, 18.0] |
17.0 [16.0, 18.0] |
|
|
Initial SE (right), D |
|
|
|
|
<0.001 |
|
Mean (SD) |
-0.869 (0.658) |
-2.28 (1.11) |
-4.51 (1.72) |
-2.78 (1.80) |
|
|
Median [Q1, Q3] |
-0.938 [-1.25, -0.469] |
-2.25 [-3.00, -1.50] |
-4.50 [-5.50, -3.50] |
-2.63 [-3.88, -1.38] |
|
|
Final SE (right), D |
|
|
|
|
<0.001 |
|
Mean (SD) |
-2.29 (0.632) |
-4.63 (0.787) |
-7.73 (1.33) |
-5.27 (2.08) |
|
|
Median [Q1, Q3] |
-2.38 [-2.75, -1.88] |
-4.75 [-5.25, -4.00] |
-7.50 [-8.25, -6.75] |
-5.00 [-6.63, -3.88] |
|
|
N of visit |
|
|
|
|
0.012 |
|
N < 6 |
110 (72.4%) |
413 (69.9%) |
209 (61.5%) |
732 (67.6%) |
|
|
N >= 6 |
42 (27.6%) |
178 (30.1%) |
131 (38.5%) |
351 (32.4%) |
|
|
Length of follow-up (year) |
|
|
|
|
<0.001 |
|
Mean (SD) |
5.66 (1.62) |
5.95 (1.61) |
6.47 (1.60) |
6.08 (1.63) |
|
|
Median [Q1, Q3] |
5.52 [4.43, 5.52] |
5.90 [4.74, 7.01] |
6.44 [5.32, 7.53] |
5.98 [4.92, 7.09] |
|
|
Abbreviation: SE, spherical equivalence; SD, standard deviation. |
|||||
|
Characteristic |
Mild |
Medium |
High |
|
Overall |
-2.29 (0.632) |
-4.63 (0.787) |
-7.73 (1.33) |
|
Sex |
|
|
|
|
Male |
-2.30 (0.608) |
-4.66 (0.794) |
-7.73 (1.34) |
|
Female |
-2.27 (0.674) |
-4.59 (0.779) |
-7.72 (1.32) |
|
P value* |
0.829 |
0.303 |
0.942 |
|
Initial myopia degree |
|
|
|
|
Non-myopia |
-1.80 (0.737) |
-4.27 (0.757) |
-8.58 (0.629) |
|
Mild |
-2.45 (0.500) |
-4.47 (0.768) |
-7.13 (0.856) |
|
Medium |
NA |
-5.18 (0.565) |
-7.43 (1.05) |
|
High |
NA |
NA |
-9.40 (1.41) |
|
P value* |
<0.001 |
<0.001 |
<0.001 |
|
The values in box were mean final spherical equivalence (D) with standard deviation in the brackets; *P value yielded by analysis of variance |
|||
|
|
β (95% CI) |
P value |
|
Mild, male |
|
|
|
Breakpoint (Std. Error) |
15 (1.02) |
|
|
Age < 15 |
-0.26 (-0.31, -0.23) |
<0.001 |
|
Age > 15 |
0.23 (0.14, 0.37) * |
0.026 |
|
Mild, female |
|
|
|
Breakpoint (Std. Error) |
16 (1.02) |
|
|
Age < 16 |
-0.24 (-0.32, -0.21) |
0.027 |
|
Age > 16 |
0.22 (0.10, 0.49) * |
0.112 |
|
Medium, male |
|
|
|
Breakpoint (Std. Error) |
15 (0.26) |
|
|
Age < 15 |
-0.42 (-0.48, -0.39) |
<0.001 |
|
Age > 15 |
0.34 (0.26, 0.40) * |
<0.001 |
|
Medium, female |
|
|
|
Breakpoint (Std. Error) |
15 (0.26) |
|
|
Age < 15 |
-0.45 (-0.53, -0.43) |
<0.001 |
|
Age > 15 |
0.41 (0.35, 0.48) * |
<0.001 |
|
High, male |
|
|
|
Breakpoint (Std. Error) |
15 (0.77) |
|
|
Age < 15 |
-0.56 (-0.68, -0.49) |
<0.001 |
|
Age > 15 |
0.51 (0.38, 0.91) * |
<0.001 |
|
High, female |
|
|
|
Breakpoint (Std. Error) |
13 (1.02) |
|
|
Age < 13 |
-0.76 (-1.04, -0.61) |
<0.001 |
|
Age > 13 |
0.53 (0.42, 0.71) * |
<0.001 |
|
* The value indicated the change of β compared to the β before breakpoint |
||
|
Characteristic |
Mild (-0.5~-3D) |
Moderate (-3D~-6D) |
High (<=-6D) |
Overall |
P value |
|
Sex |
|
|
|
|
0.293 |
|
Female |
54 (52.4%) |
221 (44.1%) |
127 (44.6%) |
402 (45.2%) |
|
|
Male |
49 (47.6%) |
280 (55.9%) |
158 (55.4%) |
487 (54.8%) |
|
|
Baseline age |
|
|
|
|
0.011 |
|
Mean (SD) |
11.3 (0.960) |
11.1 (1.05) |
11.0 (1.19) |
11.1 (1.09) |
|
|
Median [Q1, Q3] |
12.0 [8.00, 12.0] |
11.0 [7.00, 12.0] |
11.0 [7.00, 12.0] |
11.0 [7.00, 12.0] |
|
|
Age at last visit |
|
|
|
|
0.014 |
|
Mean (SD) |
16.1 (1.16) |
16.3 (1.19) |
16.5 (1.38) |
16.3 (1.26) |
|
|
Median [Q1, Q3] |
16.0 [15.0, 19.0] |
16.0 [15.0, 20.0] |
16.0 [15.0, 22.0] |
16.0 [15.0, 22.0] |
|
|
Initial SE (right), D |
|
|
|
|
<0.001 |
|
Mean (SD) |
-1.05 (0.689) |
-2.44 (1.09) |
-4.89 (1.65) |
-3.06 (1.83) |
|
|
Median [Q1, Q3] |
-1.13 [-3.00, 0.375] |
-2.38 [-5.13, 0.375] |
-4.88 [-9.63, -0.500] |
-2.75 [-9.63, 0.375] |
|
|
Final SE (right), D |
|
|
|
|
<0.001 |
|
Mean (SD) |
-2.36 (0.584) |
-4.55 (0.841) |
-7.56 (1.32) |
-5.26 (1.99) |
|
|
Median [Q1, Q3] |
-2.50 [-3.00, -0.625] |
-4.63 [-6.00, -3.13] |
-7.25 [-14.1, -6.13] |
-5.00 [-14.1, -0.625] |
|
|
n of visit |
|
|
|
|
0.357 |
|
n < 6 |
91 (88.3%) |
434 (86.6%) |
238 (83.5%) |
763 (85.8%) |
|
|
n >= 6 |
12 (11.7%) |
67 (13.4%) |
47 (16.5%) |
126 (14.2%) |
|
|
Length of follow-up (year) |
|
|
|
|
<0.001 |
|
Mean (SD) |
4.71 (1.21) |
5.18 (1.28) |
5.53 (1.37) |
5.23 (1.32) |
|
|
Median [Q1, Q3] |
4.60 [2.22, 7.95] |
5.20 [2.42, 9.44] |
5.57 [2.46, 10.1] |
5.33 [2.22, 10.1] |
|
|
Abbreviation: SE, spherical equivalence; SD, standard deviation; N, number |
|||||