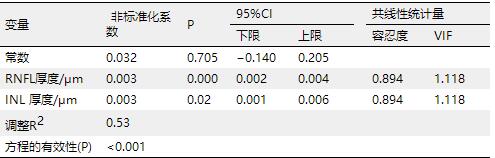
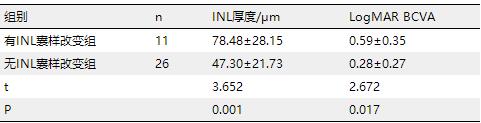
Objective: To investigate the morphological changes detected by spectral domain optical coherence tomography (OCT) and their relevance to vision in patients with idiopathic macular epiretinal membranes (IMEM). Methods: This is a retrospective study. OCT recorded 37 eyes with stage 3 and below IMEM according to the 4-level grading system based on OCT images among 35 patients. We managed to obtain thickness of all retina layers in three concentric circular regions with a diameter of 1 mm, 3 mm and 6 mm across macular fovea with the help of a third-party software. Plus we divided all 37 eyes into two groups according to whether there were cystic changes in the inner nuclear layer (INL). Multiple linear regression analyses were performed between thickness of all retina layers and current minimum resolution angle in logarithmic (logMAR) best corrected visual acuity (BCVA). The difference of BCVA between groups with cystic changes and without was also compared. Thus, the relationships between visual acuity and thickness of retina layers, cystic changes in INL were analyzed. Results: Multiple linear regression analyses revealed that thickness of both retina nerve fiber layer (RNFL) and inner nuclear layer have positive correlation with logMAR BCVA in the region with a diameter of 1 mm (P<0.05), while in regions of a diameter of 3 mm and 6 mm, only INL thickness remained positively relevant (all P<0.05). There were significant differences in BCVA and thickness of INL between groups with INL cystic changes and without (all P<0.05). Conclusion: Current visual acuity among preoperative IMEM patients was mostly associated with thickness of RNFL and INL. Cystic change in INL layer may be a good indicator of INL thickening and was visually correlated. Those with this change tend to have worse vision.
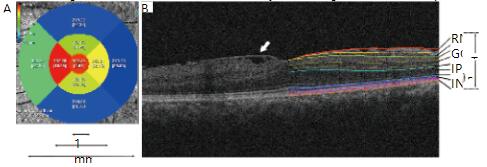
图1 分区及视网膜分层示意图 Figure 1 Image of regions dividing and retina segmenting (A) Iowa Reference Algorithm将OCT采集的区域自动分成9个亚分区并测量每个分区的平均厚度值。这9个分区同时构成了3个直径分别为1、3、6 mm的同心圆区域。(B)1例前膜患者黄斑区OCT图像及视网膜分层示意图。左半部分可以看到视网膜表面的前膜组织(白色箭头)。右半部分为同一只眼经软件自动分层后的各视网膜层次。IS/OS:光感受器的内节/外节交界处;OS:外节;RPE:色素细胞层。(A) The Iowa Reference Algorithm automatically divided the area obtained by OCT into nine subfields and measured the mean thickness of each subfield. These nine subfields also constituted three
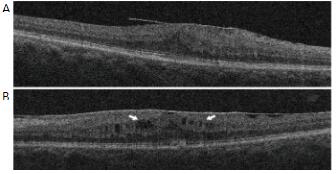
图2 INL层无囊样改变(A)及存在囊样改变(B)的黄斑前膜患者OCT图像,中心凹处INL层存在多个低信号的囊样改变区域(B;白色箭头) Figure 2 OCT image of a IMEM patient without INL cysitc changes (A) and a IMEM patient with INL cysitc changes (B), there were many low signal cysitc areas (B; white arrows)
1.3 观察指标
1)BCVA,采用国际标准视力表检测所有观察眼的矫正视力,并转换为最小分辨角的对数值(minimum resolution angle in logarithmic,logMAR)以方便统计分析。2)测量并分析在3个不同直径区域内RNFL、GCL、内丛状层 (inner plexiform layer,IPL)、INL、OPL、ONL、光感受器层(photoreceptor,PR)的平均厚度。3)观察是否存在INL囊样改变,将37只眼分为有INL囊样改变组及非INL囊样改变组。
表1 直径1 mm区域内logMAR BCVA与视网膜各层厚度的多元线性回归分析 Table 1 Multiple linear regression analysis of the correlation between logMAR BCVA and thickness of retinal layers in the region of a diameter of 1 mm
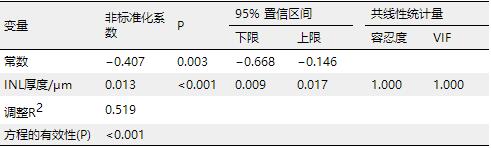
表2 直径3 mm区域内logMAR BCVA与视网膜各层厚度的多元线性回归分析 Table 2 Multiple linear regression analysis of the correlation between logMAR BCVA and thickness of retinal layers in the region of a diameter of 3 mm
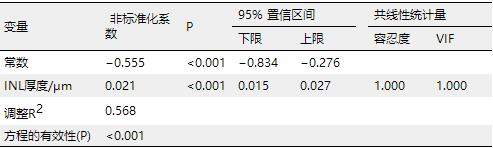
表3 直径6 mm区域内logMAR BCVA与视网膜各层厚度的多元线性回归分析 Table 3 Multiple linear regression analysis of the correlation between logMAR BCVA and thickness of retinal layers in the region of a diameter of 6 mm