HIGHLIGHTS
• There is considerable scope for improving the lifestyle of primary school students in urban areas of Fujian, and lifestyle is strongly associated with myopia onset.
• Adopting AUC to quantify predictive performance of lifestyle factors and demonstrate the association between lifestyle and myopia onset.
• Targeted interventions: Prioritize students with myopic parents (especially biparental myopia) for early screening and structured outdoor programs.
• School policy reforms: Advocate for extended outdoor recess and mandatory daily outdoor time (≥2 hours) to align with national guidelines.
• Conducting longitudinal studies with wearable devices to objectively and precisely measure lifestyle factors to assess the effect of lifestyle on myopia development and progression.
INTRODUCTION
Myopia has become a significant global public health issue. In 2016, Holden projected that the global prevalence of myopia would reach around 50% by 2050.[1] In 2018, the World Health Organization reported that about 600 million people in China, nearly half the population, had myopia, with the highest rate of myopia among adolescents worldwide. A nationwide survey in 2018 revealed that the overall myopia rate among Chinese children and adolescents was 53.6%.[2] Myopia in this population has been highly prevalent and occurred earlier and progressed rapidly. It not only impacts their academic performance and daily lives but also poses challenges to the sustainable development of China. Therefore, it has been both crucial and urgent to take myopia prevention and control measures.
Previous studies have indicated that lifestyle-related factors, including time outdoor, outdoor activities during class recess, near work, and sleep duration, may influence the onset and progression of myopia in children and adolescents. [3-14] In August 2018, the Ministry of Education and other seven national departments jointly released the "Implementation Plan for Comprehensive Prevention and Control of Myopia in Children and Adolescents (PLAN)", outlining key measures for myopia prevention and control in the new era. These measures required that schools and families take action regarding students’ lifestyle. Specifically, schools should limit daily written homework for students in grades 3-6 to no more than 60 minutes, ensure that primary and secondary school students engage in more than one hour of physical activities each school day, and organize and encourage students to go outdoors or look into the distance during class breaks. Families, on the other hand, should ensure that children spend more than 60 minutes a day outside in natural light, limit non-educational electronic device use to under 1 hour per day, and guarantee 10 hours of sleep daily for primary school students [15]. The epidemiology data displayed that the overall myopia rate among children and adolescents in China was 52.7% in 2020 [2], 52.6% in 2021, and 51.9% in 2022, reflecting a downward trend and positive outcomes in myopia prevention and control efforts [16]. However, challenges remain. Fujian Province exhibited a significantly higher myopia rate. In 2020, the overall myopia rate among children and adolescents in Fujian was 66.7%, with 68.2% in urban areas and 51.1% among primary school students. [17] Fujian has prioritized myopia prevention and control in recent years. However, after years of intervention, the lifestyle patterns of urban students remain poorly understood, and their impact on myopia lacks systematic research. This cross-sectional study investigates lifestyle and myopia among urban primary school students in Fujian, aiming to explore current lifestyles of students in the context of myopia prevention and control and their influence on myopia. The findings will provide scientific evidence for identifying key target populations and formulate effective prevention measures.
MATERIALS AND METHODS
Participants
From October to November 2023, a questionnaire survey and myopia screening were conducted on fourth-grade students from three primary schools in the cities of Quanzhou, Sanming, and Ningde in Fujian Province using a random sampling method. The study adhered to the relevant principles outlined in the Declaration of Helsinki and was approved by the Ethics Committee of Sun Yat-sen University Zhongshan Ophthalmic Center (04161326). Informed consent was obtained from both the students and their guardians prior to the survey and vision test.
Vision Examination
Vision examinations were conducted in accordance with the "Guidelines for Screening of Refractive Errors in Primary and Secondary School Students" (WS/T 663-2020)[18]. The examinations included uncorrected and corrected distance visual acuity tests, autorefractive evaluation, and identification of major eye diseases. The distance visual acuity test was carried out at a distance of 5 meters with Chinese standard logarithmic visual acuity E chart. Subsequently, non-cycloplegic autorefractive evaluation was performed to measure spherical and cylindrical diopters using a handheld vision screening device (SL-100, New Horizon). Each eye was measured three times, with the average taken and recorded to 2 decimal places. A student was defined as having screening myopia if their uncorrected distance visual acuity was <5.0 and the effective spherical equivalent (calculated as sphere + cylinder /2) was ≤ -0.5D in at least one eye[18]. Additionally, students wearing orthokeratology lenses were directly classified as having myopia without undergoing autorefractive evaluation.
Questionnaire Survey
Based on the prevention and control measures outlined in the PLAN and references related to myopia risk factors [3-14], a questionnaire was designed. The questionnaire consisted of personal basic information, including sex, age, paternal myopia, and maternal myopia; as well as lifestyle factors such as place of activity during class recess, average daily time spent on outdoor activities on weekdays, average daily time spent on outdoor activities during weekends and holidays, average daily screen time, average daily study time after school, and daily sleep duration. Before the vision examination, the questionnaire was completed online by students with the assistance of their parents using the "Sojump" platform. The average daily time spent on outdoor activities was calculated using the formula: (average daily time spent outdoor activity on weekdays * 5 + average daily time spent outdoor activities during holidays and weekends * 2) / 7.
Quality control
This survey is part of the "China Urban Eye Health Index Project" led by Zhongshan Ophthalmic Center, Sun Yat-sen University. Prior to the survey, ophthalmology graduate students who had received standardized training from the center explained the objectives and significance of the study, as well as provided instructions for filling out the questionnaire. The questionnaire was administered via the "Sojump" platform. During the completion process, students and their parents were guided as needed. After the questionnaire was filled out, vision examinations were performed by professional ophthalmologists from the center. All results were promptly uploaded to an electronic information platform after the examination to ensure the authenticity and accuracy of the data.
Statistical analysis
Data analysis was conducted using the statistical software R 4.1.1 (R Foundation for Statistical Computing, Vienna, Austria). Students who completed both the questionnaire and vision tests were included in the analysis. The characteristics of the students were described as follows: mean ± standard deviation (Mean ± SD) for continuous variables, after normality was confirmed with Kolmogorov-Smirnov test; and frequency (percentage) for categorical variables. Differences between myopic and non-myopic student groups were compared using t-tests for continuous variables and chi-square tests for categorical variables.
The impact of lifestyle on myopia was assessed with logistic regression. First, univariate logistic regression analyses were performed to evaluate the associations of each lifestyle-related factor with myopia. Myopia status was considered the dependent variable, while individual lifestyle-related factors served as independent variables, with adjustment for the confounding factors of sex, age, and parental myopia. Then, all lifestyle-related factors with P < 0.2 were selected as independent variables, again with adjustment for sex, age, and parental myopia, to assess the impact of lifestyle on myopia using multivariate logistic regression. Odds ratios (OR) and their 95% confidence intervals (CI) were reported.
Moreover, the predictive ability of lifestyle factors on myopia was evaluated. Logistic regression was employed to establish myopia prediction models using basic information (sex, age, and parental myopia) and a combination of both basic information and lifestyle factors, separately. The ROC (receiver operating characteristic) curves, areas under the curve (AUCs) along with 95% Delong confidence intervals were utilized to demonstrate the performance of two models. A paired DeLong test was performed to compare the two AUCs. All statistical tests were two-tailed, and P values < 0.05 were considered statistically significant.
RESULTS
Demographic characteristics and Lifestyle
The study included 811 fourth-grade primary school students from Fujian Province who completed both vision examinations and questionnaires. There were 435 boys (53.6%) and 376 girls (46.4%), with an average age of 9.70 ± 0.54 years. The overall prevalence of myopia was 46.4% (376/811). Among the myopic students, 39.1% had one parent with myopia and 34.3% had both parents affected. Conversely, among non-myopic students, the proportions were 33.8% and 13.3% respectively. The difference in parental myopia between the two groups were statistically significant (P < 0.001).
All students spent more than one hour daily on outdoor activities. Specifically, 74.2% of students spent for 1 to 2 hours, and 25.8% spent over 2 hours (including 5.9% for over 3 hours). A higher proportion of non-myopic students engaged in outdoor activities for over 2 hours compared to myopic students (31.0% vs. 19.7%, P<0.001). Similarly, more non-myopic students participated in activities outside the classroom during recess compared to myopic students (69.4% vs. 56.1%, P<0.001).
Regarding screen time, 32.4% of students had an average daily screen time of 1-2 hours, while 9.5% had over 2 hours of screen time. In terms of study time after school, 34.6% of students had an average of 2-3 hours, and 11.5% had over 3 hours of study time. Additionally, 35.9% of students reported average daily sleep duration of less than 8 hours. There were no significant differences in these three factors between the two groups (Table 1).
Table 1 Demographic characteristics and lifestyle of the primary school students in Fujian
|
Variable
|
Total
N = 811
Mean±SD/ n(%)
|
Myopia
N = 376
Mean±SD/ n(%)
|
Non-myopia
N = 435
Mean±SD/ n(%)
|
P
|
|
Age, year
|
9.70±0.54
|
9.73±0.48
|
9.67±0.58
|
0.08
|
|
Sex
|
|
|
|
|
|
Girls
|
376(46.4)
|
178(47.3)
|
198(45.5)
|
0.65
|
|
Boys
|
435(53.6)
|
198(52.7)
|
237(54.5)
|
|
|
Parental myopia
|
|
|
|
<0.001
|
|
None
|
330(40.7)
|
100(26.6)
|
230(52.9)
|
|
|
One
|
294(36.3)
|
147(39.1)
|
147(33.8)
|
|
|
Both
|
187(23.1)
|
129(34.3)
|
58(13.3)
|
|
|
Class recess
|
|
|
|
<0.001
|
|
Inside classroom
|
298(36.7)
|
165(43.9)
|
133(30.6)
|
|
|
Outside classroom
|
513(63.3)
|
211(56.1)
|
302(69.4)
|
|
|
Time outdoor, h/d
|
|
|
|
<0.001
|
|
1-2 h
|
602(74.2)
|
302(80.3)
|
300(69)
|
|
|
2-3 h
|
161(19.9)
|
62(16.5)
|
99(22.8)
|
|
|
>3 h
|
48(5.9)
|
12(3.2)
|
36(8.3)
|
|
|
Screen time, h/d
|
|
|
|
0.27
|
|
<1 h
|
471(58.1)
|
224(59.6)
|
247(56.8)
|
|
|
1-2 h
|
263(32.4)
|
123(32.7)
|
140(32.2)
|
|
|
>2 h
|
77(9.5)
|
29(7.7)
|
48(11.0)
|
|
|
Study time after school, h/d
|
|
|
|
0.68
|
|
<2 h
|
437(53.9)
|
208(55.3)
|
229(52.6)
|
|
|
2-3 h
|
281(34.6)
|
128(34)
|
153(35.2)
|
|
|
>3 h
|
93(11.5)
|
40(10.6)
|
53(12.2)
|
|
|
Sleep duration, h/d
|
|
|
|
0.94
|
|
<8 h
|
291(35.9)
|
137(36.5)
|
154(35.4)
|
|
|
8-9 h
|
441(54.4)
|
202(53.7)
|
239(54.9)
|
|
|
>9 h
|
79(9.7)
|
37(9.8)
|
42(9.7)
|
|
The impact of lifestyle on myopia
Univariate logistic regression analysis was conducted to assess the relationship between individual lifestyle factors and myopia, with adjustment for sex, age and parental myopia. The results indicated that average daily time spent on outdoor activities and recess outside classroom were significantly associated with myopia. Conversely, daily screen time, study time after school, and sleep duration exhibited no significant association with myopia (Table 2).
Lifestyle-related factors with P-values <0.2 in the univariate logistic regression analyses were further analyzed using multivariate logistic regression. These factors included average daily time spent on outdoor activities, recess outside classroom, and screen time. After adjusting for sex, age and parental myopia, the results demonstrated that engaging in outdoor activity during class recess (OR = 0.646 [95% CI: 0.473-0.881], P = 0.006) and average daily time spent outdoors (2-3 hours: OR = 0.682 [95% CI: 0.466-0.993], P = 0.047; over 3 hours: OR = 0.403 [95% CI: 0.192-0.796], P = 0.01) were independent protective factors against the development of myopia. Additionally, parental myopia emerged as a significant risk factor. Compared to students with neither parent having myopia, students with myopic parents were much more likely myopic (either myopic parent: OR = 2.247 [95% CI: 1.612–3.145], P < 0.001); both myopic parents: (OR = 4.824 [95% CI: 3.262–7.204], P < 0.001) (Table 3).
Table 2 Association between myopia and each factor of lifestyle among primary school students using univariate logistic regression
|
Lifestyle
|
OR [95%CI]
|
P value
|
|
Class recess
|
|
|
|
Inside classroom
|
1
|
|
|
Outside classroom
|
0.614[0.451, 0.835]
|
0.002
|
|
Time outdoor, h/d
|
|
|
|
1-2 h
|
1
|
|
|
2-3 h
|
0.643[0.441, 0.932]
|
0.02
|
|
>3 h
|
0.379[0.182, 0.739]
|
0.006
|
|
Screen time, h/d
|
|
|
|
<1 h
|
1
|
|
|
1-2 h
|
0.99[0.721, 1.363]
|
0.96
|
|
>2 h
|
0.683[0.399, 1.152]
|
0.16
|
|
Study time after school, h/d
|
|
|
|
<2 h
|
1
|
|
|
2-3 h
|
0.935[0.682, 1.283]
|
0.68
|
|
>3 h
|
0.831[0.513, 1.338]
|
0.45
|
|
Sleep duration, h/d
|
|
|
|
<8 h
|
1.023[0.747, 1.400]
|
0.89
|
|
8-9 h
|
1
|
|
|
>9 h
|
1.151[0.690, 1.915]
|
0.59
|
Logistic regression adjusted for sex, age and parental myopia.
OR, Odds Ratio;CI, confidence interval; h, hour.
Table 3 Association between myopia and lifestyle among primary school students using multivariate logistic regression
|
Variable
|
OR [95%CI]
|
P value
|
|
Age, year
|
1.314[0.995, 1.740]
|
0.06
|
|
Sex
|
|
|
|
Girls
|
1
|
|
|
Boys
|
0.966[0.714, 1.308]
|
0.82
|
|
Parental myopia
|
|
|
|
Neither
|
1
|
|
|
One
|
2.247[1.612, 3.145]
|
<0.001
|
|
Both
|
4.824[3.262, 7.204]
|
<0.001
|
|
Class recess
|
|
|
|
Inside classroom
|
1
|
|
|
Outside classroom
|
0.646[0.473, 0.881]
|
0.006
|
|
Time outdoor, h/d
|
|
|
|
1-2 h
|
1
|
|
|
2-3 h
|
0.682[0.466, 0.993]
|
0.047
|
|
>3 h
|
0.403[0.192, 0.796]
|
0.01
|
|
Screen time, h/d
|
|
|
|
<1 h
|
1
|
|
|
1-2 h
|
1.022[0.741, 1.409]
|
0.90
|
|
>2 h
|
0.739[0.427, 1.258]
|
0.27
|
OR, Odds Ratio;CI, confidence interval; h, hour.
Lifestyle improved myopia prediction capacity
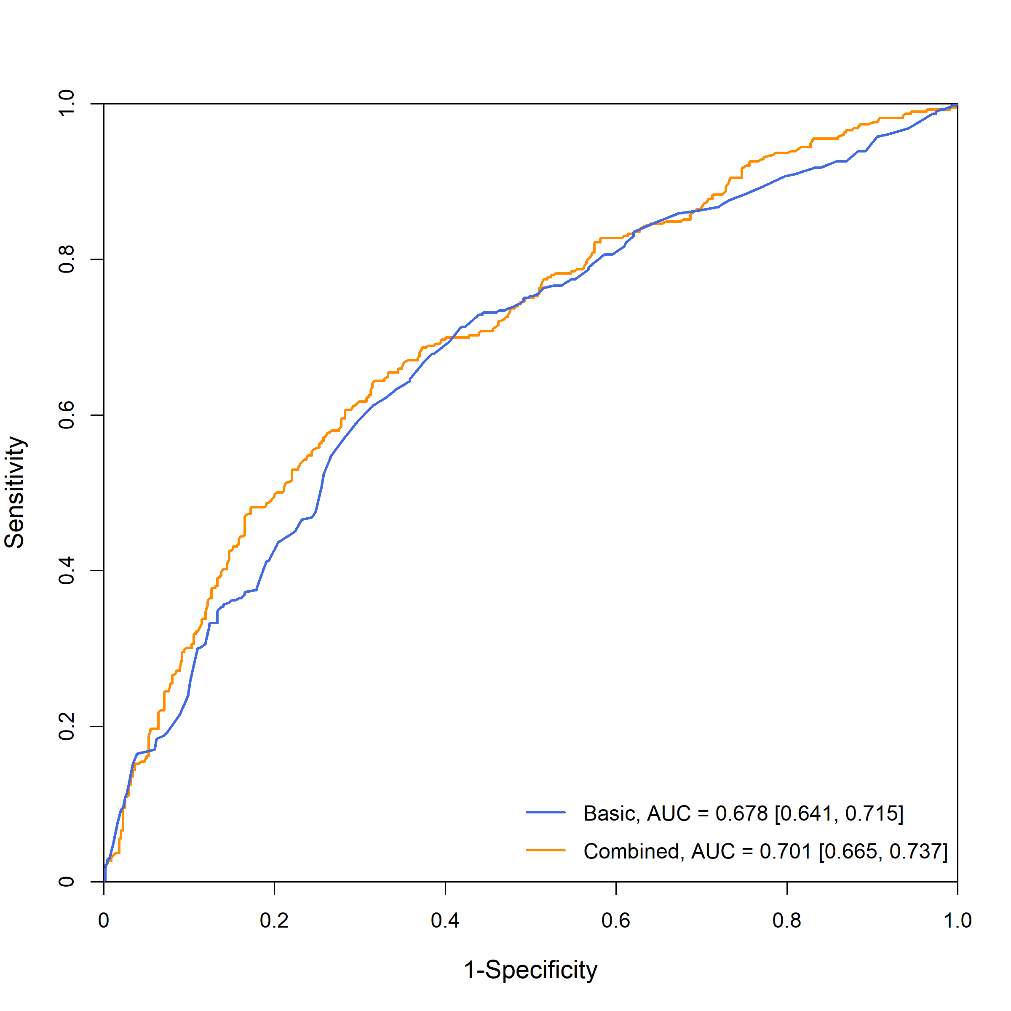
Myopia prediction models were developed using logistic regression with basic information (sex, age, and parental myopia) only and a combination of basic information with lifestyle factors (time spent outdoor activities, recess outside classroom, and screen time), respectively. The ROC curves and corresponding AUCs for the two models are presented in Figure 1. The model based solely on basic information yielded an AUC of 0.678 [95% CI: 0.641-0.715], whereas the model that included both basic information and lifestyle factors achieved an AUC of 0.701 [95% CI: 0.665-0.737]. The addition of lifestyle factors significantly enhanced the model’s predictive performance for myopia (P = 0.01).
Figure 1 ROC curve plot of myopia prediction using lifestyle
DISCUSSION
The study revealed that all participating students engaged in more than 1 hour of outdoor activities daily, highlighting the positive impact of the PLAN. However, only 25.8% of students participated in more than 2 hours of outdoor activities. Furthermore, 63.3% of students took part in activities outside classroom during class breaks. These findings suggest considerable potential for optimizing lifestyle habits to aid in myopia prevention and control among urban primary school students in Fujian. The results of this study demonstrated that time spent outdoors and engaging in outdoor activities during class breaks are protective factors against myopia, which is consistent with previous research findings. Lifestyle factors significantly enhanced the predictive capacity for myopia, underscoring their substantial impact on its development. Schools and families must actively encourage students and implement effective measures to promote increased time spent on outdoor activities and encourage recess outside the classroom. Adopting a healthy lifestyle is essential for students to prevent and control myopia. Recently, some primary schools in Fujian have taken the initiative to reform their practices. For instance, Jinguang Primary School in Quanzhou City has decided to extend the length of short breaks from the original 10 minutes to 15 minutes starting from fall semester of 2024. Additionally, the school provides students with a variety of outdoor activities, such as games, sports, puzzles, and leisure activities, to ensure adequate relaxation for their eyes and bodies. To achieve myopia prevention and control objectives, more schools need to innovate and change their approaches with the support of educational bureaus in the future.
In addition, our results indicated that students whose parents were nearsighted exhibited a significantly higher risk of developing myopia. Compared to students whose parents were not myopic, students with one myopic parent had a 2.2-fold risk of myopia, while the risk to 4.8 times for students whose both parents were myopic. Therefore, students with nearsighted parents, especially those had two myopic parents, should be considered a key target population for myopia prevention efforts.
Screen time, study time after school, and sleep duration were not significantly associated with myopia in this study. This was a cross-sectional observational study, and the reasons for this findings may be that parents paid more attention to the lifestyle of their nearsighted children, thereby promoting better behavior, or these factors may indeed be unrelated to myopia. The associations between these factors and myopia have been contentious in previous research. Studies have found that myopia was not related to total screen time[20]; it was not associated with total time spent on near work but was linked to continuous near work duration and working distance[21]; and myopia was not correlated with sleep duration but was associated with sleeping late and sleep quality[22,23]. Furthermore, the lifestyle data were collected through self-reports, which are subjective and may be subject to recall bias. For this reason, although incorporating lifestyle factors significantly enhanced the predictive capacity for myopia, the improvement was relatively small. To assess the effectiveness of lifestyle-based strategies in myopia prevention and control, future studies should employ longitudinal research design and use wearable electronic devices to objectively, precisely, and quantitatively measure various aspects of lifestyle. A limited number of studies have begun to explore these methods and have offered crucial methodological insights[24-28]. For example, measuring near work using D-hours (diopter-hours), collecting data on continuous screen time, and intervals of screen use. Investigating the effects of lifestyle-related factors on myopia development and progression is essential for achieving cost-effective myopia mitigation.
In conclusion, our study demonstrated suboptimal lifestyle patterns among urban primary school students in Fujian. The time spent on outdoor activities and recess outdoor were significantly associated with myopia. Multifaceted interventions should prioritize: school-family partnerships to implement structured outdoor activity programs (at least two hours of outdoor activities, as advocated by the PLAN); protocols for transitioning from classroom to outdoors during class recesses; and targeted surveillance for high-risk students, particularly those with biparental myopia.
Correction notice
None
Acknowledgements
None
Author Contributions
(I) Conception and design: Lanqin Zhao, Haotian Lin
(II) Administrative support: Duoru Lin
(III) Provision of study materials or patients: Yuchun He, Jianmin Hu
(IV) Collection and assembly of data: Wei Xiao, Mingwei Wang, Jianyu Pang, Weiqin Qiu, Yue Wu
(V) Data analysis and interpretation: LZ, WX, YYLanqin Zhao, Wei Xiao,Yahan Yang
(VI) Manuscript writing: All authors
(VII) Final approval of manuscript: All authors
Funding
This study was supported by the Science and Technology Planning Project of Guangdong Province (2023A1111120011), the Natural Science Foundation of Guangdong Province (2024A1515010801). The funding organizations had no role in the following aspects: design and conduct of the study; the collection, management, analysis, and interpretation of the data; preparation, review, or approval of the manuscript; and the decision to submit the manuscript for publication.
Conflict of Interests
None of the authors has any conflicts of interest to disclose. All authors have declared in the completed the ICMJE uniform disclosure form.
Patient consent for publication
None
Ethics approval and consent to participate
This study was approved by the Ethics Committee of Sun Yat-sen University Zhongshan Ophthalmic Center (Approval No.: 04161326). Written informed consent was obtained from both the students and their guardians.
Data availability statement
None
Open access
This is an Open Access article distributed in accordance with the Creative Commons Attribution NonCommercial-NoDerivs 4.0 International License (CC BY-NC-ND 4.0), which permits the non-commercial replication and distribution of the article with the strict proviso that no changes or edits are made and the original work is properly cited (including links to both the formal publication through the relevant DOI and the license).
'%20fill='white'%20fill-opacity='0.01'/%3e%3cmask%20id='mask0_3477_29692'%20style='mask-type:luminance'%20maskUnits='userSpaceOnUse'%20x='0'%20y='0'%20width='16'%20height='16'%3e%3crect%20id='&%23232;&%23146;&%23153;&%23231;&%23137;&%23136;_2'%20x='16'%20width='16'%20height='16'%20transform='rotate(90%2016%200)'%20fill='white'/%3e%3c/mask%3e%3cg%20mask='url(%23mask0_3477_29692)'%3e%3cpath%20id='&%23232;&%23183;&%23175;&%23229;&%23190;&%23132;'%20d='M14%205L8%2011L2%205'%20stroke='%23333333'%20stroke-width='1.5'%20stroke-linecap='round'%20stroke-linejoin='round'/%3e%3c/g%3e%3c/g%3e%3c/svg%3e)