




HIGHLIGHTS
1. Critical Discoveries and Outcomes
• Among five eye-movement paradigms evaluated in 1,212 older adults with measured near visual acuity, only the antisaccadic task discriminated participants with and without MoCA-defined cognitive impairment at every visual-acuity stratum, indicating that its discriminative signal was retained across the levels of near visual acuity examined.
2. Methodological Innovations
• REMoCA processes eye-movement trajectory videos directly with a pseudo-3D network rather than a predefined set of summary metrics, automating trial-level classification of eye-movement performance and combining it with demographic and clinical risk factors in a two-stage framework. Saliency mapping permits visual inspection of model-attended regions, and dominance analysis summarises the relative contribution of predictors.
3. Prospective Applications and Future Directions
• A shortened antisaccadic-task workflow was completed within three minutes in a prospective community-based proof-of-concept cohort, supporting technical feasibility outside hospital settings. Larger and more representative community studies, improved calibration, and explicit evaluation of decision thresholds are required before this approach can be considered for triage, referral, or population-level screening.
Introduction
The integration of visual and cognitive functions is fundamental to human information processing.[1] Goal-directed behavior depends on both visual input and cognitive control.[2] Declines in either domain may alter observable performance,[3] yet isolating a cognition-specific signal from co-occurring visual decline remains challenging. This challenge is particularly relevant in aging populations, in whom sensory decline and cognitive impairment frequently coexist and can confound behavioral markers of cognition.[4-5]
Cognitive impairment is common in older adults: the pooled worldwide prevalence of mild cognitive impairment among community dwellers aged 50 years or older is an estimated 15.6%,[6] and affected individuals are at substantially increased risk of progression to dementia. Its early identification can therefore facilitate timely clinical assessment and intervention.[4] The Montreal Cognitive Assessment (MoCA) is among the most widely used screening instruments for cognitive impairment, offering high sensitivity for detecting mild cognitive impairment and coverage of multiple cognitive domains.[7] However, administration of the MoCA requires a trained examiner and a dedicated in-person session, which may limit accessibility in resource-limited settings.[8] Neuroimaging offers complementary structural information: white matter lesions (WMLs), a common feature of cerebral small vessel disease, are associated with cognitive decline, particularly in executive function and processing speed.[9] Yet, magnetic resonance imaging (MRI) is costly and impractical for population-level screening. These considerations underscore the need for rapid, scalable approaches that complement existing screening strategies.
Eye movement (EM) provides an objective, rapid, and automated behavioral readout of cognitive function.[10] Advances in eye-tracking technology enable high-resolution measurement of gaze position through near-infrared detection of pupillary and corneal reflections.[11] Because EM assessment inherently depends on visual input, however, the derived cognitive signal could be confounded by reduced visual acuity (VA). Most prior studies have focused on cohorts with normal VA,[11-12] despite the frequent co-occurrence of visual and cognitive impairment among older adults.[5] Establishing that EM measures retain their discriminative ability across varying levels of VA is therefore essential before clinical translation.
To address these gaps, we compared EM performance across five paradigms between older adults with and without cognitive impairment, operationally defined as an education-adjusted MoCA score below 26 (MoCA-defined CI), and examined whether any such differences were retained across levels of VA. On this basis, we selected the antisaccadic task (AST), which showed the most consistent between-group separation across the VA strata examined, to develop the Rapid Eye-Movement-based Cognitive Assessment (REMoCA), a two-stage framework for detecting MoCA-defined CI. We then evaluated REMoCA in an external test set and assessed its feasibility in a prospective, community-based proof-of-concept cohort.
Methods
Study design and participants
This multicenter study comprised three distinct phases: a prospectively collected development cohort (September 2020 to July 2025), a pre-enrolled multicenter test cohort (February 2021 to February 2022), and a prospective community-based proof-of-concept cohort (July 2025 to November 2025). The study examined the associations between VA and MoCA-defined CI and EM behavior, and developed a predictive model for MoCA-defined CI. Development participants were recruited from (1) neurology inpatients at Sun Yat-sen Memorial Hospital (SYMH) and (2) community-dwelling individuals recruited through an eye disease screening program advertised via social media. Eligible EM videos were partitioned at the participant level into training, validation, and internal test sets (7:1.5:1.5) for stage 1, which classified trial performance as correct or incorrect. Detailed criteria for this classification are provided in Supplementary File 1. After excluding 127 participants lacking the outcome data required for stage 2, the remaining participants were divided into training and internal test sets (7:3). Stage 1 used trial-level EM videos, whereas stage 2 used participant-level EM accuracy metrics and risk factors (RFs) to detect MoCA-defined CI. The stage 2 training and internal test sets were nested within the corresponding stage 1 training, validation and internal test sets, respectively, ensuring that no participant in the stage 2 internal test set had contributed data to stage 1 model training. Consequently, the participant-level EM-accuracy features used as stage 2 inputs were therefore derived from stage 1 predictions generated on held-out data for each participant, thereby preventing information leakage between the two stages. The external test set consisted of cataract outpatients at Zhongshan Ophthalmic Center (ZOC), neurology outpatients at SYMH, and neurology inpatients at Huiai Hospital. The final phase integrated the shortened REMoCA workflow into a community health screening program as a prospective proof-of-concept feasibility study.
Individuals aged 50 years or older were eligible. Participants unable to complete eye-tracking calibration or the EM protocol due to ocular, cognitive, physical, or systemic conditions were excluded from EM analyses. Individuals with other ocular diseases causing reduced vision were not routinely excluded, provided that calibration and testing could be successfully completed. Those without a valid MoCA outcome were ineligible for development of the stage 2 network for detecting MoCA-defined CI, and those who did not undergo MRI were excluded from the exploratory WML analysis. Written informed consent was obtained from all participants or their legal guardians in accordance with ethical guidelines.
This study was approved by the Institutional Review Board of ZOC, Sun Yat-sen University(Approval No. 2020KYPJ015), and adhered to the Declaration of Helsinki. It was prospectively registered with the Clinical Research Internal Management System of ZOC and ClinicalTrials.gov (NCT04236375). Participant demographics (age, sex, education, and clinical characteristics) are summarized in Table 1.
|
|
Internal dataset |
External test set |
Prospective community cohort |
|
No. of participants |
1,326 |
102 |
124 |
|
No. of participants with MoCA <26 |
902 a |
85 |
60 |
|
No. of participants with MoCA ≥26 |
297 a |
17 |
64 |
|
Age, years |
|
|
|
|
Mean (SD) |
65.96 (8.05) |
65.77 (9.71) |
69.88 (4.31) |
|
Range |
50–89 |
50–87 |
63–82 |
|
Sex |
|
|
|
|
Male, n (%) |
658 (49.6) |
57 (55.9) |
47 (37.9%) |
|
Female, n (%) |
668 (50.4) |
45 (44.1) |
77 (62.1%) |
|
Education, years |
|
|
|
|
Mean (SD) |
11.04 (4.03) |
10.59 (3.57) |
13.10 (3.42) |
|
Range |
0–19 |
0–19 |
0–19 |
|
Participants with hypertension, n (%) |
539 (40.6) |
50 (49.0) |
38 (30.6%) |
|
Participants with diabetes, n (%) |
270 (20.4) |
28 (27.5) |
12 (9.6%) |
|
Near visual acuity, logMAR |
|
|
|
|
Median (IQR) |
0.22 (0.24) |
0.22 (0.20) |
0.22 (0.19) |
|
Range |
−0.08–1.30 |
0–0.52 |
0–1.00 |
|
MoCA |
|
|
|
|
Median (IQR) |
22 (8)a |
20 (7.75) |
26 (4) |
|
Range |
3–30 |
3–30 |
13–30 |
|
Fazekas scale among participants with MoCA <26 |
|
|
|
|
Median (IQR) |
2 (1)b |
2 (3)c |
NA |
|
Range |
0–6 |
0–6 |
NA |
|
Data are presented as n, n (%), mean (SD), median (IQR), and range unless otherwise specified. The internal dataset includes all participants with valid EM data (n = 1,326); 1,199 were included in stage 2 after excluding 127 without the required outcome data. aA subset of 1,199 participants; bA subset of 556 participants; cA subset of 29 participants. SD, standard deviation; IQR, interquartile range; NA, not applicable; MoCA, Montreal Cognitive Assessment; WML, white matter lesion. |
|||
Data collection and reference standards
EMs were recorded by well-trained technicians using a standardized protocol, and all sessions were videotaped. The setup included a 1,280 × 720 pixel screen integrated with an eye tracker (EyeControl, QY-I, Shanghai Qingyan Technology Co., Ltd.) operating at a sampling rate of 100 Hz. Participants were instructed to stabilize their heads using a chinrest positioned 60 cm from the screen and perform EM tests in a fixed sequence: the fixation task (FT, 10 trials), the saccadic task (ST, 10 trials), AST (12 trials), the horizontal smooth pursuit task (HSPT, 8 trials), and the vertical smooth pursuit task (VSPT, 8 trials). This entire session lasted approximately 10 minutes, generating 48 videos per participant. EM performance on each trial was classified as correct or incorrect according to predefined criteria (Supplementary File 1, p. 22) and verified by video review. For example, a correct AST trial required participants to suppress the reflexive saccade toward the peripheral stimulus, compute its opposite direction (180° from the stimulus), and execute a voluntary saccade accordingly. In the subsequent community-based proof-of-concept workflow, only the AST and RF were used, reducing the automated assessment time to approximately 3 minutes.[13]
Following the EM examination, participants were given a 10-minute rest period, after which near VA was assessed binocularly under standard lighting using the logarithm of the minimum angle of resolution (logMAR) near VA tumbling E chart by experienced technicians. Subsequently, cognitive function was evaluated using the Chinese version of MoCA, administered by neuropsychologists to ensure validity. The maximum score was 30; one additional point was added to the total score for individuals with 12 or fewer years of education. A score lower than 26 was used to define MoCA-defined CI among the study participants (i.e., aged ≥50 years) for model development and evaluation.[7] Finally, brain MRI was performed on 1.5T or 3T scanners (Magnetom Avanto/Vida/Skyra, Siemens, Erlangen, Germany), including axial fast spin-echo T1- and T2-weighted, and coronal fluid-attenuated inversion recovery (FLAIR) sequences. WMLs were evaluated using the Fazekas scale, scoring periventricular and deep white matter separately from 0 to 3 and summing them to yield a total score of 0–6.[14] Total scores >2 (i.e., 3–6) were classified as moderate-to-severe WMLs.[15] Two junior physicians (J.W. and S.Z. each with five years of clinical experience), blinded to clinical and EM data, independently evaluated all MRI scans (inter-rater κ = 0.853). Prior to formal scoring, both raters completed a calibration exercise on a set of training cases under the supervision of a senior neurologist (Y.T.) to standardize application of the Fazekas scale. Discrepancies were resolved by consensus between the two raters; when consensus could not be reached, a senior neurologist (Y.T., with more than 25 years of clinical experience) provided adjudication. RF, including age, sex, educational level, hypertension, and diabetes status, as well as neurological and systemic disorders, were extracted from electronic medical records or obtained by self-reported.
Development of REMoCA
The AST was selected for REMoCA because it showed significant between-group differences across all three VA strata and the most consistent discriminative performance among the five paradigms examined. REMoCA is a two-stage network for screening MoCA-defined CI (Figure 1e; Supplementary Table 1; Supplementary file 2, p. 23). Stage 1 used independent pseudo-3D (P3D) networks to automate the trial-level classification of EM performance as correct and incorrect. The P3D networks incorporated 2D spatial and 1D temporal convolutions within a residual network architecture to efficiently extract spatiotemporal features from EM videos, thereby significantly reducing computational and memory requirements.[16] Supplementary Figure 1 shows the architecture of the P3D networks, including their series and parallel fusion schemes. EM videos were preprocessed by resampling each video to a fixed, task-specific frame count (corresponding to one complete task cycle) and resizing the frames to a uniform resolution of 224 × 224 pixels. The specific frame counts for each task are detailed in Supplementary Table 1. The resulting frames were then standardized channel-wise using the dataset mean and standard deviation. Stage 2 consisted of a logistic regression model that integrated the stage 1 outputs and RFs to screen MoCA-defined CI. For the detection of moderate-to-severe WMLs, Stage 2 was trained exclusively on the subgroup of participants with a MoCA score < 26 (Supplementary Figure 2a). For benchmarking, three additional models were developed: a RF machine-learning model (MLM) based solely on RFs, and an EM MLM based solely on features from all EM tasks, and a hybrid MLM incorporating both RFs and all EM features.
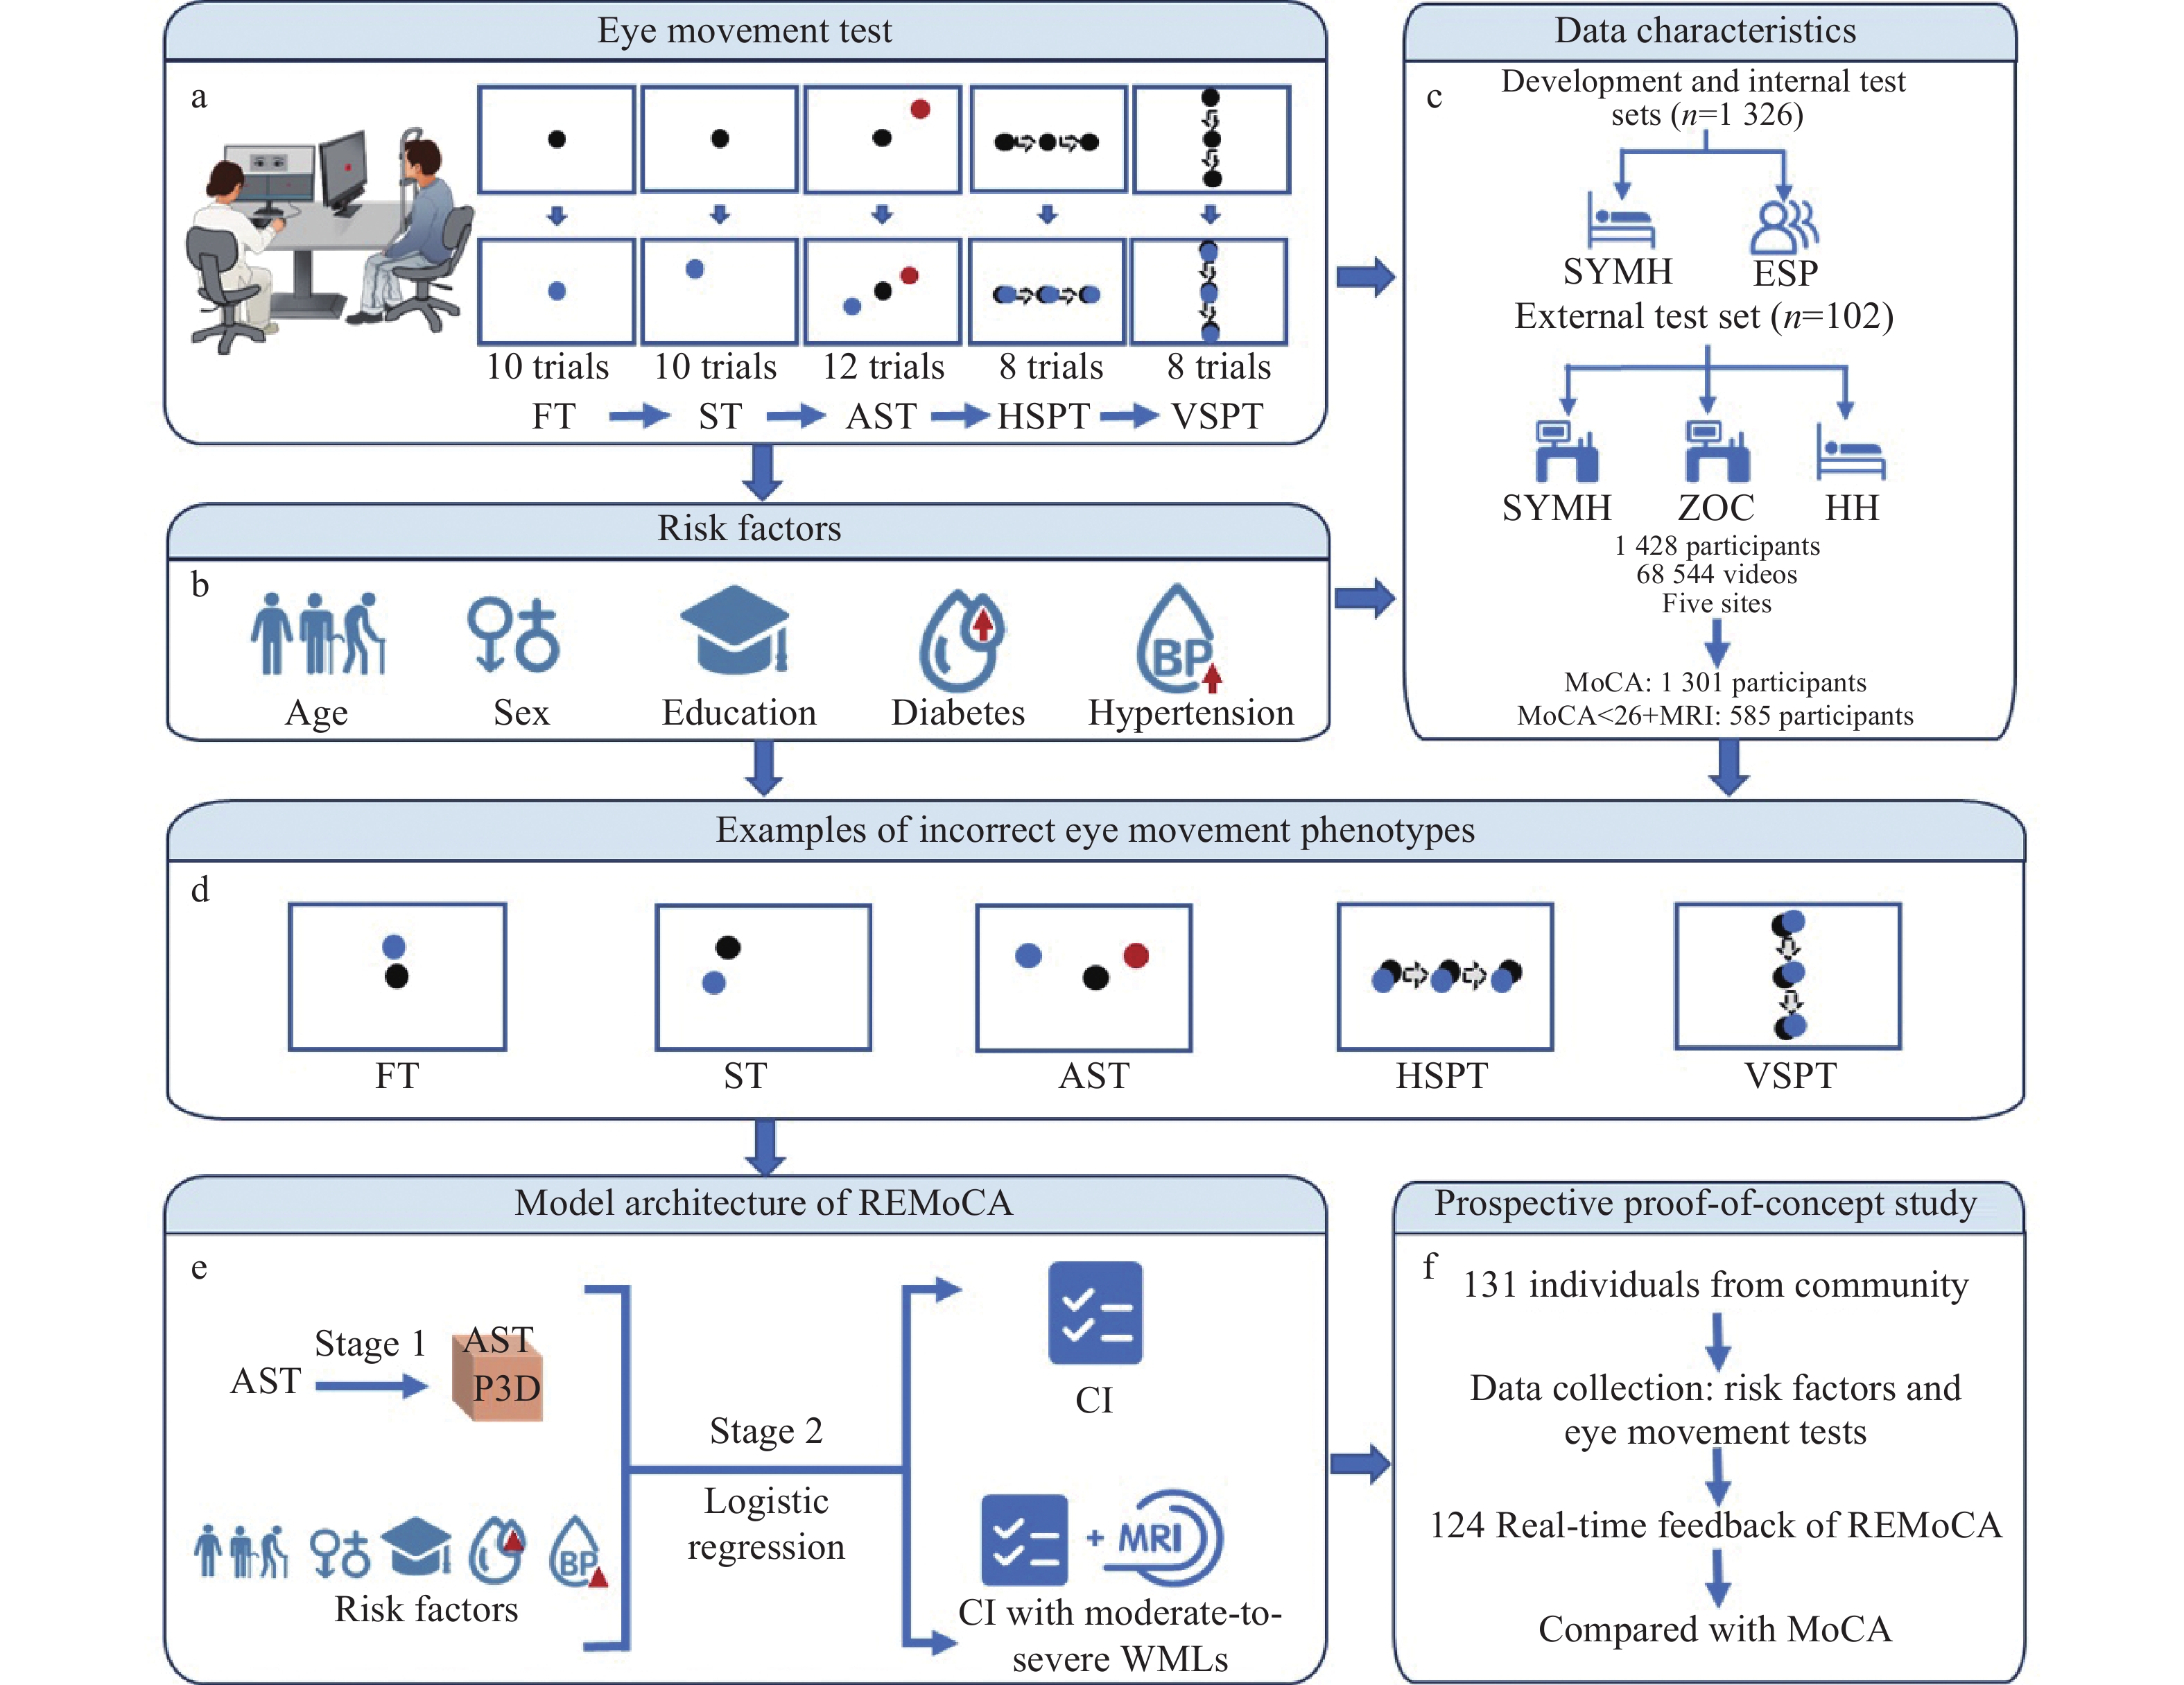
(a) The five-task comparison protocol used a fixed sequence—FT (10 trials), ST (10), AST (12), HSPT (8), and VSPT (8)—and lasted approximately 10 minutes. (b) RF were extracted from health records. (c) A total of 68,544 videos from 1,428 participants across five centers were collected; 1,301 participants had valid MoCA results. The exploratory WML analysis included 585 participants with MoCA <26 and valid Fazekas ratings, of whom 145 had moderate-to-severe WMLs. (d) AST-derived error patterns discriminated between MoCA-defined cognitive groups across VA strata. (e) REMoCA used AST videos to classify trial-level behavior in stage 1 and combined participant-level AST performance with RF to predict MoCA-defined cognitive impairment in stage 2; WML classification was an exploratory secondary analysis in a restricted subset. (f) A prospective community proof-of-concept cohort evaluated a shortened AST plus RF workflow requiring approximately three minutes. EM, eye movement; FT, fixation task; ST, saccadic task; AST, antisaccadic task; HSPT, horizontal smooth pursuit task; VSPT, vertical smooth pursuit task; RF, risk factors; VA, visual acuity; MoCA, Montreal Cognitive Assessment; WML, white matter lesion.
To enhance model interpretability, EM videos from testing datasets were selected for saliency analysis using Eigen-CAM for the Stage 1 network.[17] This method generated visual heatmaps by aggregating and averaging convolutional activations across all frames of each trial. For stage 2, dominance analysis was used to rank the relative importance of each EM task in the model’s performance in detecting MoCA-defined CI.
Prospective proof-of-concept cohort in a community-based health screening program
REMoCA was prospectively integrated into an ongoing community-based health screening program to evaluate its feasibility in real-world settings (Figure 1f; Supplementary Figure 2b). This shortened workflow used AST videos and RF collected by three trained technicians and transmitted to a computer equipped with a graphics processing unit (GPU) for automated processing via the REMoCA framework. All three technicians completed standardized training on the study protocol, which covered positioning participant on the chinrest, delivering task instruction, and operating the eye tracker. When REMoCA classified a participant as screen-positive for MoCA-defined CI (i.e., above the predefined threshold), the system generated a real-time referral recommendation. The entire workflow, from initial participant instruction to automated result generation, required approximately 3 minutes per individual. For ethical reasons, the referral recommendations generated by REMoCA were strictly advisory and did not influence clinical management; all participants subsequently underwent MoCA assessment administered by qualified personnel as part of the standard protocol.
Statistical analysis
To characterize EM task performance across different VA levels, a VA-stratified analysis was conducted. Participants were stratified into three VA strata based on logMAR values (logMAR ≤0.3, 0.3< logMAR ≤0.5, and logMAR >0.5). Within each stratum, EM task error rates were compared between participants with and without MoCA-defined CI using linear regression models adjusted for age, sex, educational level, hypertension, and diabetes status. P values were corrected for multiple comparisons using the false discovery rate method.
For model development, the training set (n = 839, comprising 631 with MoCA-defined CI and 208 without) achieved an events-per-variable ratio of approximately 20 for the 10 candidate predictors. The 10 predictors included the error rates of five EM tasks (FT, ST, AST, HSPT, and VSPT) and five RF (age, sex, education level, history of hypertension, and history of diabetes). Accordingly, a total of 1,199 participants (902 with and 297 without MoCA-defined CI) were included in the model development dataset, comprising the training set (n = 839) and internal test set (n = 360) in a 7:3 split. This sample size met recommended criteria for predictive modeling, supporting model complexity while mitigating the risk of overfitting. For the prospective proof-of-concept cohort, the sample size was estimated before recruitment to ensure sufficient power to assess REMoCA performance. Although the estimated prevalence of cognitive impairment in elderly Chinese populations is 14.7%,[18] the prevalence in our screening program was expected to be higher owing to the potential association between poorer VA and cognitive impairment, as well as our broader study definition based on MoCA <26.[7] The prevalence of cognitive impairment was therefore assumed to be 30%. We estimated that at least 23 individuals with MoCA-defined CI and 53 without MoCA-defined CI (76 in total) would be required to detect an AUC of 0.7 or greater with >80% power at a two-sided α of 0.05.
For the EM behavior classification model (Stage 1), a default probability threshold of 0.5 was used. For the MoCA-defined CI screening model (Stage 2), the optimal cutoff was determined using the Youden index, determined separately within the internal and the external test sets. Additionally, a cutoff corresponding to 85% sensitivity was derived in the internal test set, locked before recruitment of the prospective cohort, and subsequently applied to the prospective cohort for MoCA-defined CI.[19–21] AUCs were reported for all datasets. Accuracy, sensitivity, specificity, positive predictive value, negative predictive value, and the F1 score were reported for the external test set and the prospective cohort at their respective predefined thresholds. Metrics were reported with Wald 95% confidence intervals (95% CIs), and AUCs were compared using DeLong's test. Subgroup analyses were stratified by age (≤65 vs >65 years), sex (female vs male), education (≤9 vs >9 years), hypertension status, diabetes status, and near vision impairment status (defined as logMAR near VA >0.3).[22-23] All statistical tests were two-tailed, and a P value of less than 0.05 was considered statistically significant. P values were corrected for multiple comparisons using the false discovery rate (FDR) method. All analyses were performed using SPSS version 24 (IBM Statistics, IBM Corp.).
Results
Dataset characteristics
A total of 1,539 participants were assessed for eligibility for EM performance analysis, model development, and multicenter testing. The EM assessment included five tasks (FT, ST, AST, HSPT, VSPT). Of these, 111 (7.21%) were excluded due to ocular diseases or poor physical condition that precluded completion of EM tasks (including ptosis or strabismus in either eye, severe CI, and cerebrovascular diseases). The remaining 1,428 participants provided valid EM data. Among them, 127 declined MoCA testing or MRI and were included only in Stage 1 model training (EM-behavior classification from EM videos). For stage 2 (detection of MoCA-defined CI), 1,301 participants were included, comprising 1,199 for model development and 102 for external testing. Among these, 987 (75.86%) had MoCA <26. Of those with MoCA <26, 585 had valid Fazekas scores, of whom 145 (24.79%) had moderate-to-severe WMLs. For the prospective proof-of-concept cohort, 131 individuals were assessed during a community health screening program, and 124 individuals (94.7%) were enrolled, of whom 60 (48.39%) had MoCA scores <26 (Figure 1, Table 1, and Supplementary Table 2). The participant recruitment process is shown in Supplementary Figure 2, and the distribution of neurological disorders is summarized in Supplementary Table 3.
Cognitive-group differences in AST performance persist across VA strata
A total of 1,212 participants with valid VA and MoCA measurements were included. Participants with an education-adjusted MoCA scores <26 were classified into the MoCA-defined CI group, whereas those with a score ≥26 were classified into the non-CI group.[7] Across all five EM tasks, the MoCA-defined CI group exhibited higher error rates. Descriptively, between-group differences were most pronounced in the highest-VA stratum (Figure 2). Among the EM tasks evaluated, only the AST demonstrated significantly higher error rates in the MoCA-defined CI group across all VA stratum (adjusted P <0.05); the other tasks showed significant differences only in a subset of strata (Figure 2). Baseline characteristics stratified by VA stratum and cognitive status are summarized in Supplementary Table 4.
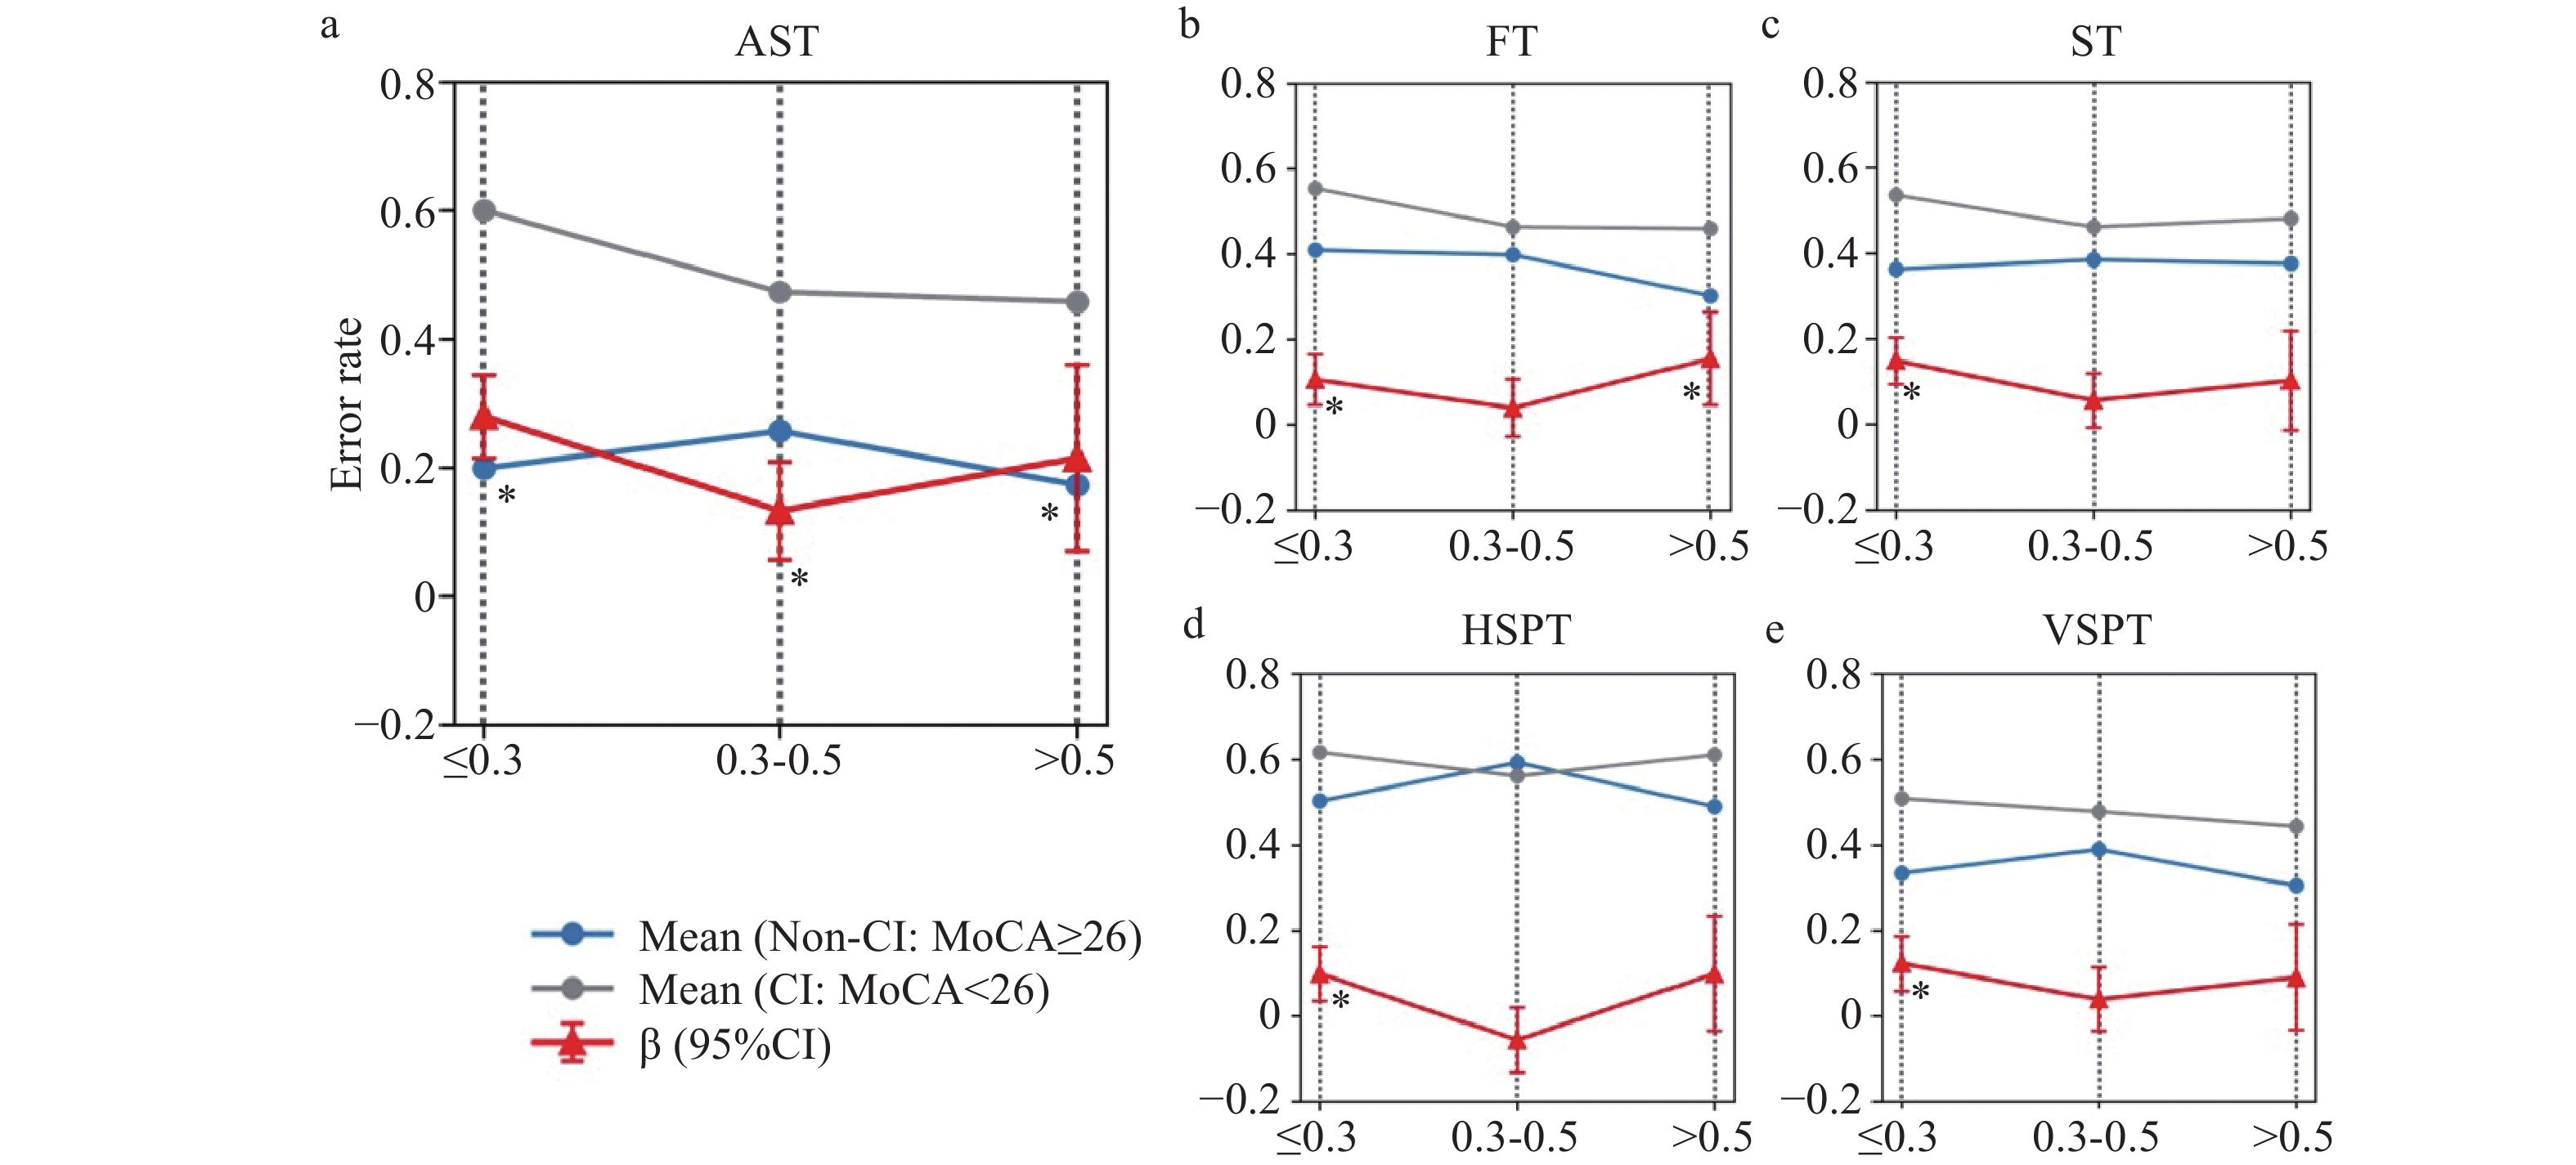
Blue lines indicate mean error rates for the non-CI group (MoCA ≥26), gray lines indicate mean error rates for the MoCA-defined CI group (MoCA <26), and red lines represent between-group differences estimated by linear regression (β) with 95% confidence intervals. VA was stratified by logMAR thresholds: the high-VA stratum (logMAR ≤0.3), the intermediate-VA stratum (logMAR 0.3–0.5), and the low-VA stratum (logMAR >0.5). LogMAR is a standard measure of VA, with higher values indicating poorer VA. (a) Antisaccadic task; (b) Fixation task; (c) Saccadic task; (d) Horizontal smooth pursuit task; (e) Vertical smooth pursuit task. *Asterisks indicate statistically significant differences in error rates between the MoCA-defined CI and non-CI groups based on linear regression analysis. P values were corrected for multiple comparisons using the false discovery rate method. EM, eye movement; VA, visual acuity; CI, MoCA-defined cognitive impairment.
AST-derived REMoCA enables MoCA-defined CI screening across datasets
For trial-level classification of the AST in the Stage 1 network, REMoCA achieved an AUC of 0.967 (95% CI, 0.958–0.975), a sensitivity of 0.922 (95% CI, 0.909–0.934), and specificity of 0.938 (95% CI, 0.927–0.949) in the internal test set, and an AUC of 0.986 (95% CI, 0.980–0.991), a sensitivity of 0.966 (95% CI, 0.957–0.974), and a specificity of 0.924 (95% CI, 0.911–0.936) in the external test set (Figures 3a and 3b; Supplementary Table 5). For classification of MoCA-defined CI in the Stage 2 network, REMoCA achieved an AUC of 0.802 (95% CI, 0.761–0.843), a sensitivity of 0.860 (95% CI, 0.824–0.896), and a specificity of 0.506 (95% CI, 0.454–0.557) in the internal test set, and an AUC of 0.907 (95% CI, 0.850–0.963), a sensitivity of 0.918 (95% CI, 0.864–0.971), and a specificity of 0.824 (95% CI, 0.750–0.898) in the external test sets (Figures 3d and 3e; Table 2). In the external test set, REMoCA outperformed both the risk factor (RF) machine learning model (MLM) and the all-EM MLM, and achieved discriminative performance comparable to that of the hybrid MLM (combining all-EM and RF features) (Figure 3e; Table 2; Supplementary Tables 6 and 7).
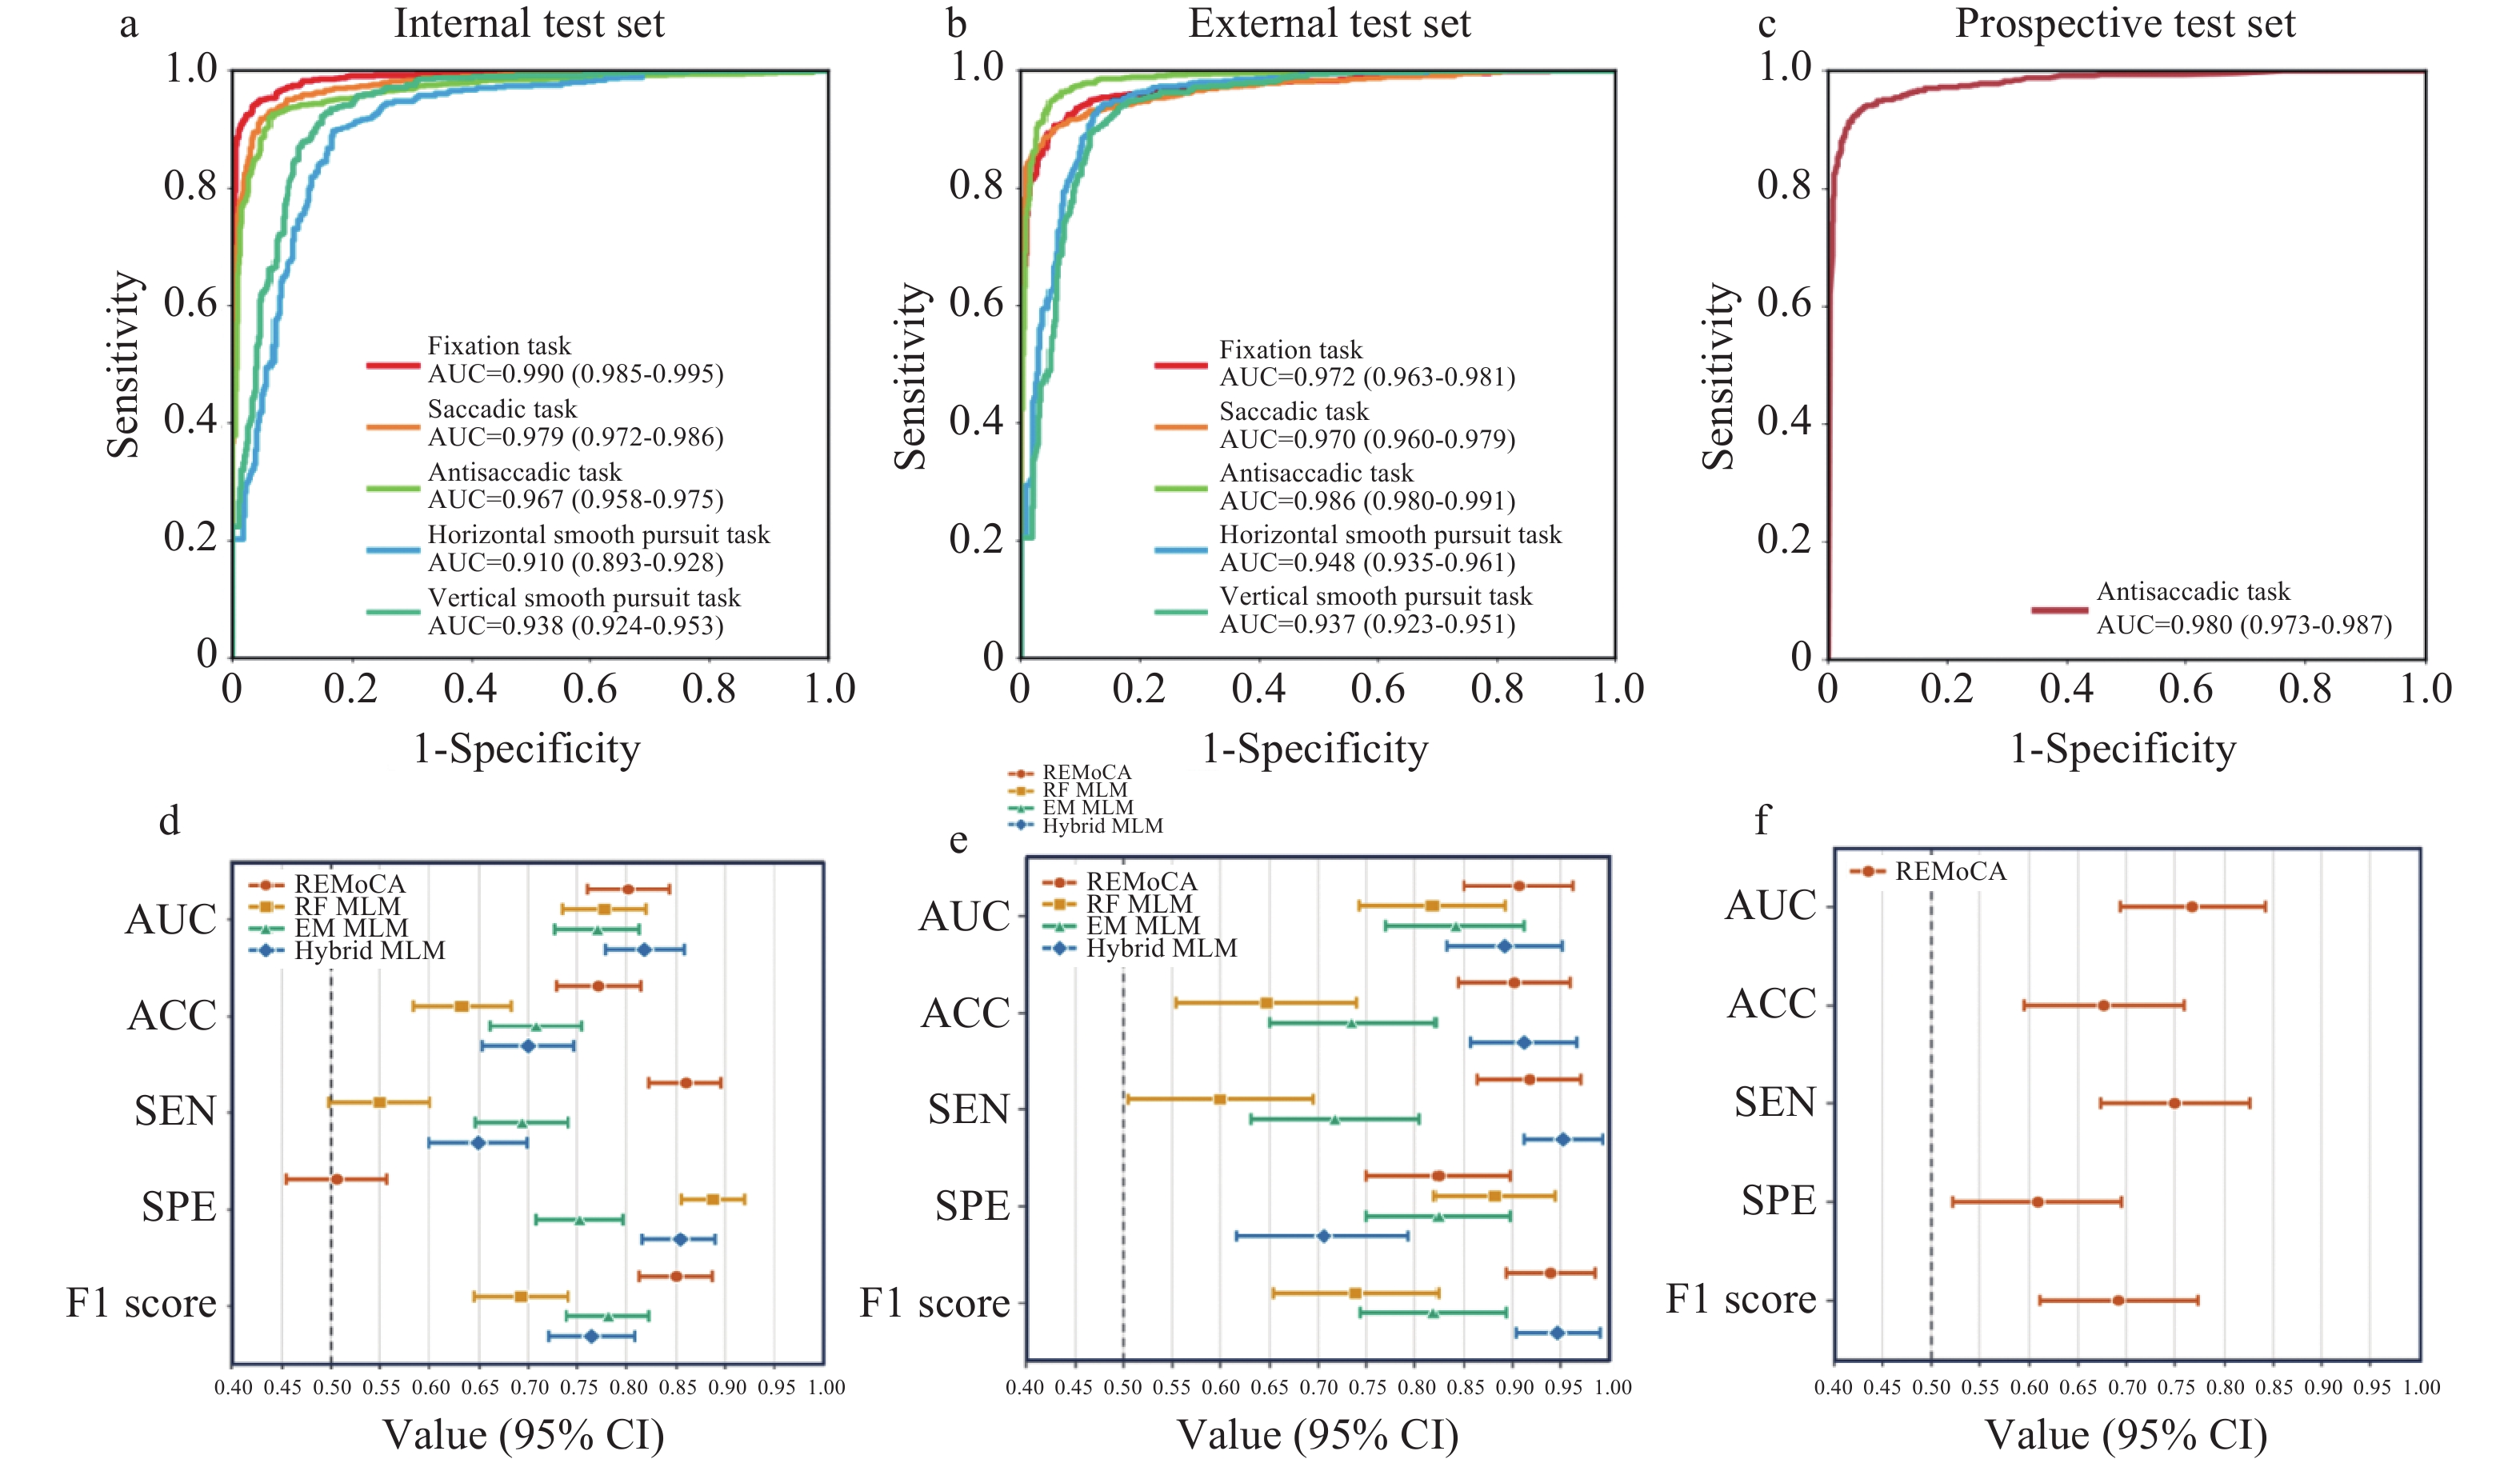
(a–c) AUCs for stage 1 EM-performance classification in the internal test set, external test set, and prospective community dataset. (d–f) Performance of stage 2 models for MoCA-defined cognitive impairment across the internal test set, external test set, and prospective community dataset. AUC, area under the receiver operating characteristic curve; RF, risk factors; EM, eye movement; MLM, machine-learning model; ACC, accuracy; SEN, sensitivity; SPE, specificity.
|
|
AUC(95% CI) |
ACC(95% CI) |
SEN(95% CI) |
SPE(95% CI) |
PPV(95% CI) |
NPV(95% CI) |
F1 score(95% CI) |
|
Internal test set |
0.802(0.761–0.843) |
0.772(0.729-0.816) |
0.860(0.824-0.896) |
0.506(0.454-0.557) |
0.841(0.803-0.879) |
0.542(0.491-0.594) |
0.850(0.814-0.887) |
|
External test set |
0.907(0.850–0.963) |
0.902(0.844-0.960) |
0.918(0.864-0.971) |
0.824(0.750-0.898) |
0.963(0.926-1.000) |
0.667(0.575-0.758) |
0.940(0.894-0.986) |
|
Prospective cohort |
0.768(0.694–0.842) |
0.677(0.595-0.760) |
0.750(0.674-0.826) |
0.609(0.523-0.695) |
0.643(0.559-0.727) |
0.722(0.643-0.801) |
0.692(0.611-0.774) |
|
Notes: AUC, area under the receiver operating characteristic curve; ACC, accuracy; SEN, sensitivity; SPE, specificity; PPV, positive predictive value; NPV, negative predictive value; 95% CI, 95% confidence interval. Threshold-dependent metrics (accuracy, sensitivity, specificity, PPV, NPV, and F1 score) are reported at dataset-specific operating points. For the internal and external test sets, this was the Youden-derived threshold determined separately within each dataset. For the prospective cohort, this was the 85%-sensitivity threshold, derived in the internal test set and locked before recruitment. |
|||||||
As an exploratory secondary analysis, we assessed the classification of moderate-to-severe WML (total Fazekas score >2) within a subgroup restricted to participants with MoCA <26 and valid Fazekas ratings (Supplementary Table 8).[14-15] Subgroup results are detailed in Supplementary Tables 9 and 10. Saliency heatmaps were generated to visualize the regions attended by the Stage 1 network, and dominance analysis (DA) was used to estimate the relative contributions of individual EM tasks and RFs to the Stage 2 model (Supplementary Figure 3).
REMoCA shows lower but feasible performance in the prospective community-based cohort
In the prospective community-based proof-of-concept cohort, all participants completed AST examinations within 3 minutes and underwent real-time cognitive assessment using REMoCA. The development dataset was enriched for participants with MoCA-defined CI (75.86%), whereas the prospective community cohort had a lower prevalence (48.39%). In the Stage 1 network, REMoCA achieved an AUC of 0.980 (0.973–0.987), a sensitivity of 0.924 (95% CI, 0.912–0.937), and a specificity of 0.958 (0.948–0.968) for AST trial classification (Figure 3c). In the Stage 2 network, REMoCA achieved an AUC of 0.768 (0.694–0.842), a sensitivity of 0.750 (95% CI, 0.674–0.826), and a specificity of 0.609 (95% CI, 0.523–0.695) for the real-time screening of MoCA-defined CI: this AUC was lower than that observed in the external test set (Figure 3f and Table 2). Confusion matrices for the prospective cohort are presented in Supplementary Figure 4.
Discussion
In this multicenter study, participants with MoCA-defined CI exhibited higher EM error rates across VA strata, although the magnitude of the between-group difference varied among strata. The AST discriminated most consistently between the MoCA-defined CI and non-CI groups across the VA levels examined. Therefore, we developed REMoCA as an AST-centered framework for detecting MoCA-defined CI and evaluated it in an external test set and a prospective community-based proof-of-concept cohort. Together, these findings identify the AST as a VA-tolerant EM measure for MoCA-defined CI and demonstrate its preliminary feasibility in a proof-of-concept setting, providing a basis for further development and evaluation.
Across VA strata, participants with MoCA-defined CI generally showed higher EM error rates than those without CI, suggesting a contribution of cognitive status to EM performance. This is consistent with the established role of higher-order cognitive control in EM tasks, particularly executive and inhibitory processes.[12,24] The between-group separation was most pronounced in the high-VA stratum and attenuated, but remained significant for the AST, in the lower-VA strata. This attenuation at poorer acuity more likely reflects the smaller and clinically more heterogeneous sample in the low-VA stratum (n = 98 in the MoCA-defined CI group and n = 41 in the non-CI group; Supplementary Table 4) than a direct effect of visual impairment on EM performance. Among the five paradigms, only the AST retained significant discriminative ability across all three VA strata.
AST performance depends on top-down inhibitory control, working memory, rule maintenance, and sufficient visual input to detect the target,[25] a profile that favors cognitive-driven over acuity-driven variation. Whereas discrimination by the other paradigms attenuated at reduced VA, the AST retained significant discrimination across all near-VA strata. Together, this cognitively driven profile and the consistent cross-stratum discrimination of AST motivated its selection as the core REMoCA task, supporting its use as a preferred basis for rapid cognitive screening in older adults. Notably, REMoCA achieves this VA-tolerance through the selection of a task whose discriminative performance is intrinsically robust across acuity levels, rather than through explicit statistical adjustment for VA within the model itself. Therefore, near VA was not included as a model predictor. This design choice reflects the intended screening context: near VA assessment requires a trained examiner.[26] Based on our experience administering it in this study, near VA testing also requires a cooperative, sustained response from the participant. This demand can be particularly difficult to sustain among individuals with potential CI, the very population this screening tool is intended to identify, and can therefore add appreciably to assessment time. Requiring a VA measurement as a model input would reintroduce the accessibility and time burden that REMoCA is intended to obviate, particularly in settings where trained examiners or additional testing time are not readily available.
Previous studies have investigated EM-based features, such as latency and saccadic velocity, as potential markers of CI.[27-28] These studies established EMs as informative behavioral markers, typically by deriving predefined summary metrics, often in focused or disease-specific cohorts.[29] Building on this foundation, our approach processes EM-derived video sequences with a pseudo-3D network, preserving spatial and temporal information across each task. Because it operates directly on EM-trajectory videos rather than a predefined set of summary metrics, this approach preserves richer spatial and temporal detail and yields interpretable saliency heatmaps that make the model-relevant EM patterns directly visualizable, offering a more comprehensive characterization of dynamic EM behavior.
Retinal imaging has been investigated as an ocular approach for cognitive screening, but retinal biomarkers primarily capture structural and vascular features of the eye.[30-31] EM assessment is complementary in focus: rather than static structure, it probes visually elicited behavior that is actively shaped by cognitive control, thereby capturing a functional dimension of visual processing that complements these structural markers. REMoCA operationalizes this functional perspective through a two-stage network that separates automated trial-level classification from participant-level detection of MoCA-defined CI. Saliency maps allow visual inspection of model-attended regions, and DA summarizes predictor contributions. Building on this design, the prospective community cohort assessed whether a shortened AST-centered workflow could be completed by trained non-specialist personnel within three minutes.[32] Its lower AUC than the external test set indicates both reduced transportability and the lower MoCA-defined CI prevalence in this cohort, and supports interpreting this cohort as a proof-of-concept feasibility evaluation. Larger and more representative community studies, improved calibration, and explicit threshold evaluation are required before REMoCA can be considered for triage, referral, or population-level deployment.
This study has several limitations. First, the model detects MoCA-defined CI (defined by MoCA <26) rather than a clinical diagnosis of mild cognitive impairment or dementia. Although it is widely used for cognitive screening, MoCA is not a diagnostic reference standard. It is influenced by education, culture, visual input, motor demands, and comprehension of instructions. Nonetheless, its high sensitivity for detecting cognitive impairment makes MoCA-defined CI an appropriate target for a screening-oriented tool such as REMoCA, which is intended to identify individuals for further assessment rather than to establish a diagnosis.[7] Second, near VA was the only visual-function measure available. Because the EM targets were high-contrast stimuli presented in black and white at a near viewing distance, near VA was considered the visual-function measure most directly relevant to resolving the targets in this paradigm. Assessing additional dimensions, including contrast sensitivity, visual fields, glare, ocular alignment, ocular disease severity, and oculomotor control, would have been time-consuming and costly and was not feasible in the present study. Our findings therefore relate specifically to near VA and remain to be extended to other dimensions of visual function. Third, the development dataset of REMoCA combined hospital-based and screening-program participants with heterogeneous disease spectra. This heterogeneity, together with the high prevalence of MoCA <26 (75.86%), may introduce spectrum bias and limit transportability to lower-prevalence community settings. Fourth, the use of a dichotomized MoCA total score also provides a coarser characterization of cognition than domain-level assessment, and the relationship between antisaccadic performance and the individual MoCA domains remains to be examined. Finally, the WML/Fazekas analysis was exploratory, restricted to participants with MoCA <26 who underwent MRI examination. It cannot be generalized to the entire cohort or interpreted as a WML diagnostic model. The extensive subgroup analyses were likewise exploratory, given the limited number of participants available within subgroups. In the future, representative cohorts with comprehensive visual and neuropsychological assessment, external validation in fully independent settings, and explicit evaluation of calibration and decision thresholds are needed before clinical deployment.
In conclusion, among the five EM paradigms examined, the AST most consistently discriminated between the MoCA-defined CI and non-CI groups, retaining significant separation across the VA strata examined. Building on this finding, we developed REMoCA, an AST-centered framework that detected MoCA-defined CI in an external test set and remained feasible in a prospective community-based proof-of-concept cohort. Together, these findings position rapid, AST-based assessment as a candidate, VA-tolerant basis for advancing cognitive screening in older adults, pending validation in larger, independent cohorts.
Acknowledgments
The authors would like to express their sincere thanks to Shanghai Qingyan Technology Co., Ltd. for providing the eye trackers used in this research, and to the National Supercomputer Center in Guangzhou for making high-performance computational resources available.
Author contributions
(I) Conception and design: Haotian Lin, Yamei Tang, Xun Wang, Shuyi Zhang, Zhenzhe Lin, Lanqin Zhao
(II) Administrative support: Haotian Lin, Yamei Tang, Dongni Wang, Xulin Zhang, Meimei Dongye, Yi Li
(III) Provision of study materials or patients: Shuyi Zhang, Jia Wang, Yanting Chen, Dong Zheng,
(IV) Data Collection/Aggregation: Jia Wang, Yanting Chen, Xueer Tu, Yunjian Huang, Xiaoming Zhou, Nannan Pan, Yayong Cui, Junhua Xu
(V) Data analysis and interpretation: Xun Wang, Shuyi Zhang, Zhenzhe Lin, Carol Yim-Lui Cheung, Wei Wang, Lanqin Zhao, Duoru Lin, Xiaohang Wu, Yahan Yang, Dongyuan Yun, Zhenzhen Liu, Jason C. Yam
(VI) Manucript writing: All authors
(VII) Final approval of manuscript: All authors
Conflict of interests
The author disclose that the corresponding author, Haotian Lin, serves as Editor-in-Chief of Eye Science. To avoid any potential conflict of interest, the editorial handling of this manuscript was assigned to an independent editor, and the authors were not involved in the peer-review or decision-making process. All editorial procedures were conducted in accordance with COPE guidelines and the journal's standard policies. The authors declare no other competing financial or non-financial interests relevant to this work.
Patient consent for publication
Written informed consent was obtained from all participants or their legal guardians in accordance with ethical guidelines.
Ethics approval and consent to participate
This study adhered to the tenets of the Declaration of Helsinki and was approved by the Institutional Review Board of Zhongshan Ophthalmic Center, Sun Yat-sen University. It was prospectively registered with the Clinical Research Internal Management System of Zhongshan Ophthalmic Center and with ClinicalTrials.gov (NCT04236375).
Data availability statement
Due to patient privacy and ethical restrictions, the raw clinical data cannot be shared publicly. The de-identified demo data can also be requested for nonprofit academic research by the corresponding author (HL; linht5@mail.sysu.edu.cn), following review by the data access committee at the State Key Laboratory of Ophthalmology, Zhongshan Ophthalmic Centre. The source code for our model is available on GitHub (https://github.com/huapu4/REMoCA).
Declaration of generative AI use
In the preparation of this manuscript, the authors used ChatGPT (GPT-5.5) for English language polishing. After using this tool, the authors reviewed and edited the content as necessary and take full responsibility for the content of this publication.
Supplementary materials
Supplementary Figures
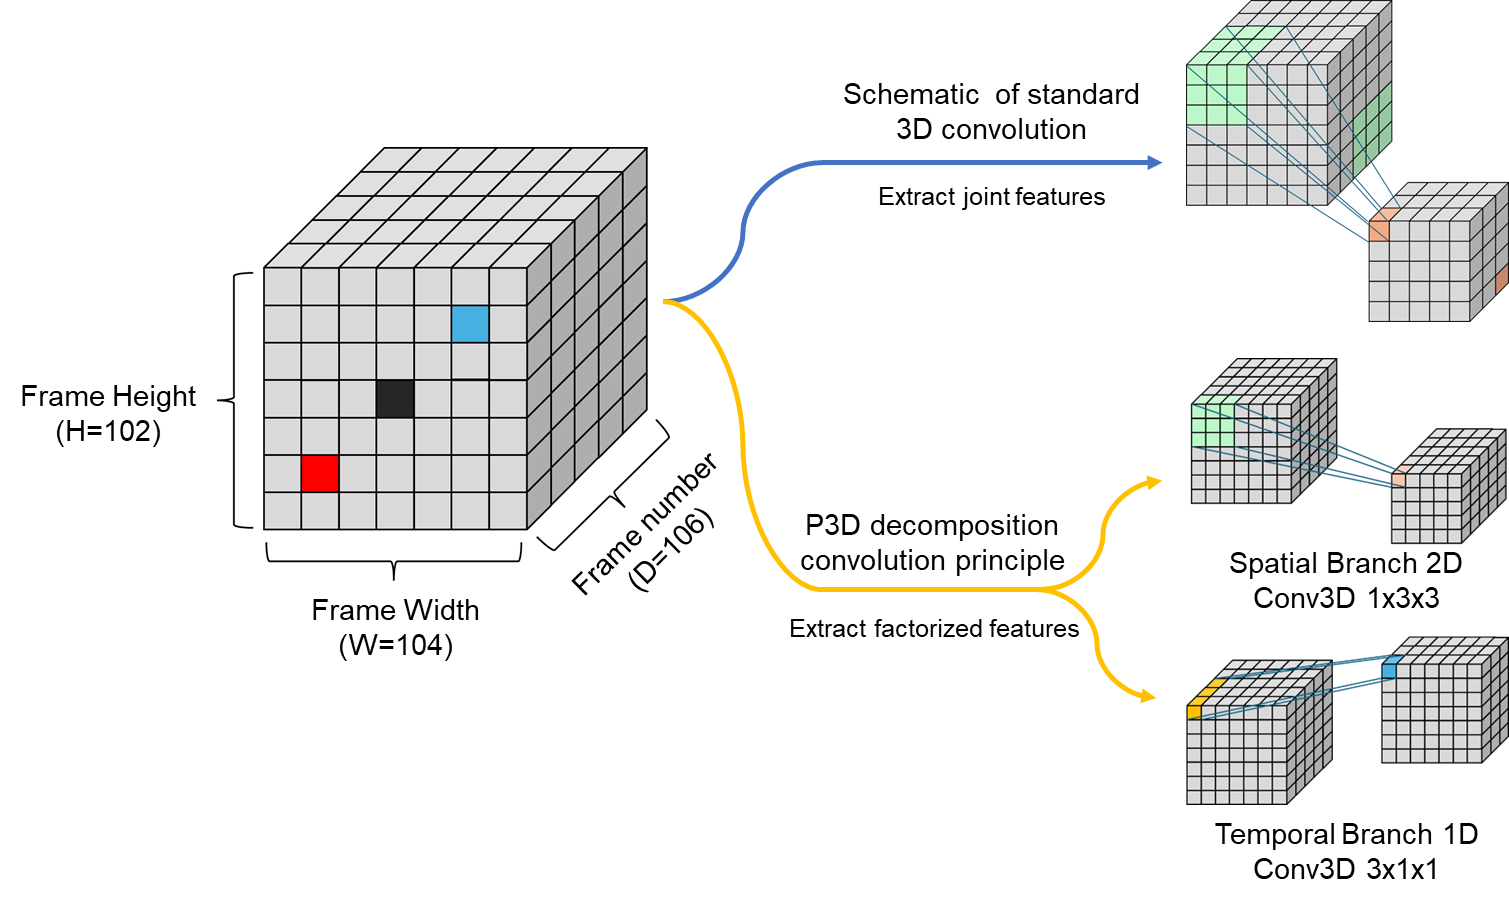
Comparison of feature extraction along the temporal and spatial dimensions between conventional convolutional neural networks and the P3D network used in this study. P3D, pseudo-3D residual network.
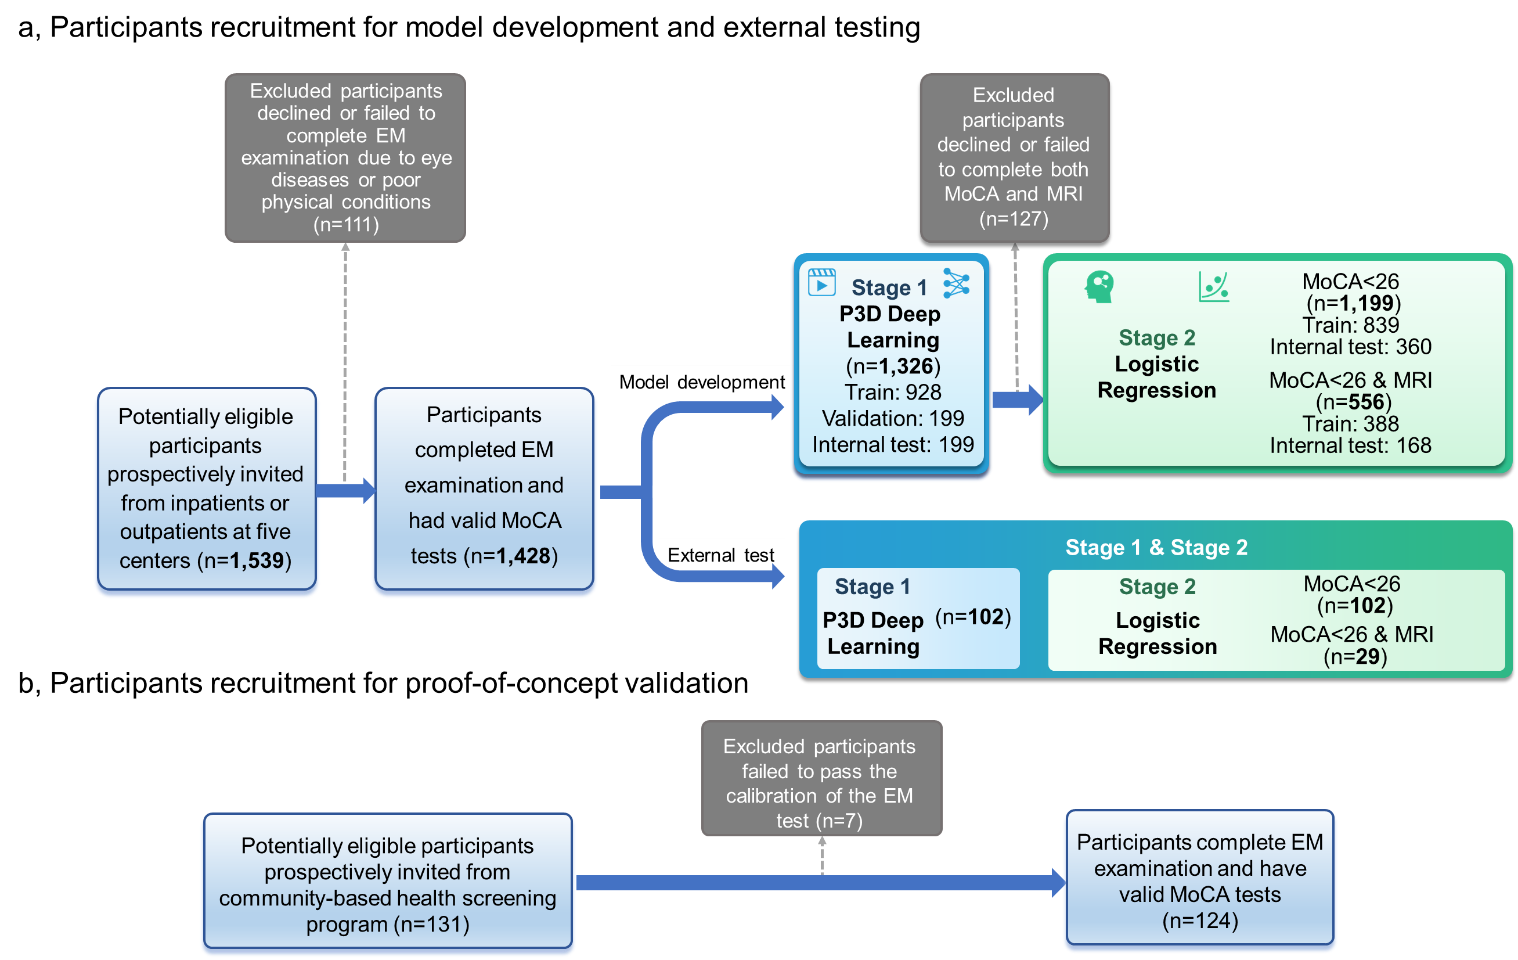
a, Participant recruitment in model development and external testing. b, Participant recruitment in a prospective proof-of-concept cohort. EM, eye movement; MoCA, Montreal Cognitive Assessment; MRI, magnetic resonance imaging; P3D, pseudo-3D residual network.
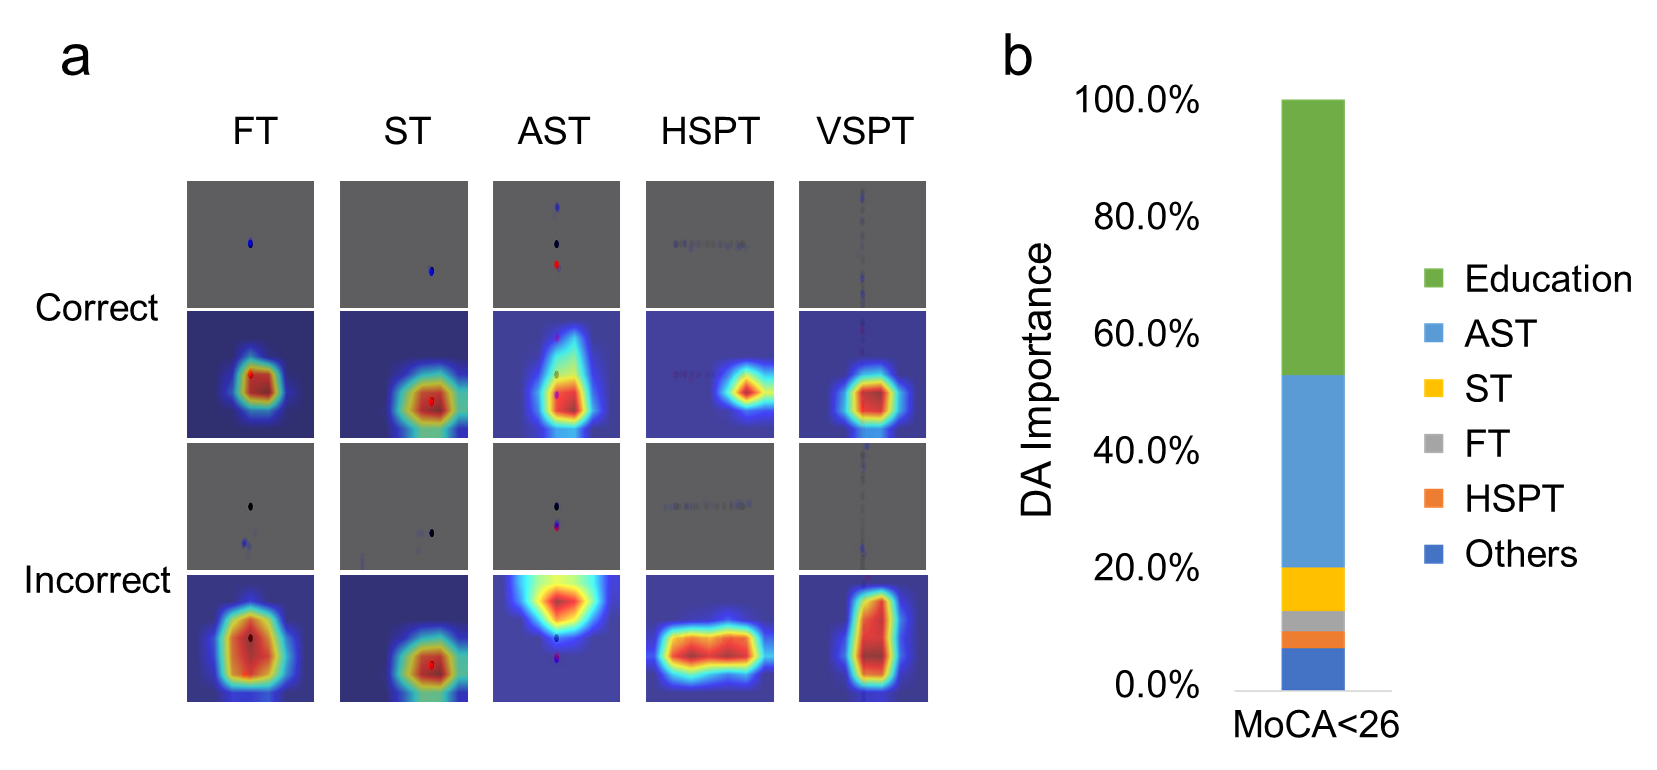
a, Heatmaps derived from EM videos showing correct and incorrect performances in each EM task. The heatmaps were generated from all frames of the original EM videos. b, Relative importance of risk factors and EM tasks for detecting MoCA-defined cognitive impairment, as estimated by DA. Education level showed the greatest contribution (0.466), followed by AST (0.325), ST (0.074), FT (0.034), and HSPT (0.028). The remaining contribution was accounted for by other variables (age, history of hypertension, VSPT, history of diabetes, and sex; 0.073). FT, fixation task; ST, saccadic task; AST, antisaccadic task; HSPT, horizontal smooth pursuit task; VSPT, vertical smooth pursuit task; DA, dominance analysis; EM, eye movement.
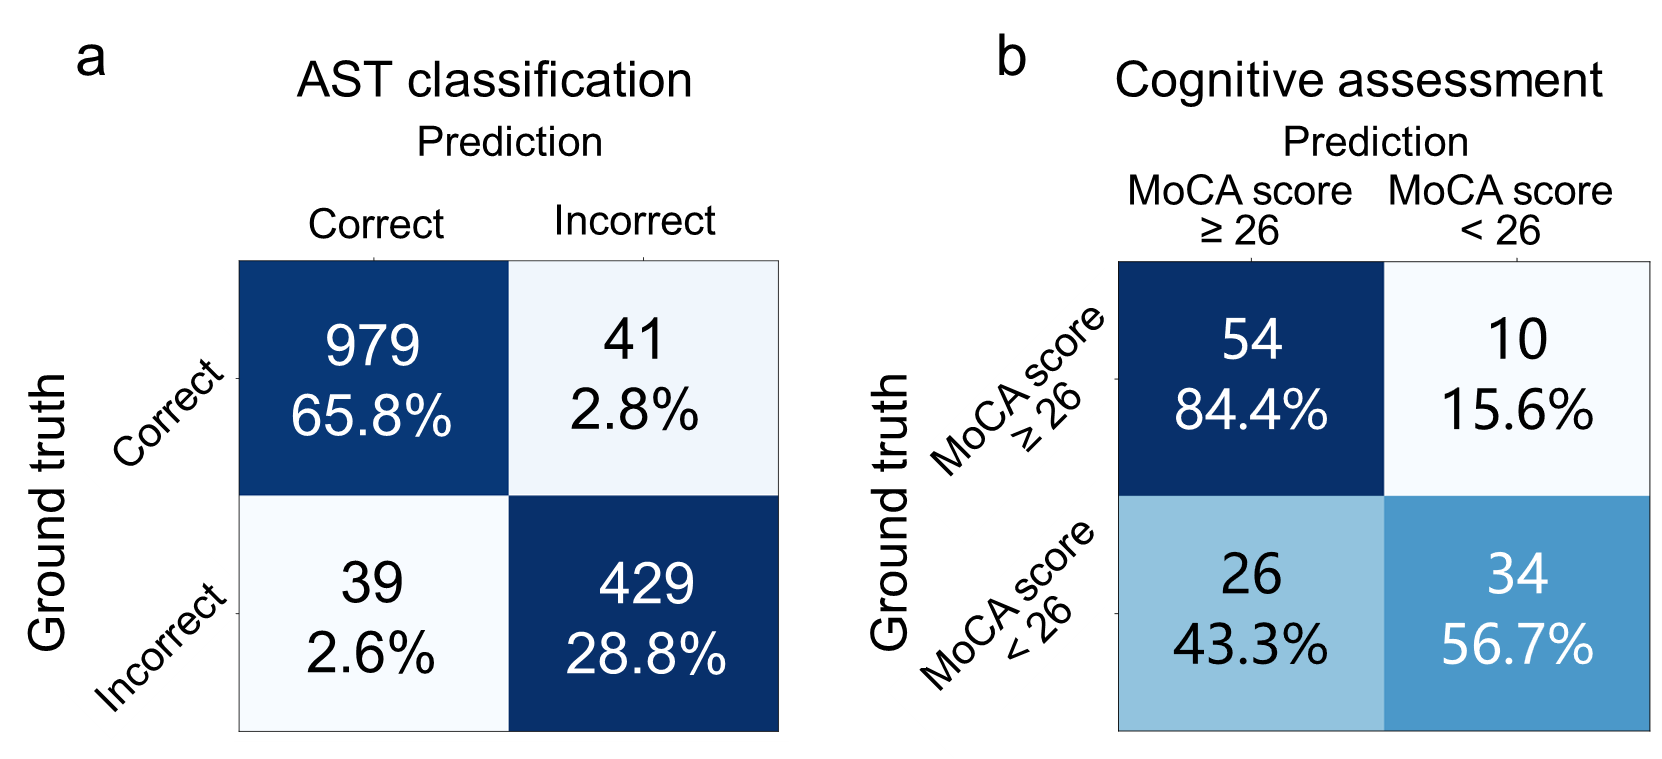
a, The stage-one network for classification of incorrect AST performance. b, The stage-two network for MoCA-defined cognitive impairment classification. AST, antisaccadic task; MoCA, Montreal Cognitive Assessment.
Supplementary Tables
|
Development stage |
Hyperparameters |
Initial setting |
|
First stage network |
Model architecture |
Pseudo-3D residual network |
|
Video shape |
224 × 224 × 20 (height × width × depth) |
|
|
Frame number |
Fixation task: 19 Saccades task: 14 Anti-saccades task: 20 Horizontal smooth pursuit task: 25 Vertical smooth pursuit task: 25 |
|
|
Batch size |
100 |
|
|
Optimizer |
Stochastic gradient descent with momentum = 0.9, weight decay = 5 × 10⁻⁴ |
|
|
Initial learning rate |
5 × 10⁻⁴ |
|
|
Learning rate scheduler |
StepLR with step size = 10, gamma = 0.1 |
|
|
Epochs for training |
500 |
|
|
Dataset proportion |
Train: Validation: Test = 7:1.5:1.5 |
|
|
Second stage network |
Algorithm |
Logistic regression |
|
Penalty |
L1 regularization |
|
|
Class weight |
Balanced: adjust weights in inverse proportion |
|
|
Solver |
Liblinear |
|
|
Dataset proportion |
Train: Validation = 7:3 |
|
|
SYMH (outpatients) |
HH |
ZOC |
|
Total number of participants |
41 |
33 |
28 |
|
Age, years |
|
|
|
|
Median (IQR) |
61 (17) |
65 (12) |
69 (13.25) |
|
Range |
50–85 |
53–87 |
52–82 |
|
Sex |
|
|
|
|
Men |
28 (68.3%) |
20 (60.6%) |
9 (32.1%) |
|
Women |
13 (31.7%) |
13 (39.4%) |
19 (67.9%) |
|
Education, years |
|
|
|
|
Median (IQR) |
12 (3) |
9 (3) |
12 (4) |
|
Range |
3–16 |
3–16 |
0–19 |
|
Near visual acuity (logMAR) |
|
|
|
|
Median (IQR) |
0.15 (0.20) |
0.22 (0.15) |
0.30 (0.09) |
|
Range |
0–0.52 |
0–0.52 |
0.22–0.40 |
|
MoCA |
|
|
|
|
Median (IQR) |
21 (6) |
18 (10) |
21 (6.25) |
|
Range |
10–30 |
3–27 |
5–29 |
|
Fazekas scale among participants with MoCA <26 |
|
|
|
|
Median (IQR) |
2 (1)a |
2 (3.25)b |
NA |
|
Range |
1–4 |
0–6 |
NA |
|
No. of participants with hypertension |
13 (31.7%) |
15 (45.5%) |
19 (67.9%) |
|
No. of participants with diabetes |
6 (14.6%) |
10 (30.3%) |
11 (39.3%) |
|
Note: The SYMH (outpatients) dataset was from the Department of Neurology at Sun Yat-sen Memorial Hospital (outpatients), the HH dataset was from the Department of Neurology at Huiai Hospital (inpatients), and the ZOC dataset was from the Department of Cataract at Zhongshan Ophthalmic Center (outpatients). MoCA <26 was used as the study definition of probable cognitive impairment. a, subset analysis of five participants with a valid Fazekas scale; b, subset analysis of 24 participants with a valid Fazekas scale. MoCA, Montreal Cognitive Assessment. |
|||
|
|
Internal dataset (n = 805) |
External test set (n = 33) |
|
Number of participants with neurological disorders |
772 (95.9%) |
30 (90.9%) |
|
Neurological disorder distribution of participants |
|
|
|
Cerebrovascular disease |
533 (66.2%) |
20 (60.6%) |
|
Radiation-induced brain necrosis |
110 (13.7%) |
0 (0%) |
|
Mental and behavioral disorders |
90 (11.2%) |
21 (63.6%) |
|
Disorders of vestibular function |
65 (8.1%) |
1 (3.0%) |
|
Peripheral neuropathy |
75 (9.3%) |
0 (0%) |
|
Extrapyramidal and movement disorders |
55 (6.8%) |
1 (3.0%) |
|
Headache |
29 (3.6%) |
2 (6.1%) |
|
Epilepsy |
29 (3.6%) |
0 (0%) |
|
Other disorders of the nervous system |
113 (14.0%) |
4 (12.1%) |
|
Number of participants with one neurological disorder |
492 (61.1%) |
11 (33.3%) |
|
Number of participants with more than one neurological disorder |
280 (36.3%) |
18 (54.5%) |
|
Note: Unless otherwise specified, data is presented as n (%). Participants from the neurology departments included inpatients from Sun Yat-sen Memorial Hospital and Huiai Hospital. |
||
|
|
Non-CI Group |
CI Group |
||||
|
|
High-VA stratum (≤0.3) |
Intermediate-VA stratum (0.3–0.5) |
Low-VA stratum (>0.5) |
High-VA stratum (≤0.3) |
Intermediate-VA stratum (0.3–0.5) |
Low-VA stratum (>0.5) |
|
No. of participants |
134 |
124 |
41 |
554 |
261 |
98 |
|
Age, years |
|
|
|
|
|
|
|
Mean (SD) |
68.22 (6.25) |
67.73 (6.06) |
67.10 (7.94) |
66.47 (8.25) |
65.74 (7.48) |
62.70 (9.87) |
|
Range |
50–82 |
52–81 |
50–82 |
50–88 |
50–87 |
50–87 |
|
Sex |
|
|
|
|
|
|
|
Male (%) |
62 (46.27%) |
57 (45.97%) |
20 (48.78%) |
272 (49.10%) |
138 (52.87%) |
44 (44.90%) |
|
Female (%) |
72 (53.73%) |
67 (54.03%) |
21 (51.21%) |
282 (50.90%) |
123 (47.13%) |
54 (55.10%) |
|
Education, years |
|
|
|
|
|
|
|
Mean (SD) |
13.28 (2.99) |
13.99 (2.71) |
14.73 (2.35) |
9.95 (4.25) |
11.22 (3.69) |
11.16 (3.60) |
|
Range |
0–19 |
6–19 |
9–19 |
0–19 |
0–19 |
6–19 |
|
No. of participants with hypertension (%) |
53 (39.55%) |
41 (33.06%) |
17 (41.46%) |
240 (43.32%) |
94 (36.02%) |
39 (39.80%) |
|
No. of participants with diabetes (%) |
26 (19.40%) |
19 (15.32%) |
2 (4.88%) |
129 (23.29%) |
49 (18.77%) |
23 (23.47%) |
|
Near visual acuity (logMAR) |
|
|
|
|
|
|
|
Median (IQR) |
0.15 (0.12) |
0.30 (0.10) |
0.52 (0.18) |
0.15 (0.12) |
0.30 (0.10) |
0.52 (0.18) |
|
Range |
-0.08–0.22 |
0.30–0.40 |
0.52–1.30 |
-0.08–0.22 |
0.30–0.40 |
0.52–1.00 |
|
MoCA score |
|
|
|
|
|
|
|
Median (IQR) |
27 (2) |
27 (1.25) |
27 (2) |
19 (7) |
21 (6) |
21 (5.75) |
|
Range |
26–30 |
26–30 |
26–30 |
3–25 |
3–25 |
9–25 |
|
Note: Data are presented as the n, n (%), mean (SD), median (IQR), and range unless otherwise specified. CI, MoCA-defined cognitive impairment |
||||||
|
|
|
AUC (95% CI) |
ACC (95% CI) |
SEN (95% CI) |
SPE (95% CI) |
PPV (95% CI) |
NPV (95% CI) |
F1 score (95% CI) |
|
Internal test set |
|
|
|
|
|
|
|
|
|
|
FT |
0.990 (0.984–0.995) |
0.952 (0.941–0.963) |
0.947 (0.936–0.959) |
0.960 (0.949–0.970) |
0.974 (0.966–0.982) |
0.919 (0.905–0.933) |
0.960 (0.951–0.970) |
|
|
ST |
0.979 (0.972–0.986) |
0.933 (0.920–0.945) |
0.924 (0.911–0.937) |
0.943 (0.931–0.954) |
0.949 (0.938–0.960) |
0.915 (0.902–0.929) |
0.936 (0.924–0.948) |
|
|
AST |
0.967 (0.958–0.975) |
0.929 (0.917–0.940) |
0.922 (0.909–0.934) |
0.938 (0.927–0.949) |
0.952 (0.943–0.962) |
0.899 (0.885–0.913) |
0.937 (0.926–0.948) |
|
|
HSPT |
0.910 (0.893–0.928) |
0.884 (0.865–0.904) |
0.929 (0.914–0.945) |
0.842 (0.820–0.865) |
0.844 (0.822–0.866) |
0.928 (0.913–0.944) |
0.885 (0.865–0.904) |
|
|
VSPT |
0.938 (0.924–0.953) |
0.868 (0.848–0.889) |
0.900 (0.882–0.918) |
0.824 (0.801–0.847) |
0.878 (0.858–0.897) |
0.855 (0.834–0.876) |
0.889 (0.870–0.908) |
|
External test set |
|
|
|
|
|
|
|
|
|
|
FT |
0.972 (0.963–0.981) |
0.920 (0.905–0.934) |
0.896 (0.880–0.912) |
0.950 (0.939–0.962) |
0.958 (0.947–0.968) |
0.879 (0.861–0.896) |
0.926 (0.912–0.940) |
|
|
ST |
0.970 (0.960–0.979) |
0.904 (0.889–0.920) |
0.828 (0.808–0.848) |
0.992 (0.987–0.997) |
0.992 (0.987–0.997) |
0.834 (0.815–0.854) |
0.902 (0.887–0.918) |
|
|
AST |
0.986 (0.980–0.991) |
0.949 (0.938–0.959) |
0.966 (0.957–0.974) |
0.924 (0.911–0.936) |
0.950 (0.940–0.960) |
0.947 (0.937–0.958) |
0.958 (0.948–0.967) |
|
|
HSPT |
0.948 (0.935–0.961) |
0.907 (0.890–0.924) |
0.928 (0.912–0.943) |
0.876 (0.857–0.895) |
0.919 (0.904–0.935) |
0.888 (0.869–0.906) |
0.924 (0.908–0.939) |
|
|
VSPT |
0.937 (0.923–0.951) |
0.886 (0.867–0.904) |
0.916 (0.900–0.933) |
0.856 (0.836–0.877) |
0.859 (0.838–0.879) |
0.915 (0.899–0.931) |
0.887 (0.868–0.905) |
|
Prospective proof-of-concept cohort |
|
|
|
|
|
|||
|
|
AST |
0.980 (0.973–0.987) |
0.948 (0.937–0.958) |
0.924 (0.912–0.937) |
0.958 (0.948–0.968) |
0.907 (0.893–0.921) |
0.966 (0.958–0.975) |
0.916 (0.902–0.929) |
|
Note: AUC, area under the receiver operating characteristic curve; ACC, accuracy; SEN, sensitivity; SPE, specificity; PPV, positive predictive value; NPV, negative predictive value; 95% CI, 95% confidence interval; FT, fixation task; ST, saccadic task; AST, antisaccadic task; HSPT, horizontal smooth pursuit task; VSPT, vertical smooth pursuit task. |
||||||||
|
|
AUC (95% CI) |
ACC (95% CI) |
SEN (95% CI) |
SPE (95% CI) |
PPV (95% CI) |
NPV (95% CI) |
F1 score (95% CI) |
|
Internal test set |
|
|
|
|
|
|
|
|
RF MLM (Threshold = 0.580) |
0.778 (0.735–0.821) |
0.633 (0.584-0.683) |
0.550 (0.498-0.601) |
0.888 (0.855-0.920) |
0.937 (0.912-0.962) |
0.393 (0.343-0.443) |
0.693 (0.645-0.741) |
|
EM MLM (Threshold = 0.500) |
0.771 (0.727–0.814) |
0.708 (0.661-0.755) |
0.694 (0.646-0.741) |
0.753 (0.708-0.797) |
0.895 (0.864-0.927) |
0.447 (0.395-0.498) |
0.782 (0.739-0.824) |
|
Hybrid MLM (Threshold = 0.588) |
0.819 (0.779–0.858) |
0.700 (0.653-0.747) |
0.649 (0.600-0.699) |
0.854 (0.817-0.890) |
0.931 (0.905-0.957) |
0.444 (0.393-0.496) |
0.765 (0.721-0.809) |
|
External test set |
|
|
|
|
|
|
|
|
RF MLM (Threshold = 0.580) |
0.818 (0.743–0.893) |
0.647 (0.554-0.740) |
0.600 (0.505-0.695) |
0.882 (0.820-0.945) |
0.962 (0.925-0.999) |
0.306 (0.217-0.396) |
0.739 (0.654-0.824) |
|
EM MLM (Threshold = 0.590) |
0.841 (0.770–0.912) |
0.735 (0.650-0.821) |
0.718 (0.630-0.805) |
0.824 (0.750-0.898) |
0.953 (0.912-0.994) |
0.368 (0.275-0.462) |
0.819 (0.744-0.894) |
|
Hybrid MLM (Threshold = 0.400) |
0.892 (0.832–0.952) |
0.912 (0.857-0.967) |
0.953 (0.912-0.994) |
0.706 (0.617-0.794) |
0.942 (0.896-0.987) |
0.750 (0.666-0.834) |
0.947 (0.904-0.991) |
|
Note: AUC, area under the receiver operating characteristic curve; ACC, accuracy; SEN, sensitivity; SPE, specificity; PPV, positive predictive value; NPV, negative predictive value; 95% CI, 95% confidence interval; RF, risk factors; EM, eye movement; MLM, machine-learning model. |
|||||||
|
Model |
AUC (95% CI) |
ΔAUC vs REMoCA (95% CI) |
P value (DeLong test) |
|
REMoCA (reference) |
0.907 (0.850–0.963) |
— |
— |
|
RF MLM |
0.818 (0.743–0.893) |
+0.089 (+0.019 to +0.158) |
0.012 |
|
EM MLM |
0.841 (0.770–0.912) |
+0.066 (+0.005 to +0.127) |
0.035 |
|
Hybrid MLM |
0.892 (0.832–0.952) |
+0.015 (−0.014 to +0.043) |
0.321 |
|
Note: These comparisons were prespecified against a single reference model, and P values were therefore not corrected for multiple comparisons. AUC, area under the receiver operating characteristic curve; ΔAUC, difference in AUC (REMoCA minus comparator); 95% CI, 95% confidence interval; RF, risk factors; EM, eye movement; MLM, machine-learning model; REMoCA, rapid eye-movement-based cognitive assessment. |
|||
|
|
AUC (95% CI) |
ACC (95% CI) |
SEN (95% CI) |
SPE (95% CI) |
PPV (95% CI) |
NPV (95% CI) |
F1 score (95% CI) |
|
Internal test set |
|
|
|
|
|
|
|
|
REMoCA (Threshold = 0.505) |
0.792 |
0.743 (0.676-0.809) |
0.750 (0.684-0.816) |
0.740 (0.674-0.807) |
0.476 (0.400-0.552) |
0.904 (0.859-0.949) |
0.583 (0.508-0.657) |
|
RF MLM (Threshold = 0.395) |
0.788 |
0.647 (0.574-0.719) |
0.875 (0.825-0.925) |
0.575 (0.500-0.650) |
0.393 (0.319-0.467) |
0.936 (0.899-0.973) |
0.543 (0.467-0.618) |
|
EM MLM (Threshold = 0.524) |
0.789 |
0.671 (0.599-0.742) |
0.575 (0.500-0.650) |
0.701 (0.631-0.770) |
0.377 (0.304-0.451) |
0.840 (0.784-0.895) |
0.455 (0.380-0.531) |
|
Hybrid MLM (Threshold = 0.525) |
0.621 |
0.778 (0.715-0.841) |
0.725 (0.657-0.793) |
0.795 (0.734-0.856) |
0.527 (0.452-0.603) |
0.902 (0.857-0.947) |
0.611 (0.537-0.684) |
|
External test set |
|
|
|
|
|
|
|
|
REMoCA (Threshold = 0.650) |
0.691 |
0.724 (0.561-0.887) |
0.500 (0.318-0.682) |
0.882 (0.765-1.000) |
0.750 (0.592-0.908) |
0.714 (0.550-0.879) |
0.600 (0.422-0.778) |
|
RF MLM (Threshold = 0.308) |
0.642 |
0.621 (0.444-0.797) |
0.917 (0.816-1.000) |
0.412 (0.233-0.591) |
0.524 (0.342-0.706) |
0.875 (0.755-0.995) |
0.667 (0.495-0.838) |
|
EM MLM (Threshold = 0.613) |
0.691 |
0.759 (0.603-0.914) |
0.500 (0.318-0.682) |
0.941 (0.856-1.000) |
0.857 (0.730-0.985) |
0.727 (0.565-0.889) |
0.632 (0.456-0.807) |
|
Hybrid MLM (Threshold = 0.650) |
0.735 |
0.724 (0.561-0.887) |
0.500 (0.318-0.682) |
0.882 (0.765-1.000) |
0.750 (0.592-0.908) |
0.714 (0.550-0.879) |
0.600 (0.422-0.778) |
|
Note: AUC, area under the receiver operating characteristic curve; ACC, accuracy; SEN, sensitivity; SPE, specificity; PPV, positive predictive value; NPV, negative predictive value; 95% CI, 95% confidence interval; RF, risk factors; EM, eye movement; MLM, machine-learning model. |
|||||||
|
|
AUC (95% CI) |
ACC (95% CI) |
SEN (95% CI) |
SPE (95% CI) |
PPV (95% CI) |
NPV (95% CI) |
F1 score (95% CI) |
||||
|
Male |
|
|
|
|
|
|
|
||||
|
REMoCA |
0.970 (0.926–1.000) |
0.930 (0.864-0.996) |
0.932 (0.866-0.997) |
0.923 (0.854-0.992) |
0.976 (0.937-1.000) |
0.800 (0.696-0.904) |
0.953 (0.899-1.000) |
||||
|
RF MLM |
0.890 (0.809–0.971) |
0.702 |
0.614 |
1.000 |
1.000 |
0.433 |
0.761 |
||||
|
EM MLM |
0.888 (0.806–0.970) |
0.754 (0.643-0.866) |
0.705 (0.586-0.823) |
0.923 (0.854-0.992) |
0.969 (0.924-1.000) |
0.480 (0.350-0.610) |
0.816 (0.715-0.916) |
||||
|
Hybrid MLM |
0.970 (0.926–1.000) |
0.930 (0.864-0.996) |
0.977 (0.939-1.000) |
0.769 (0.660-0.879) |
0.935 (0.871-0.999) |
0.909 (0.834-0.984) |
0.956 (0.902-1.000) |
||||
|
Female |
|
|
|
|
|
|
|
||||
|
REMoCA |
0.720 (0.588–0.851) |
0.867 (0.767-0.966) |
0.902 (0.816-0.989) |
0.500 (0.354-0.646) |
0.949 (0.884-1.000) |
0.333 (0.196-0.471) |
0.925 (0.848-1.000) |
||||
|
RF MLM |
0.704 (0.571–0.838) |
0.578 |
0.585 |
0.500 |
0.923 |
0.105 |
0.716 |
||||
|
EM MLM |
0.677 (0.540–0.813) |
0.711 (0.579-0.844) |
0.732 (0.602-0.861) |
0.500 (0.354-0.646) |
0.938 (0.867-1.000) |
0.154 (0.048-0.259) |
0.822 (0.710-0.934) |
||||
|
Hybrid MLM |
0.701 (0.567–0.835) |
0.889 (0.797-0.981) |
0.927 (0.851-1.000) |
0.500 (0.354-0.646) |
0.950 (0.886-1.000) |
0.400 (0.257-0.543) |
0.938 (0.868-1.000) |
||||
|
Aged ≤ 65 |
|
|
|
|
|
|
|
||||
|
REMoCA |
0.939 (0.873–1.000) |
0.902 (0.820-0.984) |
0.900 (0.818-0.982) |
0.909 (0.830-0.988) |
0.973 (0.928-1.000) |
0.714 (0.590-0.838) |
0.935 (0.867-1.000) |
||||
|
RF MLM |
0.830 (0.726–0.933) |
0.667 |
0.575 |
1.000 |
1.000 |
0.393 |
0.730 |
||||
|
EM MLM |
0.855 (0.758–0.951) |
0.627 (0.495-0.760) |
0.550 (0.413-0.687) |
0.909 (0.830-0.988) |
0.957 (0.901-1.000) |
0.357 (0.226-0.489) |
0.698 (0.572-0.824) |
||||
|
Hybrid MLM |
0.936 (0.869–1.000) |
0.882 (0.794-0.971) |
0.925 (0.853-0.997) |
0.727 (0.605-0.850) |
0.925 (0.853-0.997) |
0.727 (0.605-0.850) |
0.925 (0.853-0.997) |
||||
|
Aged > 65 |
|
|
|
|
|
|
|
||||
|
REMoCA |
0.819 (0.713–0.924) |
0.902 (0.820-0.984) |
0.933 (0.865-1.000) |
0.667 (0.537-0.796) |
0.955 (0.897-1.000) |
0.571 (0.436-0.707) |
0.944 (0.881-1.000) |
||||
|
RF MLM |
0.828 (0.724–0.931) |
0.627 |
0.622 |
0.667 |
0.933 |
0.190 |
0.747 |
||||
|
EM MLM |
0.796 (0.686–0.907) |
0.882 (0.794-0.971) |
0.933 (0.865-1.000) |
0.500 (0.363-0.637) |
0.933 (0.865-1.000) |
0.500 (0.363-0.637) |
0.933 (0.865-1.000) |
||||
|
Hybrid MLM |
0.815 (0.708–0.921) |
0.804 (0.695-0.913) |
0.822 (0.717-0.927) |
0.667 (0.537-0.796) |
0.949 (0.888-1.000) |
0.333 (0.204-0.463) |
0.881 (0.792-0.970) |
||||
|
Education level ≤ 9 years |
|
|
|
|
|||||||
|
REMoCA |
0.646 (0.513–0.778) |
0.846 (0.748-0.944) |
0.811 (0.704-0.917) |
0.933 (0.866-1.000) |
0.968 (0.920-1.000) |
0.667 (0.539-0.795) |
0.882 (0.795-0.970) |
||||
|
RF MLM |
0.922 (0.847–0.996) |
0.346 |
0.081 |
1.000 |
1.000 |
0.306 |
0.150 |
||||
|
EM MLM |
0.490 (0.351–0.628) |
0.731 (0.610-0.851) |
0.649 (0.519-0.778) |
0.933 (0.866-1.000) |
0.960 (0.907-1.000) |
0.519 (0.383-0.654) |
0.774 (0.661-0.888) |
||||
|
Hybrid MLM |
0.635 (0.502–0.769) |
0.865 (0.773-0.958) |
0.892 (0.807-0.976) |
0.800 (0.691-0.909) |
0.917 (0.842-0.992) |
0.750 (0.632-0.868) |
0.904 (0.824-0.984) |
||||
|
Education level > 9 years |
|
|
|
|
|||||||
|
REMoCA |
0.903 (0.822–0.983) |
0.960 (0.906-1.000) |
1.000 (1.000-1.000) |
0.000 (0.000-0.000) |
0.960 (0.906-1.000) |
0.000 (0.000-0.000) |
0.980 (0.940-1.000) |
||||
|
RF MLM |
0.685 (0.558–0.811) |
0.960 |
1.000 |
0.000 |
0.960 |
0.000 |
0.980 |
||||
|
EM MLM |
0.856 (0.760–0.951) |
0.740 (0.618-0.862) |
0.771 (0.654-0.887) |
0.000 (0.000-0.000) |
0.949 (0.888-1.000) |
0.000 (0.000-0.000) |
0.851 (0.752-0.949) |
||||
|
Hybrid MLM |
0.901 (0.820–0.982) |
0.960 (0.906-1.000) |
1.000 (1.000-1.000) |
0.000 (0.000-0.000) |
0.960 (0.906-1.000) |
0.000 (0.000-0.000) |
0.980 (0.940-1.000) |
||||
|
With hypertension |
|
|
|
|
|
|
|||||
|
REMoCA |
0.940 (0.874–1.000) |
0.960 (0.906-1.000) |
0.975 (0.932-1.000) |
0.900 (0.817-0.983) |
0.975 (0.932-1.000) |
0.900 (0.817-0.983) |
0.975 (0.932-1.000) |
||||
|
RF MLM |
0.906 (0.825–0.987) |
0.680 |
0.625 |
0.900 |
0.962 |
0.375 |
0.758 |
||||
|
EM MLM |
0.878 (0.787–0.968) |
0.800 (0.689-0.911) |
0.800 (0.689-0.911) |
0.800 (0.689-0.911) |
0.941 (0.876-1.000) |
0.500 (0.361-0.639) |
0.865 (0.770-0.960) |
||||
|
Hybrid MLM |
0.935 (0.867–1.000) |
0.940 (0.874-1.000) |
0.975 (0.932-1.000) |
0.800 (0.689-0.911) |
0.951 (0.892-1.000) |
0.889 (0.802-0.976) |
0.963 (0.911-1.000) |
||||
|
Without hypertension |
|
|
|
|
|
||||||
|
REMoCA |
0.822 (0.718–0.926) |
0.846 (0.748-0.944) |
0.867 (0.774-0.959) |
0.714 (0.591-0.837) |
0.951 (0.893-1.000) |
0.455 (0.319-0.590) |
0.907 (0.828-0.986) |
||||
|
RF MLM |
0.717 (0.595–0.840) |
0.615 |
0.578 |
0.857 |
0.963 |
0.240 |
0.722 |
||||
|
EM MLM |
0.778 (0.665–0.891) |
0.673 (0.546-0.801) |
0.644 (0.514-0.775) |
0.857 (0.762-0.952) |
0.967 (0.918-1.000) |
0.273 (0.152-0.394) |
0.773 (0.660-0.887) |
||||
|
Hybrid MLM |
0.822 (0.718–0.926) |
0.885 (0.798-0.971) |
0.933 (0.866-1.000) |
0.571 (0.437-0.706) |
0.933 (0.866-1.000) |
0.571 (0.437-0.706) |
0.933 (0.866-1.000) |
||||
|
With diabetes |
|
|
|
|
|
|
|
||||
|
REMoCA |
1.000 (1.000–1.000) |
0.964 (0.896-1.000) |
0.957 (0.881-1.000) |
1.000 (1.000-1.000) |
1.000 (1.000-1.000) |
0.833 (0.695-0.971) |
0.978 (0.923-1.000) |
||||
|
RF MLM |
0.939 (0.851–1.000) |
0.786 |
0.739 |
1.000 |
1.000 |
0.455 |
0.850 |
||||
|
EM MLM |
0.922 (0.822–1.000) |
0.893 (0.778-1.000) |
0.870 (0.745-0.994) |
1.000 (1.000-1.000) |
1.000 (1.000-1.000) |
0.625 (0.446-0.804) |
0.930 (0.836-1.000) |
||||
|
Hybrid MLM |
1.000 (1.000–1.000) |
1.000 (1.000-1.000) |
1.000 (1.000-1.000) |
1.000 (1.000-1.000) |
1.000 (1.000-1.000) |
1.000 (1.000-1.000) |
1.000 (1.000-1.000) |
||||
|
Without diabetes |
|
|
|
|
|
|
|
||||
|
REMoCA |
0.848 (0.766–0.930) |
0.878 (0.804-0.953) |
0.903 (0.836-0.971) |
0.750 (0.651-0.849) |
0.949 (0.899-0.999) |
0.600 (0.488-0.712) |
0.926 (0.866-0.985) |
||||
|
RF MLM |
0.743 (0.643–0.842) |
0.595 |
0.548 |
0.833 |
0.944 |
0.263 |
0.694 |
||||
|
EM MLM |
0.782 (0.688–0.876) |
0.676 (0.569-0.782) |
0.661 (0.553-0.769) |
0.750 (0.651-0.849) |
0.932 (0.874-0.989) |
0.300 (0.196-0.404) |
0.774 (0.678-0.869) |
||||
|
Hybrid MLM |
0.845 (0.763–0.928) |
0.878 (0.804-0.953) |
0.935 (0.880-0.991) |
0.583 (0.471-0.696) |
0.921 (0.859-0.982) |
0.636 (0.527-0.746) |
0.928 (0.869-0.987) |
||||
|
With visual impairment |
|
|
|
|
|||||||
|
REMoCA |
0.850 |
0.840 (0.696-0.984) |
0.900 (0.782-1.000) |
0.600 (0.408-0.792) |
0.900 (0.782-1.000) |
0.600 (0.408-0.792) |
0.900 (0.782-1.000) |
||||
|
RF MLM |
0.810 |
0.680 |
0.650 |
0.800 |
0.929 |
0.364 |
0.765 |
||||
|
EM MLM |
0.790 |
0.640 (0.452-0.828) |
0.600 (0.408-0.792) |
0.800 (0.643-0.957) |
0.923 (0.819-1.000) |
0.333 (0.149-0.518) |
0.727 (0.553-0.902) |
||||
|
Hybrid MLM |
0.850 |
0.880 (0.753-1.000) |
0.950 (0.865-1.000) |
0.600 (0.408-0.792) |
0.905 (0.790-1.000) |
0.750 (0.580-0.920) |
0.927 (0.825-1.000) |
||||
|
Without visual impairment |
|||||||||||
|
REMoCA |
0.868 |
0.929 (0.851-1.000) |
0.947 (0.880-1.000) |
0.750 (0.619-0.881) |
0.973 (0.924-1.000) |
0.600 (0.452-0.748) |
0.960 (0.901-1.000) |
||||
|
RF MLM |
0.789 |
0.667 |
0.658 |
0.750 |
0.962 |
0.188 |
0.781 |
||||
|
EM MLM |
0.862 |
0.833 (0.721-0.946) |
0.842 (0.732-0.952) |
0.750 (0.619-0.881) |
0.970 (0.918-1.000) |
0.333 (0.191-0.476) |
0.901 (0.811-0.992) |
||||
|
Hybrid MLM |
0.862 |
0.976 (0.930-1.000) |
1.000 (1.000-1.000) |
0.750 (0.619-0.881) |
0.974 (0.927-1.000) |
1.000 (1.000-1.000) |
0.987 (0.953-1.000) |
||||
|
Note: AUC, area under the receiver operating characteristic curve; ACC, accuracy; SEN, sensitivity; SPE, specificity; PPV, positive predictive value; NPV, negative predictive value; 95% CI, 95% confidence interval; RF, risk factors; EM, eye movement; MLM, machine-learning model; NA, not applicable due to insufficient data; visual impairment was defined as logMAR near VA > 0.3 (equivalent to worse than 20/40 Snellen acuity). |
|||||||||||
|
|
AUC (95% CI) |
ACC (95% CI) |
SEN (95% CI) |
SPE (95% CI) |
PPV (95% CI) |
NPV (95% CI) |
F1 score (95% CI) |
|||
|
Male |
|
|
|
|
|
|
|
|||
|
REMoCA |
0.812 |
0.833 (0.661-1.000) |
0.750 (0.550-0.950) |
0.900 (0.761-1.000) |
0.857 (0.695-1.000) |
0.818 (0.640-0.996) |
0.800 (0.615-0.985) |
|||
|
RF MLM |
0.775 |
0.611 (0.386-0.836) |
0.875 (0.722-1.000) |
0.400 (0.174-0.626) |
0.538 (0.308-0.769) |
0.800 (0.615-0.985) |
0.667 (0.449-0.884) |
|||
|
EM MLM |
0.725 |
0.722 (0.515-0.929) |
0.500 (0.269-0.731) |
0.900 (0.761-1.000) |
0.800 (0.615-0.985) |
0.692 (0.479-0.906) |
0.615 (0.391-0.840) |
|||
|
Hybrid MLM |
0.825 |
0.833 (0.661-1.000) |
0.750 (0.550-0.950) |
0.900 (0.761-1.000) |
0.857 (0.695-1.000) |
0.818 (0.640-0.996) |
0.800 (0.615-0.985) |
|||
|
Female |
|
|
|
|
|
|
|
|||
|
REMoCA |
0.429 |
0.545 (0.251-0.840) |
0.000 (0.000-0.000) |
0.857 (0.650-1.000) |
0.000 (0.000-0.000) |
0.600 (0.310-0.890) |
0.000 (0.000-0.000) |
|||
|
RF MLM |
0.429 |
0.636 (0.352-0.921) |
1.000 (1.000-1.000) |
0.429 (0.136-0.721) |
0.500 (0.205-0.795) |
1.000 (1.000-1.000) |
0.667 (0.388-0.945) |
|||
|
EM MLM |
0.750 |
0.818 (0.590-1.000) |
0.500 (0.205-0.795) |
1.000 (1.000-1.000) |
1.000 (1.000-1.000) |
0.778 (0.532-1.000) |
0.667 (0.388-0.945) |
|||
|
Hybrid MLM |
0.429 |
0.364 (0.079-0.648) |
0.000 (0.000-0.000) |
0.571 (0.279-0.864) |
0.000 (0.000-0.000) |
0.500 (0.205-0.795) |
0.000 (0.000-0.000) |
|||
|
Aged ≤ 65 |
|
|
|
|
|
|
|
|||
|
REMoCA |
0.650 |
0.786 (0.571-1.000) |
0.250 (0.023-0.477) |
1.000 (1.000-1.000) |
1.000 (1.000-1.000) |
0.769 (0.549-0.990) |
0.400 (0.143-0.657) |
|||
|
RF MLM |
0.625 |
0.714 (0.478-0.951) |
0.714 (0.478-0.951) |
0.750 (0.523-0.977) |
0.700 (0.460-0.940) |
0.500 (0.238-0.762) |
0.875 (0.702-1.000) |
|||
|
EM MLM |
0.650 |
0.786 (0.571-1.000) |
0.250 (0.023-0.477) |
1.000 (1.000-1.000) |
1.000 (1.000-1.000) |
0.769 (0.549-0.990) |
0.400 (0.143-0.657) |
|||
|
Hybrid MLM |
0.650 |
0.786 (0.571-1.000) |
0.250 (0.023-0.477) |
1.000 (1.000-1.000) |
1.000 (1.000-1.000) |
0.769 (0.549-0.990) |
0.400 (0.143-0.657) |
|||
|
Aged > 65 |
|
|
|
|
|
|
|
|||
|
REMoCA |
0.643 |
0.667 (0.428-0.905) |
0.625 (0.380-0.870) |
0.714 (0.486-0.943) |
0.714 (0.486-0.943) |
0.625 (0.380-0.870) |
0.667 (0.428-0.905) |
|||
|
RF MLM |
0.536 |
0.533 (0.281-0.786) |
1.000 (1.000-1.000) |
0.000 (0.000-0.000) |
0.533 (0.281-0.786) |
0.000 (0.000-0.000) |
0.696 (0.463-0.929) |
|||
|
EM MLM |
0.732 |
0.733 (0.510-0.957) |
0.625 (0.380-0.870) |
0.857 (0.680-1.000) |
0.833 (0.645-1.000) |
0.667 (0.428-0.905) |
0.714 (0.486-0.943) |
|||
|
Hybrid MLM |
0.661 |
0.667 (0.428-0.905) |
0.625 (0.380-0.870) |
0.714 (0.486-0.943) |
0.714 (0.486-0.943) |
0.625 (0.380-0.870) |
0.667 (0.428-0.905) |
|||
|
Education level ≤ 9 years |
|
|
|
|
||||||
|
REMoCA |
0.675 |
0.818 (0.590-1.000) |
0.600 (0.310-0.890) |
1.000 (1.000-1.000) |
1.000 (1.000-1.000) |
0.750 (0.494-1.000) |
0.750 (0.494-1.000) |
|||
|
RF MLM |
0.649 |
0.636 (0.352-0.921) |
0.800 (0.564-1.000) |
0.500 (0.205-0.795) |
0.571 (0.279-0.864) |
0.750 (0.494-1.000) |
0.667 (0.388-0.945) |
|||
|
EM MLM |
0.636 |
0.818 (0.590-1.000) |
0.600 (0.310-0.890) |
1.000 (1.000-1.000) |
1.000 (1.000-1.000) |
0.750 (0.494-1.000) |
0.750 (0.494-1.000) |
|||
|
Hybrid MLM |
0.675 |
0.818 (0.590-1.000) |
0.600 (0.310-0.890) |
1.000 (1.000-1.000) |
1.000 (1.000-1.000) |
0.750 (0.494-1.000) |
0.750 (0.494-1.000) |
|||
|
Education level > 9 years |
|
|
|
|
||||||
|
REMoCA |
0.700 |
0.667 (0.449-0.884) |
0.429 (0.200-0.657) |
0.818 (0.640-0.996) |
0.600 (0.374-0.826) |
0.692 (0.479-0.906) |
0.500 (0.269-0.731) |
|||
|
RF MLM |
0.633 |
0.611 (0.386-0.836) |
1.000 (1.000-1.000) |
0.364 (0.141-0.586) |
0.500 (0.269-0.731) |
1.000 (1.000-1.000) |
0.667 (0.449-0.884) |
|||
|
EM MLM |
0.867 |
0.722 (0.515-0.929) |
0.429 (0.200-0.657) |
0.909 (0.776-1.000) |
0.750 (0.550-0.950) |
0.714 (0.506-0.923) |
0.545 (0.315-0.775) |
|||
|
Hybrid MLM |
0.700 |
0.667 (0.449-0.884) |
0.429 (0.200-0.657) |
0.818 (0.640-0.996) |
0.600 (0.374-0.826) |
0.692 (0.479-0.906) |
0.500 (0.269-0.731) |
|||
|
With hypertension |
|
|
|
|
|
|
||||
|
REMoCA |
0.722 |
0.750 (0.505-0.995) |
0.833 (0.622-1.000) |
0.667 (0.400-0.933) |
0.714 (0.459-0.970) |
0.800 (0.574-1.000) |
0.769 (0.531-1.000) |
|||
|
RF MLM |
0.556 |
0.500 (0.217-0.783) |
1.000 (1.000-1.000) |
0.000 (0.000-0.000) |
0.500 (0.217-0.783) |
0.000 (0.000-0.000) |
0.667 (0.400-0.933) |
|||
|
EM MLM |
0.694 |
0.667 (0.400-0.933) |
0.500 (0.217-0.783) |
0.833 (0.622-1.000) |
0.750 (0.505-0.995) |
0.625 (0.351-0.899) |
0.600 (0.323-0.877) |
|||
|
Hybrid MLM |
0.722 |
0.750 (0.505-0.995) |
0.833 (0.622-1.000) |
0.667 (0.400-0.933) |
0.714 (0.459-0.970) |
0.800 (0.574-1.000) |
0.769 (0.531-1.000) |
|||
|
Without hypertension |
|
|
|
|
|
|
||||
|
REMoCA |
0.667 |
0.706 (0.489-0.922) |
0.167 (0.000-0.344) |
1.000 (1.000-1.000) |
1.000 (1.000-1.000) |
0.688 (0.467-0.908) |
0.286 (0.071-0.500) |
|||
|
RF MLM |
0.636 |
0.706 (0.489-0.922) |
0.833 (0.656-1.000) |
0.636 (0.408-0.865) |
0.556 (0.319-0.792) |
0.875 (0.718-1.000) |
0.667 (0.443-0.891) |
|||
|
EM MLM |
0.758 |
0.824 (0.642-1.000) |
0.500 (0.262-0.738) |
1.000 (1.000-1.000) |
1.000 (1.000-1.000) |
0.786 (0.591-0.981) |
0.667 (0.443-0.891) |
|||
|
Hybrid MLM |
0.682 |
0.706 (0.489-0.922) |
0.167 (0.000-0.344) |
1.000 (1.000-1.000) |
1.000 (1.000-1.000) |
0.688 (0.467-0.908) |
0.286 (0.071-0.500) |
|||
|
With diabetes |
|
|
|
|
|
|
|
|||
|
REMoCA |
0.950 |
0.889 (0.684-1.000) |
1.000 (1.000-1.000) |
0.800 (0.539-1.000) |
0.800 (0.539-1.000) |
1.000 (1.000-1.000) |
0.889 (0.684-1.000) |
|||
|
RF MLM |
0.850 |
0.556 (0.231-0.880) |
1.000 (1.000-1.000) |
0.200 (0.000-0.461) |
0.500 (0.173-0.827) |
1.000 (1.000-1.000) |
0.667 (0.359-0.975) |
|||
|
EM MLM |
0.950 |
0.889 (0.684-1.000) |
0.750 (0.467-1.000) |
1.000 (1.000-1.000) |
1.000 (1.000-1.000) |
0.833 (0.590-1.000) |
0.857 (0.629-1.000) |
|||
|
Hybrid MLM |
0.950 |
0.889 (0.684-1.000) |
1.000 (1.000-1.000) |
0.800 (0.539-1.000) |
0.800 (0.539-1.000) |
1.000 (1.000-1.000) |
0.889 (0.684-1.000) |
|||
|
Without diabetes |
|
|
|
|
|
|
|
|||
|
REMoCA |
0.604 |
0.650 (0.441-0.859) |
0.250 (0.060-0.440) |
0.917 (0.796-1.000) |
0.667 (0.460-0.873) |
0.647 (0.438-0.857) |
0.364 (0.153-0.574) |
|||
|
RF MLM |
0.552 |
0.650 (0.441-0.859) |
0.875 (0.730-1.000) |
0.500 (0.281-0.719) |
0.538 (0.320-0.757) |
0.857 (0.704-1.000) |
0.667 (0.460-0.873) |
|||
|
EM MLM |
0.646 |
0.700 (0.499-0.901) |
0.375 (0.163-0.587) |
0.917 (0.796-1.000) |
0.750 (0.560-0.940) |
0.688 (0.484-0.891) |
0.500 (0.281-0.719) |
|||
|
Hybrid MLM |
0.604 |
0.650 (0.441-0.859) |
0.250 (0.060-0.440) |
0.917 (0.796-1.000) |
0.667 (0.460-0.873) |
0.647 (0.438-0.857) |
0.364 (0.153-0.574) |
|||
|
With visual impairment |
|
|
|
|
||||||
|
REMoCA |
0.625 |
0.700 (0.416-0.984) |
0.500 (0.190-0.810) |
0.833 (0.602-1.000) |
0.667 (0.374-0.959) |
0.714 (0.434-0.994) |
0.571 (0.265-0.878) |
|||
|
RF MLM |
0.583 |
0.500 (0.190-0.810) |
0.750 (0.482-1.000) |
0.333 (0.041-0.626) |
0.429 (0.122-0.735) |
0.667 (0.374-0.959) |
0.545 (0.237-0.854) |
|||
|
EM MLM |
0.625 |
0.600 (0.296-0.904) |
0.250 (0.000-0.518) |
0.833 (0.602-1.000) |
0.500 (0.190-0.810) |
0.625 (0.325-0.925) |
0.333 (0.041-0.626) |
|||
|
Hybrid MLM |
0.625 |
0.700 (0.416-0.984) |
0.500 (0.190-0.810) |
0.833 (0.602-1.000) |
0.667 (0.374-0.959) |
0.714 (0.434-0.994) |
0.571 (0.265-0.878) |
|||
|
Without visual impairment |
||||||||||
|
REMoCA |
0.681 |
0.706 (0.489-0.922) |
0.500 (0.262-0.738) |
0.889 (0.739-1.000) |
0.800 (0.610-0.990) |
0.667 (0.443-0.891) |
0.615 (0.384-0.847) |
|||
|
RF MLM |
0.653 |
0.647 (0.420-0.874) |
1.000 (1.000-1.000) |
0.333 (0.109-0.557) |
0.571 (0.336-0.807) |
1.000 (1.000-1.000) |
0.727 (0.516-0.939) |
|||
|
EM MLM |
0.833 |
0.824 (0.642-1.000) |
0.625 (0.395-0.855) |
1.000 (1.000-1.000) |
1.000 (1.000-1.000) |
0.750 (0.544-0.956) |
0.769 (0.569-0.970) |
|||
|
Hybrid MLM |
0.667 |
0.706 (0.489-0.922) |
0.500 (0.262-0.738) |
0.889 (0.739-1.000) |
0.800 (0.610-0.990) |
0.667 (0.443-0.891) |
0.615 (0.384-0.847) |
|||
|
Note: 95% CI, 95% confidence interval; RF, risk factors; EM, eye movement; AUC, area under the receiver operating characteristic curve; ACC, accuracy; SEN, sensitivity; SPE, specificity; PPV, positive predictive value; NPV, negative predictive value; MLM, machine-learning model; NA, not applicable due to insufficient data; visual impairment was defined as logMAR near VA > 0.3 (equivalent to worse than 20/40 Snellen acuity). |
||||||||||
Supplementary File 1
Eye movement task and the definition of incorrect eye movement performances
3.1 Fixation task (FT)
A 2 × 2° black dot was presented in the center of the screen, lasting 2000 milliseconds (ms). Participants were asked to focus on the target as precisely as possible. The FT included 10 trials. Participants who failed to focus on the target during the trials were considered to have incorrect eye movement performances.
3.2 Saccadic task (ST)
After the central fixation point lasted for 1000 ms, the 2 × 2° black dot disappeared for 200 ms. The same black dot was presented in random orientation for 2000 ms, 8° away from the last one. The ST included 10 trials. Participants who failed to focus on the target during the trials were considered to have incorrect eye movement performances.
3.3 Antisaccadic task (AST)
Participants were instructed to look at the 2 × 2° black dot in the center of the screen, which appeared for 1000 ms, followed by the black dot disappearing for 200 ms. The black dot reappeared and a 2 × 2° red dot appeared for 1000 ms, 4° away from the black dot in a random direction. Participants were asked to focus on the opposite position of the red dot as it appeared immediately. The AST included 12 trials. Participants who failed to focus on the opposite position of the red dot during the trials were considered to have incorrect eye movement performances.
3.4 Horizontal smooth pursuit task (HSPT) and vertical smooth pursuit task (VSPT)
A 2 × 2° black dot was moved horizontally or vertically across the screen in a random sequence. The stimulus moved at 0.4 Hz in both the HSPT and VSPT, and each task included 8 trials. Participants who failed to pursue the black dot were considered to have incorrect eye movement performances.
Supplementary File 2
Algorithmic framework of REMoCA
REMoCA is a two-stage framework comprising two binary classification models. In the first stage, a pseudo-3D network is used to classify the eye-movement (EM) pattern of each EM trial as correct or incorrect. This architecture enables simultaneous extraction of spatial and temporal features from EM videos, thereby improving discrimination of EM patterns. Model parameters are optimized through backpropagation to achieve robust classification performance. In the second stage, a logistic regression model integrates the outputs of the first-stage network to detect cognitive impairment, allowing quantitative assessment of the contribution of EM-derived indicators.
In the first-stage network, EM videos in MP4 format are decomposed into multi-frame JPEG images and resized to 224 × 224 pixels before being fed into the model. This preprocessing strategy enables efficient modeling of EM trajectories while reducing the computational burden and memory demand. The pseudo-3D architecture serves as the backbone network, using 3 × 3 × 1 kernels to extract spatial features and 1 × 1 × 3 kernels to capture temporal features. Binary cross-entropy loss is computed at the sigmoid output layer for classification. In the second-stage network, the outputs of the first-stage model are concatenated and entered into the logistic regression model. To address class imbalance, balanced class weights are applied to reduce overfitting, and L1 regularization is used to encourage sparse coefficients.
Reference
- Qiu, Z, Yao, T, Mei, T. Learning spatio-temporal representation with pseudo-3D residual networks. In 2017 International Conference on Computer Vision (ICCV) 5534–5542 (IEEE, 2017).