Comparative analysis of intraocular pressure measurements: a study using noncontact tonometer, Goldmann applanation tonometer, and Corvis ST in healthy individuals and glaucoma patients
Department of Ophthalmology, Dongguan Tungwah Hospital, Dongguan 523111, China
First Clinical Medical College, Guangdong Medical University, Zhanjiang 524023, China
State Key Laboratory of Ophthalmology, Zhongshan Ophthalmic Center, Sun Yat-sen University, Guangdong Provincial Key Laboratory of Ophthalmology and Visual Science, Guangdong Provincial Clinical Research Center for Ocular Diseases, Guangzhou 510060, China
Dongguan Key Laboratory of Ocular and Systemic Disease Prevention and Treatment, Dongguan 523111, China
Objective: Accurate intraocular pressure (IOP) measurement is a cornerstone of glaucoma diagnosis and management. While Goldmann applanation tonometry (GAT) remains the accepted gold standard, technological advancements have introduced alternative methods such as noncontact tonometry (NCT) and the dynamic Scheimpflug-based Corvis ST (CST). This study aims to conduct a rigorous comparative analysis of IOP measurements obtained by NCT, GAT, and CST across a wide spectrum of intraocular pressures. The primary objectives were to evaluate the performance of these devices in both healthy and glaucomatous eyes, assess their intra- and interobserver variability, and determine their level of agreement with the established reference. Methods: In this prospective, comparative study, a total of 212 eyes from 212 subjects were enrolled, comprising 137 eyes of patients with glaucoma and 75 eyes of healthy individuals. All participants underwent IOP measurement using the three devices in a randomized order to minimize bias. Based on the initial GAT readings, eyes were systematically classified into one of four predefined IOP levels: Level A (low, < 10 mmHg), Level B (normal range, 10 – 21 mmHg), Level C (moderately elevated, > 21 to 40 mmHg), and Level D (severely elevated, > 40 mmHg). A mixed-model analysis of variance (ANOVA) was employed to statistically analyze the differences in IOP measurements among the three tonometers at each distinct pressure level. The agreement between each pair of devices (CST vs. GAT, CST vs. NCT, and NCT vs. GAT) was meticulously assessed using Bland-Altman plots, which provide metrics for bias (mean difference) and the 95% limits of agreement (LoA). Results: CST and GAT exhibited better intra- and interobserver variability compared to NCT. Significant differences in IOP measurements were observed among CST, NCT, and GAT at levels A and D (P<0.001, P=0.030). Bland-Altman analysis revealed biases between CST and GAT, CST and NCT, and NCT and GAT at different levels (level A: -0.61, 0.94, and -1.55 mmHg; level B: 0.16, -0.7, and 0.8; level C: 0.5, 0.5, and -0.1; level D: 0.83, -3.4, and 4.2). Notably, NCT tended to overestimate IOP more at higher levels (level D) and underestimate at lower levels (level A) compared to CST. CST demonstrated better agreement with GAT than NCT did. Conclusions:This study confirms that the Corvis ST (CST) shows superior agreement with the Goldmann applanation tonometer than noncontact tonometry, particularly at low and high IOP ranges. It also exhibits greater measurement consistency. While NCT remains a useful screening tool, its significant over- and underestimation at pressure extremes is a critical limitation. The findings strongly suggest that CST may serve as a more suitable and reliable alternative to NCT for measuring IOP across a broad clinical range. However, the results underscore that these three methods are not directly interchangeable. Clinicians must therefore exercise careful interpretation of IOP values, taking into account the specific tonometer used and the patient's probable pressure level for accurate diagnosis and management of glaucoma.
Article
HIGHLIGHTS
· Significant differences in IOP readings were found among the three devices (CST, GAT, NCT), but these differences were not consistent across all pressure levels. They were particularly notable at very low (< 10 mmHg) and very high (> 40 mmHg) intraocular pressures.
· A key methodological strength was classifying eyes into four distinct IOP levels based on GAT readings (A: <10, B: 10-21, C: >21-40, D: >40 mmHg) and performing analyses within these groups. This approach was crucial for revealing that the agreement between devices is not uniform and is highly dependent on the actual pressure level.
· The findings guide clinicians on device selection. CST may be a more suitable alternative to GAT than NCT, especially for measuring both low and high IOPs where NCT is unreliable. This could be particularly relevant in post-surgical settings or in severe glaucoma where accurate measurement at extremes is critical.
INTRODUCTION
Glaucoma stands as a leading cause of irreversible blindness worldwide, being characterized by optic nerve damage that is frequently associated with elevated intraocular pressure (IOP)[1, 2]. Precise IOP measurement plays a pivotal role in the diagnosis, treatment, and ongoing monitoring of glaucoma [3]. In clinical practice, several tonometry methods are used, including the noncontact tonometer (NCT), Goldmann applanation tonometer (GAT), and Corvis ST (CST). Nevertheless, the discrepancies observed among these methods underscore the necessity for a thorough comparative analysis to deepen our comprehension of their effectiveness and constraints.
The GAT, widely regarded as the gold standard for IOP measurement [4, 5], has several drawbacks. For instance, it is attached to a slit lamp, requires a skilled examiner for operation, and lacks portability [6, 7]. The NCT and CST share a fundamentally similar basic working principle [8, 9]. However, many studies have reported that the NCT’s lack of precision. For example, Tonnu et al. found that the NCT significantly underestimated GAT measurements at lower IOP levels and overestimated them at higher IOP [10]. Consequently, the NCT is deemed unreliable for subjects with higher IOP ranges [10, 11].
The CST, on the other hand, is a cutting-edge noncontact tonometer that enables the examination of the the cornea’s dynamic reaction to an air impulse. It is engineered to deliver more accurate, repeatable, and reproducible results, along with a broad measurement range [12].
Although the GAT and NCT have been the subject of comparison by various researchers [13–16], no comprehensive evaluations have been conducted involving all three tonometers across different IOP levels [17]. This prospective study aims to assess and compare IOP measurements obtained by NCT, GAT, and CST across varying IOP levels in both healthy individuals and glaucoma patients .Furthermore, the study investigate the intra- and interobserver variability of the three tonometry methods and evaluates their agreement through rigorous statistical analyses.
METHODS
This prospective, comparative study was conducted with 212 participants (comprising 75 normal volunteers and 137 patients) in Dongguan Tungwah Hospital. The study received approval from the Ethical Review Committee of Dongguan Tungwah Hospital and adhered to the provisions of the Declaration of Helsinki for research involving human subjects. Written informed consent was obtained from each participant before examination. All of the subjects were of Chinese Han ethnicity.
The normal volunteers had no prior history of glaucoma. The study protocol excluded individuals with pathological corneal conditions, such as a corneal wound, cornea edema, scarification, Fuchs’ endothelial dystrophy, or keratoconus, as these conditions could potentially influence the measurements. Out of the 212 eyes examined, 75 exhibited no pathologies, while 137 were diagnosed with various ocular pathologies (87 with primary glaucoma and 50 with postoperative glaucoma).
All enrolled eyes underwent a comprehensive ophthalmic examination. IOP measurements were taken with the participants in a seated position, following either a CST-NCT-GAT or an NCT-CST-GAT sequence [13]. During a single visit, each device was used to measure IOP three times by two experienced masked clinicians who were masked to the results. Participants were allowed a recovery period of about 2 minutes between measurements taken with the same tonometer and a 5-minute break between measurements taken with different tonometers [13–16]. IOP was measured using a newly developed noncontact tonometer incorporating Scheimpflug technology (Corvis ST; Oculus, Germany), a slit lamp–mounted GAT (Haag-Streit, Bern, Switzerland), and a conventional NCT (Canon TX-20 Full Auto Tonometer; Canon, Tokyo, Japan).
The collected data were processed and subjected to statistical analysis using SPSS for Windows (Version 26.0; SPSS, Chicago, IL) and MedCalc software version 13.0.0.0 (MedCalc Software, Mariakerke, Belgium). Data are presented as mean ± standard deviation. IOP measurements obtained by CST, GAT, and NCT at different levels were analyzed using a mixed-model analysis of variance (ANOVA) with least significant difference (LSD; Fisher LSD) multiple comparisons. Based on the GAT IOP readings, participants were categorized as follows: level A, < 10 mmHg; level B, 10 ~ 21 mmHg; level C, > 21 to ≤ 40 mmHg; and level D, > 40 mmHg. The coefficient of variation (CV) and intraclass correlation coefficients (ICC) were calculated to assess the intra- and interobserver variability. Correlations among different IOP measurement devices were analyzed by Spearman’s coefficient of rank correlation analysis. The agreement between devices was assessed through Bland-Altman plots. For all tests, P < 0.05 was considered statistically significant.
RESULTS
Demographic data and IOP measurements
A tottal of 137 patients (137 eyes) and a normal control group consisting of 75 subjects (75 eyes), who met the inclusion criteria, were enrolled in the study. The 212 eyes were categorized into four groups: level A (46 eyes), level B (75 eyes), level C (47 eyes), and level D (44 eyes). The mean ages of the patients and the normal control individuals were 42.24 ± 17.18 (mean ± standard deviation) and 44.56 ± 14.76 years, respectively, with no significant difference between two groups (P=0.179). The IOP results obtained from the three devices are summarized in Table 1. Table 2 presents a summary of the tonometry results using the CST, GAT, and NCT at different levels (levels A, B, C, and D). Significant differences in IOP measurement were observed at levels A and D (P<0.001, P=0.030, respectively) as determined ANOVA. Pairwise comparisons by the LSD test revealed the following at level A: CST vs. GAT, P = 0.059; CST vs. NCT, P = 0.004; GAT vs. NCT, P < 0.001. Level D: CST vs. GAT, P = 0.617; CST vs. NCT, P = 0.044; GAT vs. NCT, P=0.012. In contrast, no significant differences in IOP measurements were found at levels B and C (P = 0.053, P = 0.890, respectively) according to ANOVA. The pairwise comparisons at level B: CST vs. GAT, P = 0.067; CST vs. NCT, P = 0.642; GAT vs. NCT, P = 0.022. Level C: CST vs. GAT, P = 0.657; CST vs. NCT, P = 0.701; GAT vs. NCT, P = 0.952.
Table 1 IOP (three readings ± mean) in the study participants ( 212 eyes)
Table 2 Comparison of IOP measurements at different levels
levels
Eyes
CST
NCT
GAT
F
P
level A
46
7.24±1.55
6.30±1.49
7.85±1.59
11.850
0.000*
level B
75
14.13±2.14
14.78±2.15
13.96±2.20
2.970
0.053
level C
47
29.44±6.22
28.89±5.59
28.97±6.00
0.117
0.890
level D
44
47.12±7.96
50.48±7.62
46.29±7.70
3.602
0.030*
Level A: < 10 mmHg, level B: 10 to 21mmHg, level C: 21~ 40 mmHg, and level D: > 40 mmHg. *Significance of differences between groups: mixed-model analysis of variance (ANOVA); * P value < 0.05 was considered to be significant.
Variability of IOP Measurements and Correlation of IOP Measurement Techniques
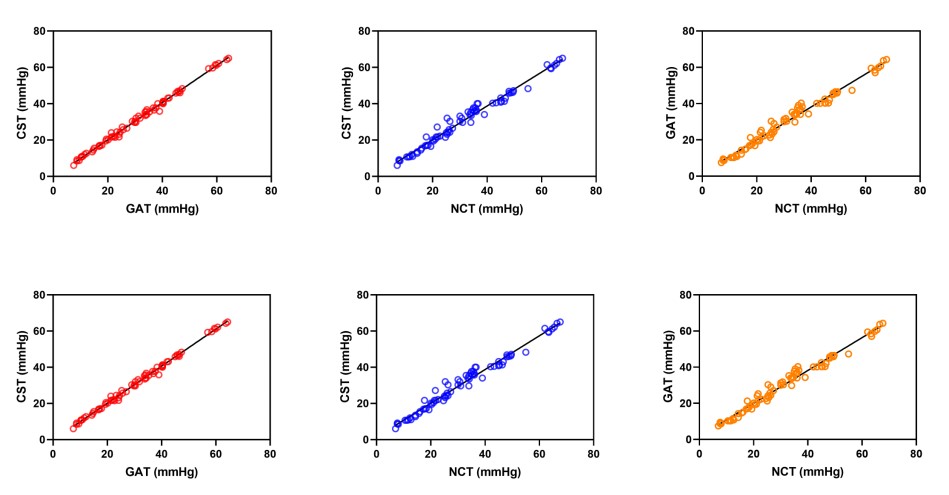
As shown in Table 3, among the three tonometers evaluated, the CST and GAT exhibited the lower variability in their measurements. Furthermore, Spearman’s coefficient of rank correlation analysis revealed a high correlation between the CST and GAT (ρ = 0.996; P < 0.0001), indicating a strong positive relationship between the measurements obtained by these two devices. Similarly, high correlations were observed between the CST and NCT (ρ = 0.991, P < 0.0001), as well as between the GAT and NCT (ρ = 0.990; P < 0.0001). These findings are visually represented in Figure 1.
Table 3 Variability of IOP measurements (212 eyes)
Method
Repeatability
Reproducibility
CV
ICC
CV
ICC
CST
4.69
0.946
4.42
0.975
GAT
5.25
0.966
5.31
0.962
NCT
6.68
0.894
6.27
0.932
Figure 1 Correlations among different IOP measurement devices
Agreement Between Devices at Different IOP Levels
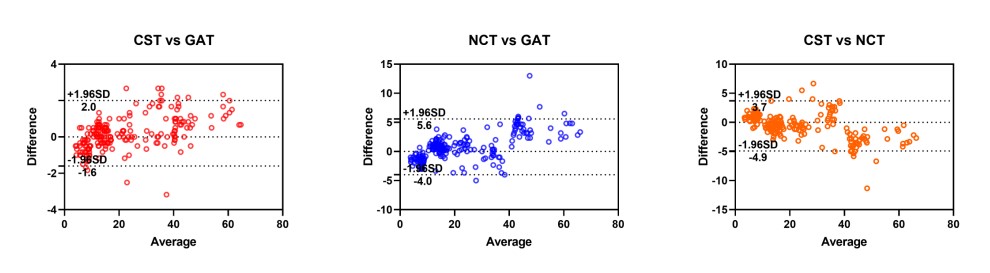
As presented in Table 4, the Bland-Altman analysis revealed that, across the total of 212 eyes with IOP measurements ranging from 3 mmHg to 68 mmHg, the mean IOP value obtained by CST was approximately 0.2 mm Hg higher than that measured by the GAT and 0.6 mm Hg lower than that measured by the NCT. This indicates that the CST demonstrated better agreement with the GAT compared to the NCT, as further illustrated in Figure 2.
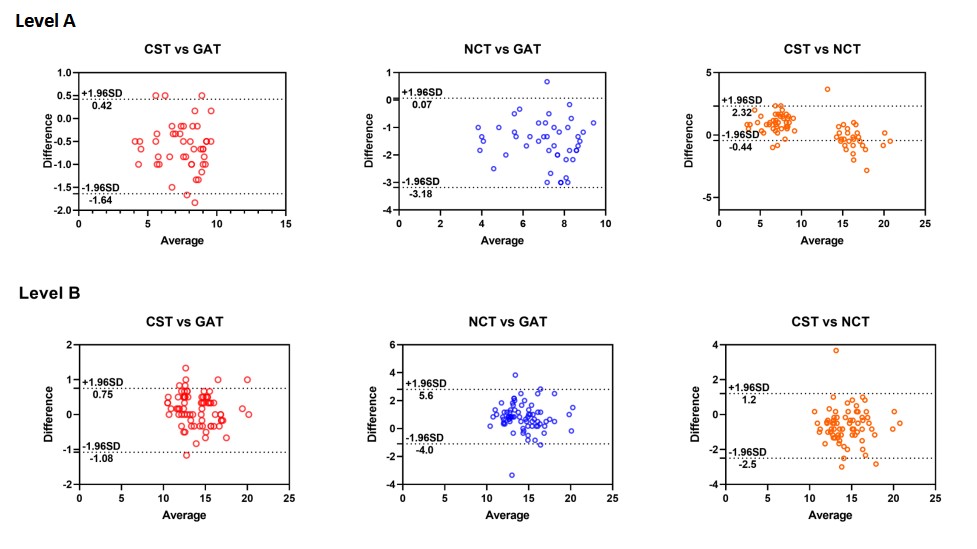
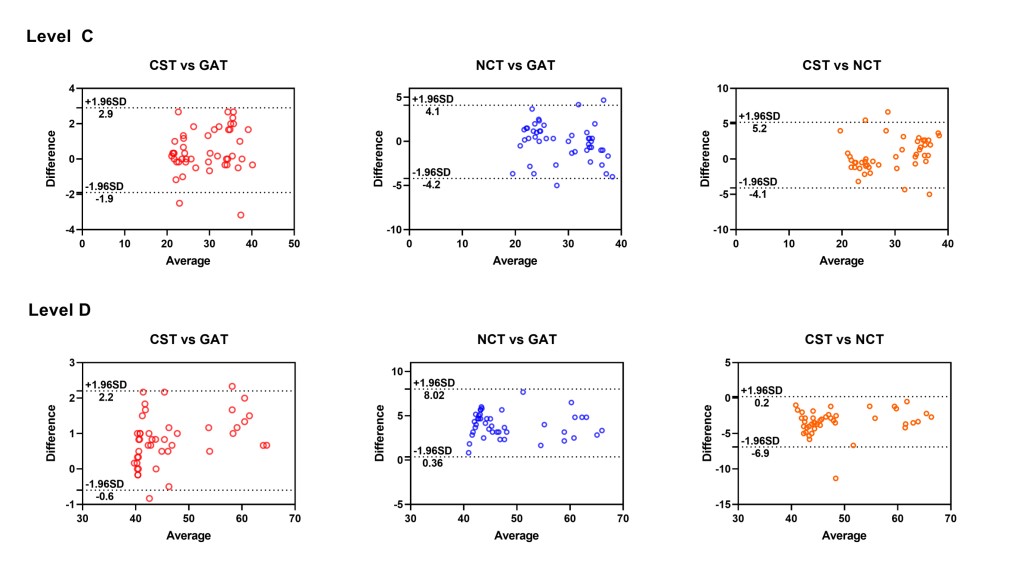
Figure 3 displays Bland-Altman plots that visually represent the agreement between devices at different IOP levels. At level A, the IOP measured by the CST was approximately 0.61 mmHg lower than that measured by the GAT and 0.94 mmHg higher than that that measured by the NCT, suggesting that the NCT tended to underestimate IOP more than the CST did. At level B, the CST measured IOP approximately 0.16 mmHg higher than the GAT and 0.70 mmHg lower than the NCT. At level C, the CST measured IOP approximately 0.5 mmHg higher than both the GAT and NCT, indicating relatively close agreement among the three devices at this level. However, at level D, the CST measured IOP approximately 0.83 mmHg higher than the GAT and 3.4 mmHg lower than the NCT, suggesting that .the NCT overestimated IOP more than the CST did at higher IOP levels.
Table 4 Mean difference and 95% agreement between devices-summary of findings from this study and previous studies
Studies
Eyes
Range ofIOP
CST-GAT
NCT-GAT
NCT type
This study
212
3.0 ~ 68.0
0.2 (-1.6, 2.0)
0.8 (-4.0, 5.6)
Canon TX-20
Hong J et al, 2013 [9]
59
-1.3 (-6.2, 3.5)
1.1 (-6.2, 8.3)
Topcon CT-80A
Reznicek L, 2013 [10]
188
-
-
-
Baneros-Rojas P, 2014 [11]
178
-
0.1 (±2.2)
-
Smedowski A, 2014 [12]
192
0.5 (-3.9, 4.9)
-
-
Figure 2 Bland-Altman scatter plot showing the agreement among different devices for IOP measurement in 212 eyes
Figure 3 Bland-Altman scatter plot showing the agreement between CST and GAT, CST and NCT, and NCT and GAT for IOP measurement at level A, B, C, and D.
DISCUSSION
In the present study, the CST, a relatively novel IOP measurement technology, was compared with the NCT and GAT. Given that the traditional NCT may underestimate GAT measurements at lower IOP levels and overestimated them at higher IOP levels [10, 11], this study was specifically designed to compare the performance of three tonometers across four distinct IOP ranges: < 10 mmHg, 10 ~ 21 mmHg, 22 ~ 40 mmHg, and > 40 mmHg. Previous studies have predominantly focused on normal or mildly abnormal IOP ranges (e.g., 7 ~ 29 mmHg), whereas this study encompasses a much broader range, from 3 to 68 mmHg, with a particular emphasis on including samples with high IOP ( > 40 mmHg, 44 cases). To the best of our knowledge, this is the first prospective study to systematically evaluate the performance of CST, GAT, and NCT under extreme IOP conditions ( < 10 mmHg and > 40 mmHg).
In the current study, we discovered that there were significant differences in IOP between the CST and GAT, between NCT and GAT, as well as between CST and NCT. A high degree of correlation existed between each pair of devices (all P < 0.0001). Notably, the CST and GAT exhibited lower variability in their measurements. Furthermore, through Bland-Altman analysis, it was observed that the CST demonstrated better agreement with the GAT compared to the NCT. Specifically, when IOP was greater than 40 mmHg, the NCT tended to overestimate IOP t a greater extent than the CST. Conversely, when IOP was less than 10 mmHg, the NCT underestimated the IOP more severely than the CST did.
It is essential to evaluate the variability of IOP measurements in this study. When compared with previous research, the CV and ICC values in our study indicated better intra- and interobserver variability for the three tonometers under investigation. Hong et al. reported that, for the NCT, CST, and the CV ranged from 6.7% to 10.8% and the ICC ranged from 0.61 to 0.90 [13]. In Reznicek’s study, the ICC for the CST was 0.942 [14]. In our report, the use of a larger number of sample size and well-calibrated tonometers may have contributed to the demonstration of superior intra- and interobserver variability. Additionally, the distribution of IOP values may also have played a role in the calculation of the CV and ICC.
According to the majority of previous reports, a tonometer with limits of agreement within ±3 mmHg relative to the GAT is considered clinically acceptable and interchangeable [18, 19]. In our analysis, the Bland-Altman plot revealed biases between the CST and GAT, CST and NCT, and NCT and GAT of 0.2 mmHg, -0.6 mmHg, and 0.8 mmHg, respectively, with 95% limits of agreement of -1.6 to 2.0 mmHg, -4.9 to 3.7 mm Hg, and -4.0 to 5.6 mm Hg, respectively. The results showed that the CST is a reliable tonometer compared with the GAT and NCT. As illustrated in Table 3, in Hong’s report, Bland-Altman analysis revealed biases between the CST and GAT, CST and NCT, and NCT and GAT of -1.3, -2.4, and 1.1 mmHg, with 95% limits of agreement of -6.2 to 3.5 mmHg, -10.1 to 5.2 mmHg, and -6.2 to 8.3 mmHg, respectively [13]. Smedowski showed a bias between the CST and GAT of 0.5, with 95% limits of agreement of -3.9 to 4.9 mmHg [16]. The bias between the CST and GAT in our study was close to that reported by Smedowski. Due to the different types of NCTs used and their inherent characteristics, the biases of the NCT and GAT vary significantly across different reports [20–24].
To thoroughly verify the characteristics of different tonometers in measuring IOP across various levels, our study recruited participants with a broad spectrum of IOP measurements, ranging from 3 mmHg to 68 mmHg, encompassing a total of 212 eyes. The enrolled eyes were categorized into four groups based on IOP levels: , < 10 mmHg, 10 ~ 21 mmHg, 21 ~ 40 mmHg, and > 40 mmHg. In this study, we observed that the NCT tended to overestimate IOP more than the CST when IOP > 40 mmHg, whereas it underestimated IOP more than the CST when IOP was below 10 mmHg.The IOP deviations resulting from NCT measurements may contribute to the underdiagnosis or misdiagnosis of low intraocular pressure (< 10 mmHg), thereby delaying the timely initiation of early intervention and treatment. Conversely, in patients with high intraocular pressure (>40 mmHg), these deviations may result in overtreatment or undertreatment, adversely affecting patient prognosis. Previous studies have indicated that the NCT may not reliable in subjects with either lower or higher IOP range [10, 11]. However, the IOP ranges examined in those studies were primarily confied to 7 to 29 mmHg and 10 to 21 mmHg [10, 11]. As demonstrated in our study, the CST exhibits superior accuracy in measuring intraocular pressure (IOP), particularly within the low IOP range ( < 10 mmHg) and high IOP range ( > 40 mmHg). These characteristics, coupled with its high precision and repeatability, make the CST an ideal instrument for the long-term management of glaucoma patients and for precise IOP assessment during the perioperative period. This is especially pertinent in clinical scenarios involving glaucoma patients with IOP near the normal range but experiencing progressive visual field damage, as well as in cases where corneal abnormalities may potentially compromise the accuracy of IOP measurements.
Several limitations are associated with this study. Firstly, some reports have demonstrated that central corneal thickness exerts an influence on IOP measurement [14, 25, 26]. However, this study primarily focused on the clinical comparison of IOP at different levels using the three tonometers. Our future research will delve into whether other factors, such as age, disease, or corneal biomechanical properties (CBPs), affect IOP measurement. Secondly, the CST equipped with ultra-high-speed Scheimpflug technology is also capable of evaluating CBPs. Such evaluation may help us to correct IOP measurements. Therefore, further studies are imperative to assess IOP measurement with greater accuracy and objectivity., as well as to quantify the impact of measurement errors from different methods on clinical cases, thereby offering guidance for clinical IOP management.
In conclusion, this study highlights the importance of selecting an appropriate tonometry method for accurate IOP measurement in clinical practice. Although CST exhibited better comparability with GAT than NCT, the three methods were not interchangeable. The findings imply that CST may serve as a more suitable alternative to GAT, particularly in situations involving lower and higher IOP levels.
Correction notice
None.
Acknowledgements
None.
Author Contributions
(I) Conception and design: Shaolin Du, Xiulan Zhang
(II) Administrative support: Xiulan Zhang
(III) Provision of study materials or patients: Yulei Chen, Xifeng Lin
(IV) Collection and assembly of data: Lingyu Ye
(V) Data analysis and interpretation: Chusheng Cai
(VI) Manuscript writing: Shaolin Du, Yulei Chen, Lingyu Ye, Chusheng Cai, Xifeng Lin, Xiulan Zhang
(VII) Final approval of manuscript: Shaolin Du, Yulei Chen, Lingyu Ye, Chusheng Cai, Xifeng Lin, Xiulan Zhang
Conflict of Interests
None of the authors has any conflicts of interest to disclose.All authors have declared in the completed the ICMJE uniform disclosure form.
Patient consent for publication
Not applicable.
Ethics approval and consent to participate
The study received approval from the Ethical Review Committee of Dongguan Tungwah Hospital and adhered to the provisions of the Declaration of Helsinki for research involving human subjects. Written informed consent was obtained from each participant before examination.
Data availability statement
None
Open access
This is an Open Access article distributed in accordance with the Creative Commons AttributionNonCommercial-NoDerivs 4.0 International License (CC BY-NC-ND 4.0), which permits the non-commercial replication and distribution of the article with the strict proviso that no changes or edits are made and the original work is properly cited (including links to both the formal publication through the relevant DOI and the license).
Funding
No Fund Information
References
Asrani SG, McGlumphy EJ, Al-Aswad LA, et al. The relationship between intraocular pressure and glaucoma: an evolving concept. Prog Retin Eye Res. 2024, 103: 101303. DOI: 10.1016/j.preteyeres.2024.101303.
Jayaram H, Kolko M, Friedman DS, et al. Glaucoma: now and beyond. Lancet. 2023, 402(10414): 1788-1801. DOI: 10.1016/s0140-6736(23)01289-8.
Xu Y, Ye Y, Chen Z, et al. The impact of intraocular pressure changes on corneal biomechanics in primary open-angle glaucoma. Am J Ophthalmol. 2025, 269: 216-225. DOI: 10.1016/j.ajo.2024.08.027.
Chaung JQ, Sangapillai T, Quilat KK, et al. A comparison of intraocular pressure measurement using SUOER SW-500 rebound tonometer and conventional reusable Goldmann prisms. Front Med (Lausanne). 2024, 11: 1269332. DOI: 10.3389/fmed.2024.1269332.
Shaikh ZM, Rajalakshmi AR, Nagarajan S, et al. Agreement of intraocular pressure measurement by scleral Schiotz and Goldmann applanation tonometer. Sci Rep. 2024, 14(1): 27900. DOI: 10.1038/s41598-024-79403-1.
Uzlu D, Akyol N, Türk A, et al. A comparison of three different tonometric methods in the measurement of intraocular pressure in the pediatric age group. Int Ophthalmol. 2020, 40(8): 1999-2005. DOI: 10.1007/s10792-020-01375-8.
Bao F, Huang W, Zhu R, et al. Effectiveness of the goldmann applanation tonometer, the dynamic contour tonometer, the ocular response analyzer and the corvis ST in measuring intraocular pressure following FS-LASIK. Curr Eye Res. 2020, 45(2): 144-152. DOI: 10.1080/02713683.2019.1660794.
Brusini P, Salvetat ML, Zeppieri M. How to measure intraocular pressure: an updated review of various tonometers. J Clin Med. 2021, 10(17): 3860. DOI: 10.3390/jcm10173860.
Li HG, Chen YH, Lin F, et al. Agreement of intraocular pressure measurement with Corvis ST, non-contact tonometer, and Goldmann applanation tonometer in children with ocular hypertension and related factors. Int J Ophthalmol. 2023, 16(10): 1601-1607. DOI: 10.18240/ijo.2023.10.07.
Tonnu PA, Ho T, Sharma K, et al. A comparison of four methods of tonometry: method agreement and interobserver variability. Br J Ophthalmol. 2005, 89(7): 847-850. DOI: 10.1136/bjo.2004.056614.
Mohan S, Tiwari S, Jain A, et al. Clinical comparison of Pulsair non-contact tonometer and Goldmann applanation tonometer in Indian population. J Optom. 2014, 7(2): 86-90. DOI: 10.1016/j.optom.2013.06.002.
Chong J, Dupps WJ Jr. Corneal biomechanics: measurement and structural correlations. Exp Eye Res. 2021, 205: 108508. DOI: 10.1016/j.exer.2021.108508.
Hong J, Xu J, Wei A, et al. A new tonometer: the corvis ST tonometer: clinical comparison with noncontact and goldmann applanation tonometers. Invest Ophthalmol Vis Sci. 2013, 54(1): 659-665. DOI: 10.1167/iovs.12-10984.
Reznicek L, Muth D, Kampik A, et al. Evaluation of a novel Scheimpflug-based non-contact tonometer in healthy subjects and patients with ocular hypertension and glaucoma. Br J Ophthalmol. 2013, 97(11): 1410-1414. DOI: 10.1136/bjophthalmol-2013-303400.
Bañeros-Rojas P, Martinez de la Casa JM, Arribas-Pardo P, et al. Comparison between goldmann, icare pro and corvis ST tonometry. Arch Soc Esp Oftalmol. 2014, 89(7): 260-264. DOI: 10.1016/j.oftal.2014.02.001.
Smedowski A, Weglarz B, Tarnawska D, et al. Comparison of three intraocular pressure measurement methods including biomechanical properties of the cornea. Invest Ophthalmol Vis Sci. 2014, 55(2): 666-673. DOI: 10.1167/iovs.13-13172.
Tziola T, Tzamalis A, Koronis S, et al. Comparison of intraocular pressure measurements using three different methods (goldmann applanation tonometry (GAT), corvis ST, and iCare) following penetrating keratoplasty. J Clin Med. 2024, 13(23): 7046. DOI: 10.3390/jcm13237046.
Lam A, Chen D, Chiu R, et al. Comparison of IOP measurements between ORA and GAT in normal Chinese. Optom Vis Sci. 2007, 84(9): 909-914. DOI: 10.1097/OPX.0b013e3181559db2.
Carbonaro F, Andrew T, MacKey DA, et al. Comparison of three methods of intraocular pressure measurement and their relation to central corneal thickness. Eye (Lond), 2010, 24(7): 1165-1170. DOI: 10.1038/eye.2010.11.
García-Resúa C, Giráldez Fernández MJ, Yebra-Pimentel E, et al. Clinical evaluation of the Canon TX-10 noncontact tonometer in healthy eyes. Eur J Ophthalmol. 2010, 20(3): 523-530. DOI: 10.1177/112067211002000326.
Bhartiya S, Bali SJ, Sharma R, et al. Comparative evaluation of TonoPen AVIA, Goldmann applanation tonometry and non-contact tonometry. Int Ophthalmol. 2011, 31(4): 297-302. DOI: 10.1007/s10792-011-9458-4.
Cook JA, Botello AP, Elders A, et al. Systematic review of the agreement of tonometers with Goldmann applanation tonometry. Ophthalmology. 2012, 119(8): 1552-1557. DOI: 10.1016/j.ophtha.2012.02.030.
Stock RA, Ströher C, Sampaio RR, et al. A comparative study between the goldmann applanation tonometer and the non-contact air-puff tonometer (huvitz HNT 7000) in normal eyes. Clin Ophthalmol. 2021, 15: 445-451. DOI: 10.2147/OPTH.S294710.
Duran M. Comparison of intraocular pressure measurements obtained by icare pro tonometer, non-contact tonometer and Goldmann applanation tonometer in healthy individuals. J Fr Ophtalmol. 2023, 46(10): 1195-1203. DOI: 10.1016/j.jfo.2023.01.042.
Mendieta PH, Puerto ML, Goyeneche FG, et al. Concordance between Goldmann, Icare Pro®, Corvis ST® and Tonopen® tonometry, and their correlation with corneal thickness. Pan Am J Ophthalmol. 2021, 3(1): 3. DOI: 10.4103/pajo.pajo_44_20.
Huseynova T, Waring GO 4th, Roberts C, et al. Corneal biomechanics as a function of intraocular pressure and pachymetry by dynamic infrared signal and Scheimpflug imaging analysis in normal eyes. Am J Ophthalmol. 2014, 157(4): 885-893. DOI: 10.1016/j.ajo.2013.12.024.