





Introduction
Methods
Methods
Animals
Anesthesia
FP and fundus fluorescence angiography
OCT
Statistical analyses
Results
FP
Figure 1B presents FPs of New Zealand rabbit retina showing the optic nerve head, retinal vessels, and choroid. The optic nerve head was oval (horizontal in the long axis) and orange-red. The boundary was unclear and the C/D ratio was about 0.4–0.5. Ivory-colored myelinated nerve fibers and retinal vessels were observed passing through the optic disc. Compared to retinal veins, retinal arteries were brighter and thinner (A/V of about 2:3). Healthy New Zealand rabbit retinas were flat and even, no macular-like structure and pigment were observed, but they have a structure called area centralis (cone rich region) similar to the human macula. The choroid was visible beneath the retina but the macula could not be distinguished.
Fundus photographs of SD rats revealed a clear optic nerve head, retinal vessels, choroid (Figure 1C). The optic nerve head was round and light yellow. The boundary was clear but with no obvious optic cup structure. No macula was detected, too. Retinal vessels were radially distributed. Healthy retinas were flat and even, without pigmentation. Circuitous choroid vessels were observed beneath the retina.
The BALB/c mouse retina (Figure 1D) appeared similar to the SD rat retina on fundus photographs. The optic nerve head was quasi-circular, light yellow, and exhibited no clear boundary or optic cup structure. No macula was observed. Retinal vessels were radially distributed. Healthy retinas of BALB/c mice were flat and even, with no pigment. Choroid was observed beneath the retina but the fine structure was unclear.
New Zealand rabbits, SD rats, and BALB/c mice are albino strains. In New Zealand rabbits and SD rats, the individual structures and distribution of choroid vessels were clearly visible beneath the retina. However, the choroid of BALB/c mice was indistinct.
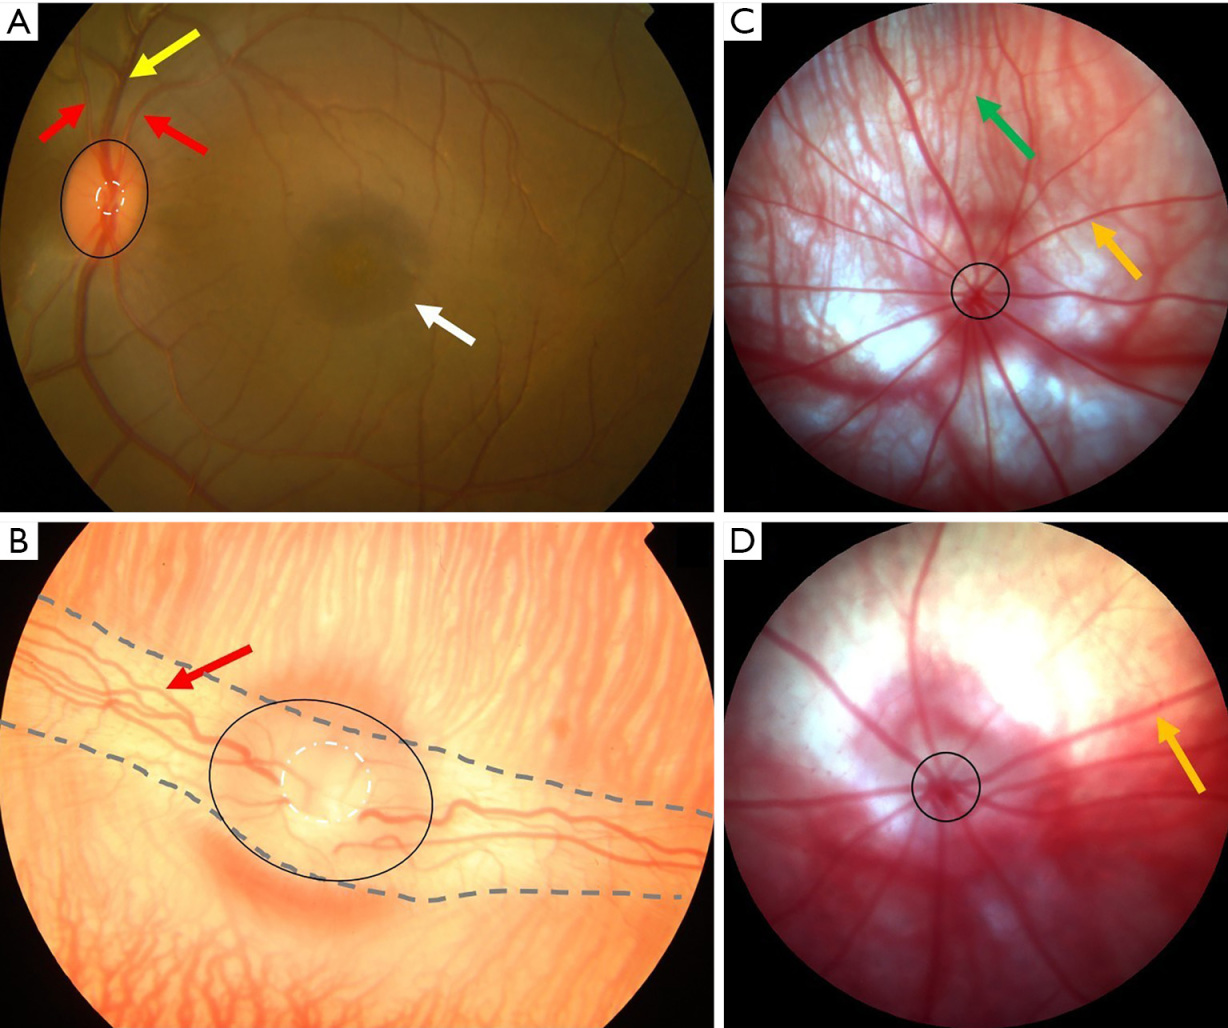
Figure 1 FP of cynomolgus monkey, New Zealand rabbit, Sprague Dawley rat and BALB/c mouse. (A) Fundus photograph of cynomolgus monkey was centered on the macula. The optic disc (black circle) and the optic cup (white circle) was located on the nasal side of the macula (white arrow). Retinal vessels (retinal artery—red arrow, retinal vein—yellow arrow) and retinal nerve fibers passed through the optic disc. (B) Fundus photographs of New Zealand rabbit (optic nerve head—black circle, optic cup—white circle, retinal vessels—red arrow, myelinated nerve fibers—ivory structure between the two dotted lines), SD rat (C, optic nerve head—black circle, retinal vessels—yellow arrow, choroid—green arrow) and BALB/c mouse (D, optic nerve head—black circle, retinal vessels—yellow arrow) were centered on the optic disc as no macula was detectable. Retinal vessels and retinal nerve fibers passed through the optic disc. The choroid was visible. FP, fundus photography.
Fundus fluorescence angiography
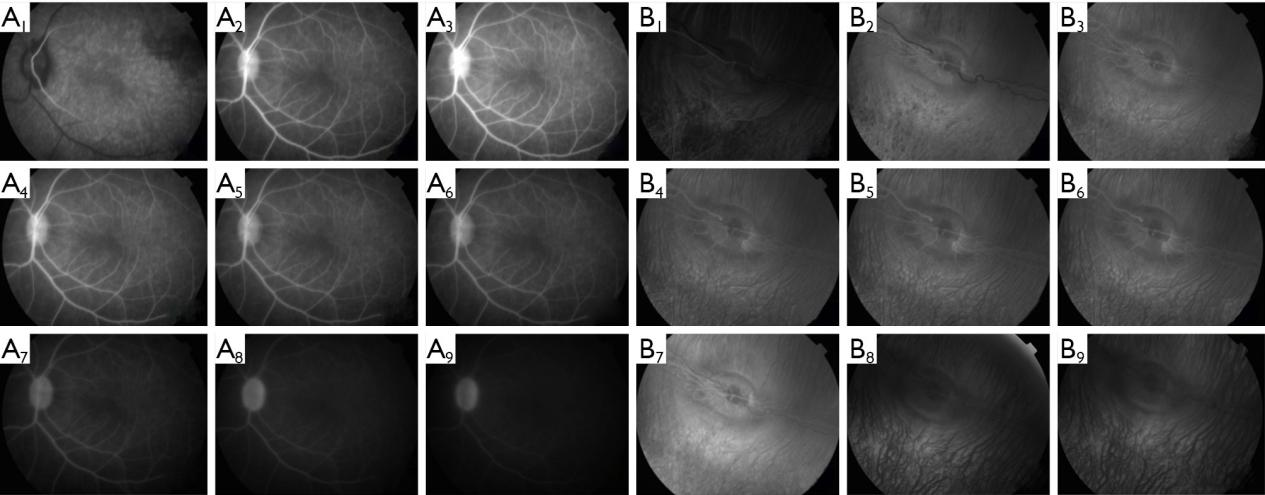
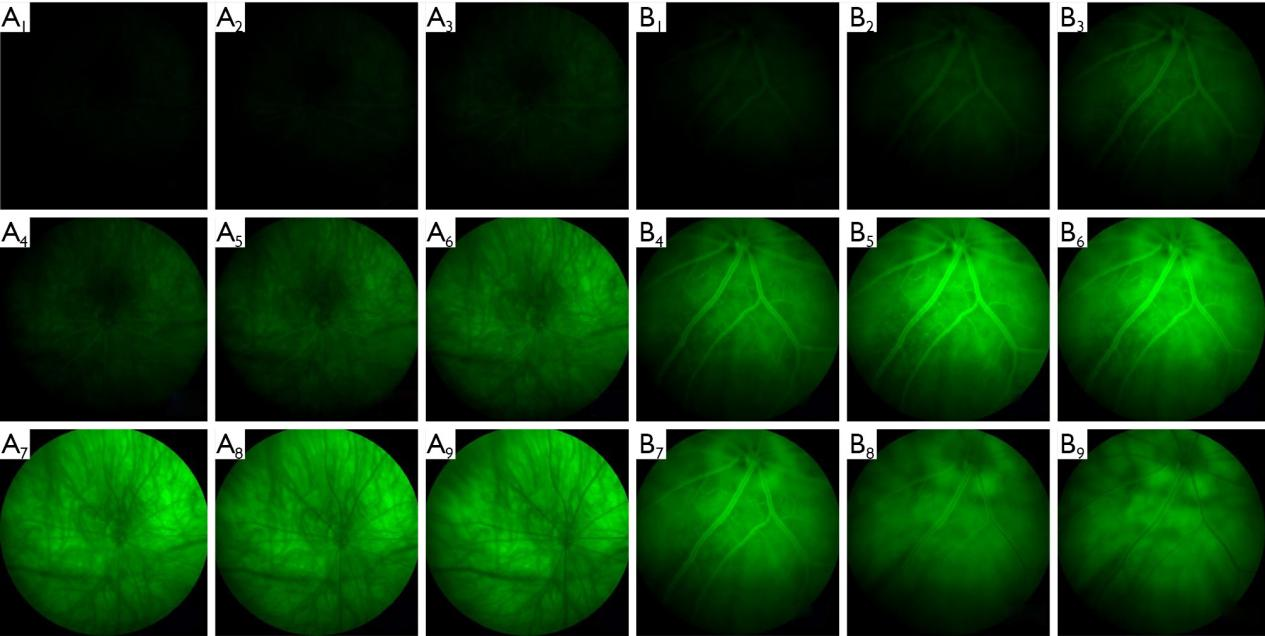
OCT
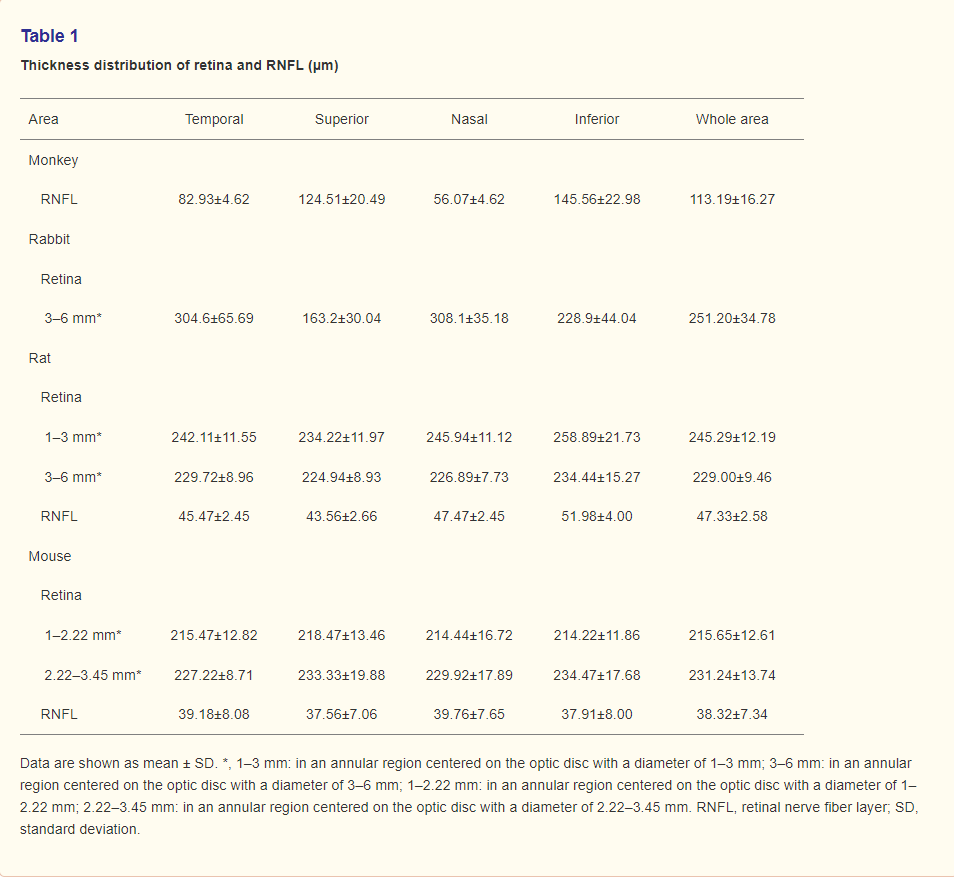
The structure of the cynomolgus monkey retina looks like the human retina on OCT images. These images distinguished 11 retinal layers, the retinal nerve fiber layer (RNFL), ganglion cell layer (GCL), inner plexiform layer (IPL), inner nuclear layer (INL), outer plexiform layer (OPL), outer nuclear layer (ONL), external limiting membrane (ELM), myoid zone, ellipsoid zone, photoreceptor outer segment (OS), RPE and Bruch’s membrane (RPE/BM) (8-10), in addition to the underlying choroid (Figure 4A). Macular foveal thickness did not differ between right eyes and left eyes (207.17±14.77 vs. 209.43±5.26 μm, P>0.05). Alternatively, RNFL thickness differed significantly among the 4 quadrants (Table 1) (P=0.001), with significant pair-wise differences between temporal and inferior (P=0.008), superior and nasal (P=0.005), and inferior and nasal (P=0.001) quadrants.
Outside the optic disc, 11 layers were still observed in New Zealand rabbits’ retina, including (RNFL, GCL, IPL, INL, OPL, ONL, incomplete ELM, photoreceptor inner segment (IS), junction of outer and inner segment, photoreceptor OS, and RPE/BM) (Figure 4B) (11-13). The average thickness of New Zealand rabbit retina was 251.20±34.78 μm. Retinal thickness values within a 3–6 mm annular region centered on the optic disc are presented in Table 1. There was no significant difference between temporal and nasal retina thickness (P>0.05). Due to the large optic disc of New Zealand rabbits, the annular region within 1–3 mm and RNFL thickness could not be measured.
Due to the multitude of retinal vessels in SD rats, many vascular shadows were observed by OCT, which partly obscured the RNFL. Nonetheless, 9 retinal layers could still be distinguished [RNFL, GCL, IPL, INL, OPL, ONL, ELM, junction of outer and inner segment (IS/OS), and RPE/BM] (Figure 4C) (14,15). Retina and RNFL thickness values across the retina are summarized in Table 1. Statistically significant differences in rat retinal thickness were found between annular regions of diameter 1–3 and 3–6 mm (P=0.000), and between superior and inferior quadrants within the annular region of diameter 1–3 mm (P=0.01). Mean RNFL thickness also differed significantly among the 4 quadrants (P=0.000) and the inferior quadrant differed significantly from all three other quadrants (temporal P=0.000, superior P=0.000, nasal P=0.022).
Like SD rats, numerous vascular shadows were seen on OCT images of BALB/c mouse retina. Nonetheless, 9 layers could be resolved (RNFL, GCL, IPL, INL, OPL, ONL, ELM, IS/OS, and RPE/BM) (Figure 4D) (16). The thickness distribution in different areas of retina and RNFL are summarized in Table 1. There was a statistically significant difference in retinal thickness between the annular region 1–2.22 mm from the optic disk and that 2.22–3.45 mm from the optic disk (P=0.000), but no significant differences among quadrants within these annular regions (P>0.05). Mean RNFL thickness did not differ among quadrants (P>0.05).
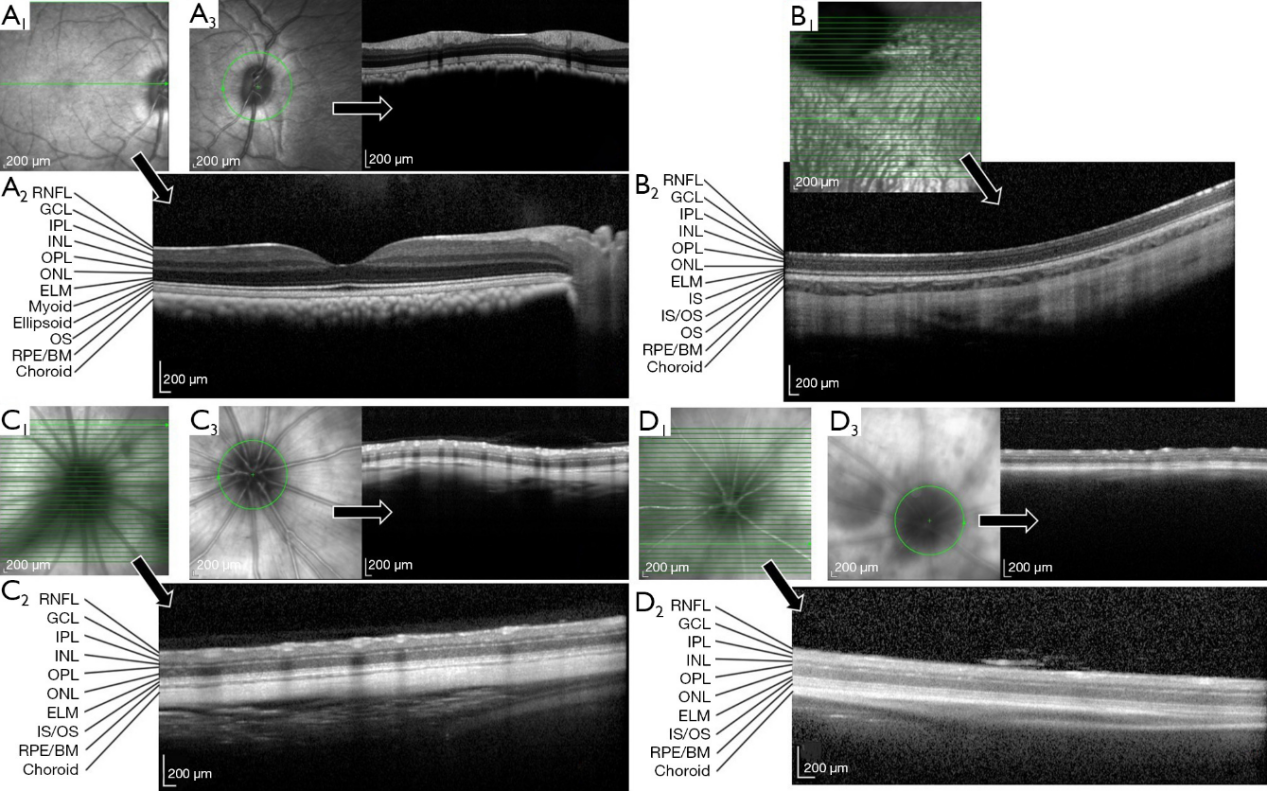
Table 1 Thickness distribution of retina and RNFL (μm)
Discussion
Most retinal structures of cynomolgus monkey were anatomically similar to the corresponding human structures as revealed by FP, FFA, and OCT. A notable exception was the monkey optic disc shape, which was oval with long-axis in the vertical direction whilst the human structure in more symmetrically round. The circulation time from the small saphenous vein to retina was also approximately equal to that in human. The pattern of RNFL thickness variation in different directions from the optic disc was also similar to human, with greater thickness in superior and inferior quadrants compared to temporal and nasal quadrants. Therefore, the cynomolgus monkey is a very good experimental model to study structural changes associated with fundus diseases.
The large eyeball of the New Zealand rabbit permits easy experimental manipulation, measurement, and dissection, and so is widely used in ophthalmologic research. However, FP and FFA revealed two notable differences compared to human retina, a larger optic disc and myelinated retinal nerve fibers (17,18). There were also substantial differences in the growth pattern of retinal vessels compared to the human retina. Retinal vessels of New Zealand rabbits distributed in a small area of temporal and nasal optic disc, while a larger area was supplied by the choroid. The temporal and nasal areas of retina were significantly thicker than superior and inferior areas due to the myelinated fiber distribution as revealed by FP, which is also distinct from human retina. The inferior region of the rabbit retina was also thicker than the superior area. Thus, to track changes in retinal thickness among individual animals, it is critical that measurements are taken at the same location. In fact, there is substantial variation in retinal thickness among studies, which may be explained by inconsistencies in measurement location or different kinds of rabbits (11-13). We could not analyze RNFL thickness in rabbits because the large optic disc obscured the RNFL on OCT images. In conclusion, New Zealand rabbits are not suitable for research on optic nerve diseases. But rabbit is well recommended by Food and Drug Administration (FDA) to evaluate the safety and tox of the ocular compounds. In addition, in the vision filed, retinopathy model and DL-AAA RNV models of rabbit have been used to test the efficacy to various retinal drugs.
Compared to monkeys and rabbits, the retinal vessels of SD rats and BALB/c mice were widely distributed and clear. However, the smaller rat and mouse eyeballs require precise laboratory techniques and high-resolution measurements. Retinal thickness differed according to distance from the optic disc on OCT images. Therefore, to compare retinal changes at different time points within the same animal, it is critical to choose the same retinal location. In mice, RNFL thickness also differed by orientation, which may yield artifactual differences if the measurement site is inconsistent. In rats, inferior RNFL and inferior retina were thicker than the superior RNFL and superior retina, respectively, possibly due to the greater number of retinal vessels. However, due to the small eye and high vessel density, RNFL thickness is inherently difficult to measure accurately in rats and mice. Further, neural fibers and vessels were highly reflective, which interfered with OCT resolution. Therefore, we suggest that the “ganglion cell complex (GCC)” (19,20) including the RNFL, GCL, and IPL be used as a metric for retinal ganglion cell changes in rats and mice rather than the RNFL. The GCC includes all major compartments of retinal ganglion cells, while the RNFL is mainly composed of axons, the GCL of somata, and the IPL of dendrites. Therefore, GCC is a superior metric for overall condition (but not for specific changes in individual compartments). Measurement of the GCC may also reduce errors caused by retinal blood vessel changes.
The vascular structures of the retina can also be revealed by stretched preparations, and results do not appear to differ from FFA findings (21). However, FFA images are not influenced by operative manipulations or post-mortem changes, and can also reveal changes in retinal vessel pattern and flow over time in the same preparation. Thus, FFA is recommended for studies on retinal vessel diseases. In this research, the injected concentrations and volumes of contrast agent were obtained from literature review (22-26) and our experimental experience. At high concentrations, signals rose faster and higher to reveal the overall vascular structure quickly and in detail. However, lower concentrations offered more time for observation during the early phase.
In the three albino strains, the choroid was clearly seen on FP and signals from choroid were high on FFA, due to the absence of pigment, which obscured the resolution and detection of retinal vessels. Therefore, albino strains are not suitable for studies on retinal vessel diseases by only FFA, but by indocyanine green angiography (ICGA). On the other hand, due to the lack of pigment, albino strains are good models to study choroid diseases.
Conclusions
We examined the healthy retinas of cynomolgus monkey, New Zealand rabbit, SD rat, and BALB/c mouse by FP, FFA, and OCT to identify models most appropriate for specific experimental applications in ophthalmology. The structure of the cynomolgus monkey fundus was closest to human, and so cynomolgus monkey is the best model for examination of fundus lesions, although the cost is also highest. New Zealand rabbits have large eye balls, so experimental manipulations and measurements are easier than in other small mammal models such as mice and rats. However, fundus structure is much different from that of human, so this is an unsuitable model for fundus disease research. The retinal vessels of SD rats and BALB/c mice were clear, and retinal structure were similar to human. While the smaller eyeballs increase the difficulty of experimental manipulation and measurement, low cost and short rearing times are advantageous for experiments on retinal diseases. In all animals, the retinal thickness was different in different area. Thus, to track changes in retinal thickness among individual animals, it is critical that measurements are taken at the same location.
Interestingly, we also found the fluorescence in the retinal vessels during FFA was disturbed by the choroid in albino strains, due to the lack of pigment. Therefore, if researchers choose the rats or mice for retinal vessels diseases, they should choose the pigmented strains such as Long Evans rats or C57BL/j mice.
Acknowledgments
Funding: This study was funded by Science and Technology Projects of Guangdong Province (Nos. 2019A030317002, 2017A030303013, 2013B060300003). Funders provided most of the money for this research and participated in research design at the beginning.
Footnote
Reporting Checklist: The authors have completed the ARRIVE reporting checklist. Available at https://journal.gzzoc.com/Es/Stage/ArticleShow.aspx?AID=3728
Data Sharing Statement: Available at https://journal.gzzoc.com/Es/Stage/ArticleShow.aspx?AID=3728
Conflicts of Interest: All authors have completed the ICMJE uniform disclosure form (available at https://journal.gzzoc.com/Es/Stage/ArticleShow.aspx?AID=3728). The authors have no conflicts of interest to declare.
Ethical Statement: The authors are accountable for all aspects of the work in ensuring that questions related to the accuracy or integrity of any part of the work are appropriately investigated and resolved. All animal procedures were performed in accordance with the Association for Research in Vision and Ophthalmology (ARVO) Statement for the Use of Animals in Ophthalmic and Vision Research and approved by the Institutional Animal Ethics Committee of Zhongshan Ophthalmic Center, Sun Yat-sen University (Animal Welfare Assurance No. 2016-120).
Open Access Statement: This is an Open Access article distributed in accordance with the Creative Commons Attribution-NonCommercial-NoDerivs 4.0 International License (CC BY-NC-ND 4.0), which permits the non-commercial replication and distribution of the article with the strict proviso that no changes or edits are made and the original work is properly cited (including links to both the formal publication through the relevant DOI and the license). See: https://creativecommons.org/licenses/by-nc-nd/4.0/.