Hyperuricemia and risk of microvascular complications in individuals with type 2 diabetes mellitus: a prospective analysis of 25,094 UK Biobank participants
State Key Laboratory of Ophthalmology, Zhongshan Ophthalmic Center, Sun Yat-sen University, Guangdong Provincial Key Laboratory of Ophthalmology and Visual Science,Guangzhou 510060, China
State Key Laboratory of Ophthalmology, Zhongshan Ophthalmic Center, Sun Yat-sen University, Guangdong Provincial Key Laboratory of Ophthalmology and Visual Science, Guangdong Provincial Clinical Research Center for Ocular Diseases, Guangzhou 510060, China
Objective: Evidence pertaining to the associations between hyperuricemia and diabetic microvascular complications is limited and inconclusive. In this study, we aimed to prospectively investigate the independent associations of hyperuricemia and retinopathy, nephropathy and neuropathy in individuals with type 2 diabetes mellitus (T2DM). Methods: This cohort study enrolled 25,094 participants from UK Biobank with T2DM and without microvascular complications at baseline. Hyperuricemia was defined as serum uric acid (SUA) higher than 420 μmol/L. The incidence of diabetic microvascular complications was identified from hospital inpatient records that were coded according to the International Classification of Diseases (ICD)-10 coding system. Multivariable adjusted Cox proportional hazards regression models were used to calculate adjusted hazard ratios (aHR). Results: Among all participants, 3,844 (15.3%) were classified as having hyperuricemia at baseline. During a median follow-up of 14.0 years, 555 (14.4%) individuals with hyperuricemia developed diabetic microvascular complications, compared with 12.6% of individuals without hyperuricemia (P=0.002). In the multivariable-adjusted model accounted for socioeconomic status, lifestyle factors, physical and biochemical measurements, and medication use, when compared with individuals of T2DM who had a normal SUA level, those with hyperuricemia had an 82.9% higher risk of developing diabetic nephropathy (95%CI: 1.41-2.38, P<0.001), and a 30.2% higher risk of diabetic neuropathy (95%CI: 1.06-1.60, P=0.011). However, the association between hyperuricemia and diabetic retinopathy was not statistically significant (aHR:1.070, 95%CI: 0.94-1.22, P=0.320). Conclusions: Hyperuricemia was independently associated with diabetic nephropathy and neuropathy but not retinopathy in individuals with T2DM. These findings underscore the importance of monitoring SUA level in prevention of certain microvascular complications.
Article
HIGHLIGHTS
· This large-scale prospective cohort study found that in patients with type 2 diabetes mellitus (T2DM), hyperuricemia was independently associated with an increased risk of diabetic nephropathy and neuropathy, but showed no significant correlation with diabetic retinopathy.
· This study highlights the importance of monitoring serum uric acid levels for the prevention of certain diabetic microvascular complications in patients with T2DM, proposing a new focus for the clinical management of these patients.
· From the perspective of hyperuricemia, a highly prevalent metabolic comorbidity, this study provides a new direction for understanding the pathogenesis of diabetic microvascular diseases.
INTRODUCTION
Diabetes, which affects approximately 1 in 10 people worldwide, has emerged as a major and pressing public health concern. In 2021, it incurred at least $966 billion in health-care expenditures, representing a 316% increase over the last 15 years[1]. Diabetic microvascular complications, encompassing diabetic retinopathy, nephropathy, and neuropathy, can progress to blindness, renal failure, long-term motor or sensory abnormality, and even amputation[2]. Type 2 diabetes mellitus (T2DM), a subtype that accounts for over 90% of the total diabetes prevalence, leads to microvascular complications in 53.5% of its patients[3]. Therefore, it is crucial to identify the clinical features of individuals with T2DM that may be indicative of future microvascular complications. Recognizing these features would enable doctors to predict patient prognosis, prescribe targeted treatments, and gain a deeper understanding of the pathophysiological characteristics of the diseases.
Serum uric acid (SUA) is a metabolite resulting from purine metabolism. It is predominantly produced endogenously by the liver and is also absorbed from dietary sources. SUA is routinely measured, readily available, and represents a modifiable causal risk factor for diseases of the digestive and urinary systems. Hyperuricemia is a sub-healthy condition that appears to be the primary, if not the sole, risk factor for gout. Moreover, it is strongly associated with systemic diseases such as hypertension, hyperlipidemia, and diabetes[4,5]. Cross-continental studies have revealed an alarmingly large number of individuals diagnosed with hyperuricemia, which now affects 14%-20% of the general population[6-8].
However, the evidence regarding the associations between hyperuricemia and diabetic microvascular complications is limited and scattered. Correlative longitudinal evidence is both insufficient and inconclusive. A recent meta-analysis indicated that SUA might serve as a potential biomarker for assessing the severity of diabetic retinopathy in individuals with diabetes, but it could not predict its onset[9]. Epidemiology evidence has suggested that SUA independently predicts the development of kidney disease in both diabetes mellitus and T2DM patients[4,10-12]. However, large population-based prospective cohort studies are scarce. Hyperuricemia has also been reported in several studies to be associated with an increased risk of peripheral neuropathy in patients with T2DM[13-16], but these studies were predominantly based on Asian populations. Given that there are currently no effective treatments for diabetic neuropathy, early prediction and prevention are of particularly importantance[17].
Therefore, in this study, we aimed to investigate the association between hyperuricemia and incident diabetic retinopathy, nephropathy, and neuropathy in individuals with T2DM who were enrolled in the large-scale, population-based UK Biobank cohort study. We hope that this study will offer some valuable reference for the prevention of the onset of these diseases.
MATERIALS AND METHODS
Study design and population
The UK Biobank is a large population-based prospective cohort study that enrolled over 500,000 individuals aged 37–82 years. These participants were recruited from 22 assessment centers across the United Kingdom between 2006 and 2010[18]. Upon enrollment, participants completed a touchscreen questionnaire, underwent a comprehensive interview and a clinical examination conducted by a trained nurse, and provided blood, urine, and saliva samples. These samples were subsequently assessed for biochemistry markers[18]. The UK Biobank study received approval from the Northwest Multi-Centre Research Ethical Committee (ethical approval was covered under NHS National Research Ethics Service). All participants provided written informed consent before enrollment, and the enrollment process was carried out in accordance with principles outlined in the Declaration of Helsinki.
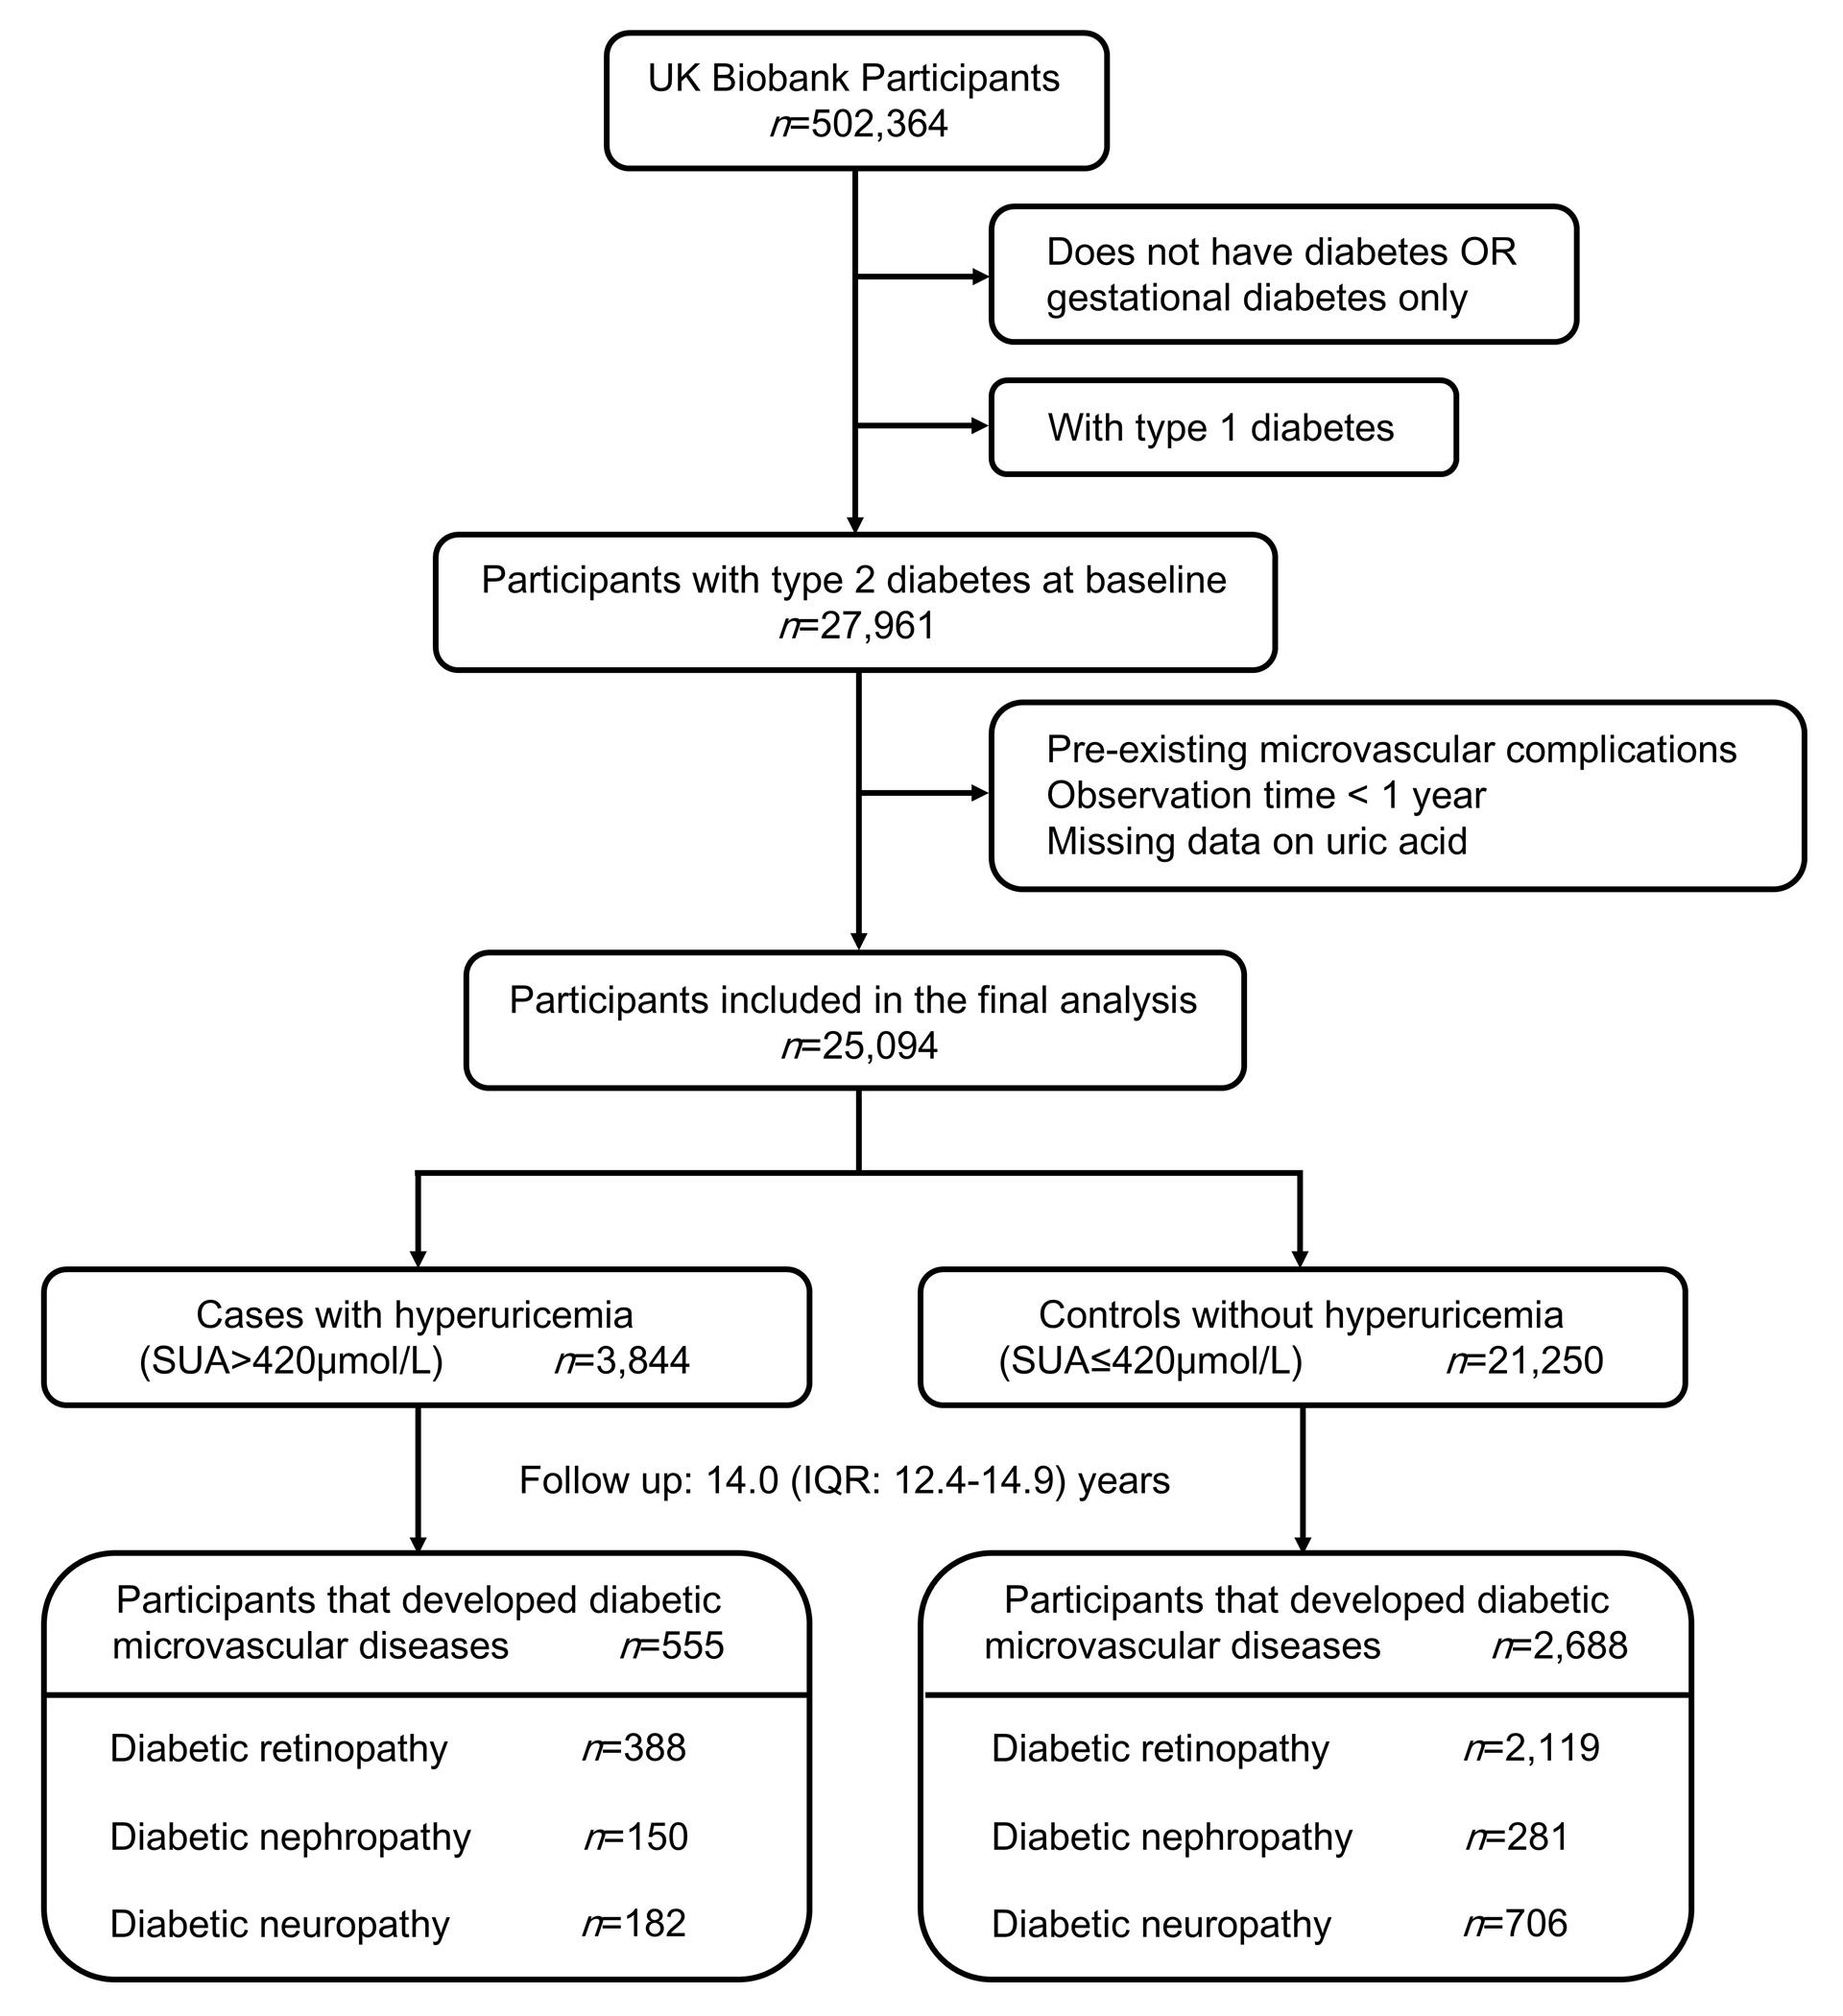
We conducted this prospective study using baseline data collected by UK Biobank from 2006 to 2010 and individual outcomes gathered at multiple subsequent time points following enrollment. Individuals with T2DM at baseline were identified using the Eastwood algorithm[19] and/or based on a measured HbA1c >=48mmol/mol. The Eastwood algorithm integrates self-reported and interviewed information, such as diabetes diagnosis, age at diagnosis, sex, and the use of glucose-lowering medications, among others. We excluded participants who had pre-existing diabetic microvascular complications, those who were observed for less than 1 year (to minimize the potential for reverse causation), and individuals with no available baseline serum urate data. In total, 25,094 participants (all adults, aged between 40 and 72 at enrollment) with T2DM were included in the final analysis (Figure 1).
Figure 1 Flowchart of participant enrollment
Assessment of urate
Blood samples of participants in the UK Biobank were collected during the recruitment process. Serum urate levels (μmol/L) were measured using the uricase-based Pedigree Analysis Package analysis on a Beckman Coulter AU5800 platform (Randox Biosciences, Crumlin, United Kingdom). Additional details regarding serum biomarker measurements and assay performances are outlined in the UK Biobank’s online protocol. Hyperuricemia was defined as serum urate level greater than 420 μmol/L[6,20,21].
Outcome ascertainment
Cases of diabetic microvascular complications were identified from hospital inpatient records that were coded in accordance with ICD-10 coding system (Supplementary Table 1). Hospital inpatient records encompass data on admissions and diagnoses, which are sourced from the Hospital Episode Statistics for England, the Scottish Morbidity Record data for Scotland, and the Patient Episode Database for Wales. At the time of our analysis, health outcome data were accessible up to August 2023. We calculated the follow-up duration as the time elapsed between the date of enrollment and the date of diabetic microvascular incidence, date of death, date lost to follow-up, or the end of follow-up, whichever occurred first. The follow-up duration for the study population ranged from 1 to 16.4 years,with a median follow-up of 14.0 years.
Table 1 Baseline characteristics of the participants
Total
Control
(Uric acid<=420umol/L)
Hyperuricemia
(Uric acid>420umol/L)
P value
Samplesize, N(%)
25094(100)
21250(84.7)
3844(15.3)
Age(yrs), median(IQR)
61(55-65)
61(55-65)
62(57-66)
<0.001
Sex, N(%)
<0.001
Male
15549(62.0)
12709(59.8)
2840 (73.9)
Female
9545(38.0)
8541(40.2)
1004(26.1)
Ethnicity, N(%)
<0.001
White
21495(81.2)
18108(85.7)
3387(88.9)
Non-White
3443(13.8)
3018(14.3)
425(11.1)
Education level, N(%)
0.088
College or university degree
5767(23.6)
4943(23.8)
824 (21.9)
Professional qualifications
6817(27.8)
5767(27.8)
1050(27.9)
A-levels/AS levels
1148(4.7)
960(4.6)
188(5.0)
O-levels/GCSEs/CSEs or equivalent
3858(15.8)
3261(15.7)
597(15.9)
None of the above
6902(28.2)
5799(28.0)
1103(29.3)
Townsend deprivation index, median(IQR)
-1.18(-3.16-2.10)
-1.21(-3.18-2.07)
-1.07(-3.07-2.21)
0.018
Smoking status, N(%)
<0.001
Never
11228(45.2)
9669(45.9)
1559(41.0)
Previous
10708(43.1)
8845(42.1)
1863(49.0)
Current
2891(11.6)
251(12.0)
379(10.0)
Alcohol intake, N(%)
<0.001
Never or special occasions only
8675(34.7)
7512(35.5)
1163(30.4)
1-3 times per month
3050(12.2)
2617(12.4)
433(11.3)
1-4 times per week
9643(38.6)
8125(38.4)
1518(39.7)
Daily or almost daily
3602(14.4)
2891(13.7)
711(18.6)
Meat intake(times/week), median(IQR)
8(6-10.5)
8(6-10)
8.5(6.5-11)
<0.001
BMI(kg/m2), median(IQR)
30.8(27.6-34.8)
30.4(27.3-34.4)
32.7(29.4-36.9)
<0.001
SBP(mmHg), median(IQR)
140.5(129.5-152.5)
140.5(129.5-152.5)
140(129-152)
0.065
DBP(mmHg), median(IQR)
82(75.5-88.5)
82(75.5-89)
81.5(74.5-88)
<0.001
LDL-C(mmol/L), median(IQR)
2.7(2.2-3.3)
2.7(2.2-3.3)
2.7(2.2-3.3)
0.738
HDL-C(mmol/L), median(IQR)
1.1(0.97-1.34)
1.1(0.98-1.36)
1.1(0.93-1.26)
<0.001
HbA1c(mmol/mol), median(IQR)
50.3(44.1-58.4)
50.7(44.5-59.3)
48.6(42.7-53.9)
<0.001
eGFR(mL/min/1.73m2), median(IQR)
97.0(85.2-103.2)
98.0(88.2-103.8)
85.2(69.1-98.0)
<0.001
Glucose-lowering therapy, N(%)
15422(61.5)
13175(62.0)
2247(58.5)
<0.001
Urate-lowering therapy, N(%)
931(3.9)
803(4.0)
128(3.4)
0.112
Duration of diabetes(yrs), median(IQR)
4(1-8)
4(1-8)
4(1-8)
0.025
Family history of diabetes, N(%)
11067(45.2)
9533(46.0)
1534(40.9)
<0.001
Abbreviations:BMI body mass index, SBP systolic blood pressure, DBP diastolic blood pressure, LDL-C low density lipoprotein cholesterol, HDL-C high density lipoprotein cholesterol, HbA1c glycated hemoglobin A1c, eGFR estimated glomerular filtration rate, IQR interquartile range
Covariates
Individual baseline characteristics were derived from baseline questionnaires and blood sample measurements. We incorporated data on the following aspects: 1) sociodemographic characteristics, including age, sex, ethnicity, the Townsend deprivation index (a higher index indicates more deprivation), and education level; 2) lifestyle factors, including smoking status, alcohol consumption, and meat intake; 3) physical and biochemical measurements, such as body mass index (BMI), systolic blood pressure (SBP), low-density lipoprotein cholesterol (LDL-C), glycosylated hemoglobin (HbA1c), and estimated glomerular filtration rate (eGFR); 4) medical history and medication use, including the duration of diabetes, family history of diabetes, and the use of glucose-lowering and urate-lowering medications.
Ethnicity was categorized into two groups: White British (including British, Irish, White, or any other White background) and non-white British. Meat intake was determined by combing the weekly consumption frequencies of processed meat, poultry, beef, lamb/mutton, pork, oily fish, and non-oily fish. BMI was calculated according to the standards of the World Health Organization (WHO) using the formula weight (kg) divided by height(m)[2]. SBP was derived from the average of the two baseline recordings. eGFR was calculated using serum creatinine and the new CKD-EPI equation proposed by Chronic Kidney Disease Epidemiology Collaboration[22]. The duration of diabetes was defined as age at recruitment minus self-reported age at diabetes diagnosis. Individuals with undiagnosed T2DM, identified based on HbA1c levels, were assigned a diabetes duration of zero. Individuals were considered to have family history of diabetes if their biological parents or siblings had been diagnosed with diabetes. The use of medications to lower glucose (including insulin) and urate was either self-reported or recorded by a trained nurse (Supplementary Table 2).
Statistical analysis
Non-normally distributed variables were presented as median and interquartile ranges (IQRs), whereas categorical variables were reported as frequencies and percentage. Sociodemographic and clinical characteristics among the included individuals were compared using chi-square test or Wilcoxon rank-sum test. Cox proportional hazards regression models were used to estimate aHRs with 95% CIs for diabetic microvascular complications. Specifically, three multivariable regression models were constructed to account for potential confounding factors.
Heterogeneity was evaluated by stratifying the primary analysis according to prespecified subgroups: age, sex, ethnicity, diabetes duration, BMI, SBP, HbA1c, eGFR, glucose-lowering medication use (yes/no), insulin use (yes/no), urate-lowering medication use (yes/no), and family history of diabetes (yes/no). To assess whether the associations between hyperuricemia and three types of microvascular complications varied across these stratification variables, potential effect modification was examined using the interaction models.
Sensitivity analyses were conducted by sequentially incorporating additional covariates into the final multivariate model (Model 3): leisure-time physical activity, annual household income, the urine albumin/creatinine ratio (A/C ratio), and substituting LDL-C with high density lipoprotein cholesterol (HDL-C) or total cholesterol (TC). To further assess the robustness of our findings, we excluded outcomes that occurred within two years of follow-up and individuals with eGFR<60ml/min/1.73m2 at baseline. Potential non-linear associations between SUA and microvascular complications were analyzed using restricted cubic splines (RCS), with predefined knots placed at the 5th, 35th, 65th, and 95th percentiles of the exposure distribution. Statistical analyses were performed using Stata software 16.0 (StataCorp LLC, College Station, Texas USA) and R software version 4.4.1 (R Core Team, Vienna, Austria). A two-tailed test with a significance level of P<0.05 was considered statistically significant.
RESULTS
A total of 25,094 individuals with T2DM were included in our final analysis (median age: 61 years; 38.0% female). Among them, 3,844 (15.3%) were classified as having hyperuricemia. Compared with individuals without hyperuricemia, those with hyperuricemia were more likely to be older, male, white, and socioeconomically deprived, and they reported more alcohol consumption and meat intake. They also tended to have higher BMI, lower DBP, HDL-C, HbA1c, eGFR, shorter diabetes duration, less prevalent use of glucose-lowering medications, and lower prevalence of family history of diabetes (Table 1).
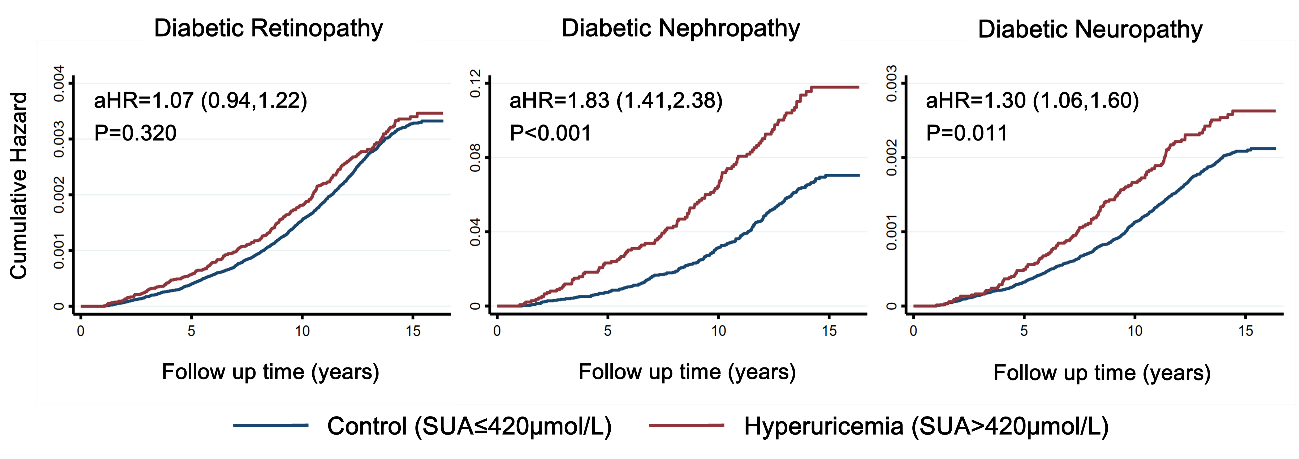
During a median follow-up of 14.0 years (IQR: 12.4-14.9 years) , 3,243 (12.9%) individuals developed diabetic microvascular complications, including 2,507 (10.0%) with diabetic retinopathy, 431 (1.7%) with diabetic nephropathy, and 888 (3.5%) with diabetic neuropathy. Among those with hyperuricemia, 555 (14.4%) developed diabetic microvascular complications, compared with 2,688 (12.6%) among those without hyperuricemia (P=0.002). Using Cox proportional hazards models, hyperuricemia was independently and significantly associated with an increased risk of diabetic nephropathy and neuropathy but not with diabetic retinopathy (Table 2). In the fully adjusted model (Model 3), which included covariates accounting for socioeconomic status, lifestyle factors, physical/biochemical measurements, and medication use, individuals with hyperuricemia had an 82.9% higher risk for nephropathy (aHR: 1.83, 95%CI: 1.41-2.38, P<0.001) and 30.2% higher risk for neuropathy (aHR: 1.30, 95%CI: 1.06–1.60, P=0.011) compared with those without hyperuricemia. In contrast, diabetic retinopathy showed a non-significant aHR of 1.07 (95%CI: 0.94-1.22, P=0.320). The Kaplan-Meier plot, adjusted using Model 3, visually demonstrated the hazard ratio correlation (Figure 2).
Table 2 Hyperuricemia and risk of diabetic microvascular complications among individuals with T2DM
Diabetic Retinopathy
Diabetic Nephropathy
Diabetic Neuropathy
HR (95%CI)
Pvalue
HR (95%CI)
Pvalue
HR (95%CI)
P value
Unadjusted
1.09 (0.98,1.21)
0.121
3.20 (2.62,3.90)
<0.001
1.53 (1.30,1.80)
<0.001
Model 1
1.07 (0.96,1.19)
0.232
3.08 (2.51,3.77)
<0.001
1.41 (1.19,1.66)
<0.001
Model 2
1.07 (0.95,1.20)
0.253
3.15 (2.54,3.89)
<0.001
1.41 (1.18,1.67)
<0.001
Model 3
1.07 (0.94,1.22)
0.320
1.83 (1.41,2.38)
<0.001
1.30 (1.06,1.60)
0.011
Model 1: adjusted for age, sex, ethnicity, Townsend deprivation index and education level. Model 2: Model 1+ smoking status, alcohol intake and meat intake. Model 3: Model 2+body mass index, systolic blood pressure, low density lipoprotein-cholesterol, glycated hemoglobin, estimated glomerular filtration rate, glucose-lowering therapy, urate-lowering therapy, duration of diabetes and family history of diabetes.
Figure 2 Kaplan-Meier plot of the cumulative probability of diabetic microvascular complication risk
Note:The red line refers to the hyperuricemia group, and the blue line refers to the control group.
The associations between hyperuricemia and nephropathy/neuropathy were not significantly modified when stratified by age, sex, ethnicity, duration of diabetes, BMI, SBP, HbA1c, eGFR, family history of diabetes, glucose-lowering medication use (combined), insulin use and urate-lowering medication use (all P>0.05). However, the risk of diabetic retinopathy in individuals with hyperuricemia appeared to be higher among those with better control of diabetes (HbA1c<53mmol/mol, P=0.029) (Table 3).
Table 3 Hyperuricemia and risk of diabetic microvascular complications among individuals with T2DM stratified by subgroups
Subgroup
Total
Diabetic Retinopathy
Diabetic Nephropathy
Diabetic Neuropathy
Events
aHR*(95%CI)
P
Pinteraction
Events
aHR*(95%CI)
P
Pinteraction
Events
aHR*(95%CI)
P
Pinteraction
Age(yrs)
0.764
0.756
0.809
<60
10051
905
1.08(0.85,1.37)
0.545
156
2.09(1.34,3.28)
0.001
348
1.39(0.99,1.95)
0.058
>=60
15043
1602
1.05(0.89,1.23)
0.572
275
1.73(1.26,2.38)
0.001
540
1.23(0.95,1.58)
0.121
Sex
0.681
0.956
0.205
Male
15549
1561
1.03(0.88,1.21)
0.682
299
1.86(1.38,2.51)
<0.001
610
1.37(1.09,1.73)
0.008
Female
9545
946
1.07(0.83,1.38)
0.586
132
1.80(1.05,3.08)
0.032
278
1.00(0.64,1.57)
0.987
Ethnicity
0.367
0.894
0.195
White
21495
2038
1.05(0.91,1.21)
0.485
346
1.80(1.35,2.38)
<0.001
782
1.35(1.09,1.67)
0.006
Non-white
3443
448
1.16(0.79,1.70)
0.462
81
1.99(0.98,4.02)
0.057
98
0.71(0.30,1.68)
0.429
Duration of diabetes(yrs)
0.864
0.810
0.943
<5
12893
796
1.14(0.91,1.43)
0.265
133
1.62(1.02,2.57)
0.041
283
1.33(0.94,1.88)
0.106
>=5
10760
1582
1.09(0.92,1.28)
0.335
276
2.00(1.45,2.76)
<0.001
567
1.33(1.03,1.71)
0.031
Body mass index(kg/m2)
0.370
0.268
0.986
<30
10953
1036
0.98(0.76,1.25)
0.848
151
1.90(1.21,2.98)
0.005
301
1.35(0.91,2.01)
0.139
>=30
13920
1433
1.18(1.01,1.39)
0.041
269
1.94(1.42,2.67)
<0.001
572
1.44(1.13,1.83)
0.003
SBP(mmHg)
0.314
0.938
0.839
<140
11374
1085
1.16(0.95,1.41)
0.143
185
1.68(1.11,2.55)
0.014
442
1.32(1.00,1.76)
0.053
>=140
12300
1346
0.96(0.80,1.16)
0.682
238
1.77(1.25,2.51)
0.001
420
1.27(0.94,1.70)
0.120
HbA1c(mmol/mol)
0.029
0.079
0.419
<53
14432
964
1.21(1.00,1.45)
0.044
176
2.31(1.59,3.34)
<0.001
356
1.45(1.09,1.92)
0.011
>=53
9428
1400
0.98(0.80,1.20)
0.863
228
1.48(1.01,2.18)
0.046
474
1.22(0.90,1.66)
0.195
eGFR(mL/min/1.73m2)
0.080
0.231
0.058
<90
8150
889
1.22(1.03,1.44)
0.024
260
3.03(2.26,4.05)
<0.001
318
1.70(1.30,2.22)
<0.001
>=90
16944
1618
0.99(0.80,1.22)
0.910
171
1.78(1.08,2.92)
0.023
570
1.13(0.82,1.54)
0.457
Glucose-lowering medication
0.436
0.838
0.900
No
9664
444
1.20(0.89,1.63)
0.236
65
1.52(0.77,2.98)
0.226
153
1.24(0.78,1.98)
0.357
Yes
15422
2062
1.09(0.94,1.27)
0.271
366
2.01(1.51,2.69)
<0.001
735
1.38(1.09,1.73)
0.007
Insulin
3256
752
1.04(0.80,1.36)
0.775
136
1.83(1.10,3.05)
0.020
291
1.69(1.16,2.45)
0.006
Urate-lowering medication
0.297
0.112
0.781
No
22968
2357
1.09(0.95,1.25)
0.195
400
1.70(1.29,2.24)
<0.001
816
1.30(1.05,1.61)
0.015
Yes
931
89
0.57(0.26,1.25)
0.159
27
4.05(1.44,11.37)
0.008
58
1.66(0.76,3.63)
0.203
Family history of diabetes
0.431
0.503
0.952
No
13400
1252
1.03(0.86,1.23)
0.759
219
1.68(1.17,2.39)
0.005
457
1.32(1.01,1.73)
0.043
Yes
11067
1172
1.18(0.96,1.44)
0.109
207
2.19(1.48,3.24)
<0.001
406
1.34(0.97,1.84)
0.074
*Adjusted with Model 3 for age, sex, ethnicity, Townsend deprivation index, education level, smoking status, alcohol intake, meat intake, body mass index, systolic blood pressure, low density lipoprotein-cholesterol, glycated hemoglobin, eGFR, glucose-lowering medication, urate-lowering medication, duration of diabetes and family history of diabetes
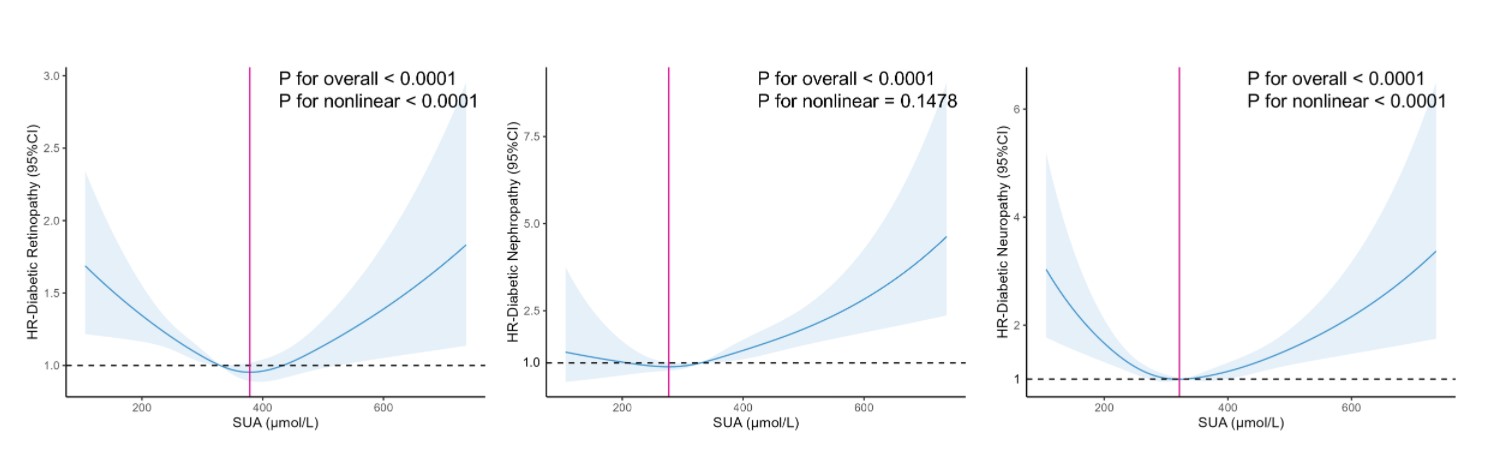
In sensitivity analyses, by sequentially adding and replacing covariates (including leisure-time physical activity, annual household income, A/C ratio, HDL-C, TC) into Model 3, hyperuricemia remained significantly associated with an increased risk of diabetic nephropathy and neuropathy but not with diabetic retinopathy (Supplementary Table 3). The results remained consistent after excluding outcomes that occurred within two years of follow-up and excluding individuals with eGFR<60ml/min/1.73m2 at baseline (Supplementary Table 4). Additionally, we analyzed the SUA level as a continuous variable to evaluate the impact of the binary classification of hyperuricemia on the aHR of disease occurrence. RCS regression was used to access a potential nonlinear association between SUA levels and microvascular complications (Supplemental Figure 1). A U-shaped relationship was observed between diabetic retinopathy and SUA level (P for non-linear < 0.0001), with the lowest risk occurring at approximately 378.6 μmol/L and increasing risk in both directions away from this value. Similarly, diabetic neuropathy demonstrated a U-shaped relationship with SUA (P for non-linearity <0.0001), with minimal risk at 321.6 μmol/L. In contrast, no statistically significant nonlinear association was found between SUA and diabetic nephropathy (P for non-linearity = 0.1478), although the lowest aHR occurred at 277.2 μmol/L.
DISCUSSION
In this large prospective cohort study using data from 25,094 middle aged and elderly individuals with T2DM from the UK Biobank, we found that hyperuricemia was significantly associated with incident diabetic nephropathy and neuropathy but not with diabetic retinopathy. Compared with individuals with normal SUA levels, T2DM patients with hyperuricemia had an 82.9% higher risk of developing diabetic nephropathy and a 30.2% higher risk of developing neuropathy, but not increased risk of retinopathy. The robustness of these finding was further validated through stratified analyses and sensitivity analyses.
Regarding whether patients with T2DM and hyperuricemia are more prone to developing diabetic retinopathy, previous studies have yielded inconsistent findings. Some studies have suggested that elevated SUA increase the risk of diabetic retinopathy[23-26], whereas others have proposed that high SUA is a protective factor[27], and still others have reported no significant associations[28,29]. In 2014, a 3-year prospective study of 749 patients with T2DM and without proliferative diabetic retinopathy concluded that patients with SUA >=420μmol/L (7.0mg/dl) had an HR of 3.66 (95% CI: 1.92-7.00, P<0.001) for progression in the severity of diabetic retinopathy compared with patients with SUA <294μmol/L (4.9mg/dl)[23]. Another 2-year prospective study conducted with 1,839 T2DM patients without diabetic retinopathy in Japan found that men with SUA >=386μmol/L had 117% higher risk (95% CI: 1.40-3.37; P=0.001) of developing diabetic retinopathy compared with patients with SUA levels <280μmol/L, whereas no significant association was observed in women[24]. However, a study in China demonstrated that among individuals with T2DM, elevated SUA levels were an independent protective factor against diabetic retinopathy (OR=0.997, 95% CI: 0.995-0.999, P=0.018)[27]. A meta-analysis concluded that there was no statistically significant association between higher SUA levels and diabetic retinopathy[28]. A recent Mendelian randomization study also failed to establish a causal relationship between genetically predicted SUA levels and diabetic retinopathy (OR=1.09, 95% CI: 0.94-1.26, P=0.249)[29]. In our study, no significant association was observed. Subgroup analyses also did not reveal any sex-related differences. We hypothesize that these discrepancies in conclusions may be attributable to the covariates included in the regression models. Compared with the aforementioned studies, our analysis leveraged the large-scale UKB database and implemented more rigorous adjustments for sociodemographic characteristics, lifestyle factors, family history of diseases, and medication use. Our multivariate regression results demonstrated that variables such as the Townsend deprivation index, smoking and alcohol consumption status, and the use of glucose-lowering medications significantly influenced the risk of diabetic retinopathy. Additionally, as supported by a prior research[28], variations in study populations across different regions, including differences in ethnicity and related dietary and lifestyle habits, may also contribute to the inconsistent findings.
Consistent with our findings, a review article published in 2013 by researchers from the United States concluded that elevated SUA level could predict the development and progression of chronic kidney disease in individuals with T2DM[10]. This association was further validated by cell culture experiments and animal models[30,31]. A series of studies using longitude data from the Associazione Medici Diabetologi (AMD) annals initiative in Italy also suggested a positive association between hyperuricemia and diabetic kidney impairment in patients with T2DM. They reported a HR of 2.61 (95% CI: 1.98-3.42; P<0.001) when comparing the fifth quintile of SUA (>=348μmol/L in women and >=384 μmol/L in men) with the lowest quintile (<222 μmol/L in women and <258 μmol/L in men)[11,32,33]. The EMPA-REG OUTCOME trial, a multicenter randomized double-blind study of 7,020 patients with T2DM, also reported that high SUA levels (>=387.21μmol/L) were a risk factor for incident and worsening nephropathy (aHR: 1.77; 95%CI: 1.33-2.34, P<0.001; compared with SUA<309.3 μmol/L)[34]. The trial further reported an improvement in kidney outcomes when patients were treated with empagliflozin, a glucose-lowering medication for T2DM. However, in our study, we did not observe a significant difference in HR between individuals with or without glucose-lowering medication (subgroup analyses presented a P for interaction of 0.831). Additionally, insulin did not reduce the risk of diabetes nephropathy in T2DM patients.
The evidence regarding the association between hyperuricemia and neuropathy has been limited and inconclusive. To our knowledge, no longitude studies have been conducted to date. Our study is the first to confirm the association between hyperuricemia and the development of diabetic neuropathy using a large cohort. Consistent with our findings, a meta-analysis in 2016, which included only cross-sectional and case-control studies, concluded that hyperuricemia (SUA>408μmol/L) was independently associated with an increased risk of diabetic peripheral neuropathy (aHR: 1.95, 95%CI: 1.23-3.11, P=0.005)[13]. This association was later supported by other cross-sectional studies, which further suggested a higher risk in men and younger (age<65) T2DM patients[14,15,35]. However, in other studies, low SUA levels were significantly associated with an increased risk of neuropathy in patients with both T2DM and T1DM[36-38]. This inconsistency in results may come from differences in study designs, sample sizes, follow-up durations, and diagnoses criteria.
Through stratified analysis, we observed that among individuals with T2DM and lower HbA1c levels (<53mmol/mol), those with hyperuricemia appeared to have a higher risk of retinopathy. We hypothesize that the following biological mechanisms may be involved. Firstly, there may be a shift in dominant metabolites. In patients with better glycemic control, the direct damage caused by hyperglycemia to retinal microvessels is partially mitigated, while non-glycemic metabolic factors, such as SUA levels, may become prominent. At this stage, hyperuricemia exerts a more significant impact on retinal microvasculature through pathways such as inflammation, oxidative stress, and endothelial dysfunction. Secondly, hyperuricemia has been reported to be associated with the pathogenesis of T2DM, including insulin resistance and β-cell dysfunction[39-40]. In other words, even if the HbA1c levels have not been significantly increased in the early stages of diabetes among patients with hyperuricemia or have been well controlled through medication, elevated SUA levels may exacerbate the progression of T2DM by worsening insulin resistance and impairing β-cells function, thereby collectively contributing to the development of diabetic retinopathy.
In our study, hyperuricemia was defined as SUA levels >420μmol/L, which represents the saturation concentration of uric acid in human blood. The definition of hyperuricemia varies widely across published studies[41]. Due to the uricosuric effects of estrogen, an earlier consensus was that premenopausal women were considered hyperuricemic with SUA levels >360μmol/L, while postmenopausal women and men were diagnosed with hyperuricemia when SUA levels exceeded 420μmol/L[42]. The female population included in our study was generally older, with the majority (89.0%) exceeding the average menopausal age of 50 (median age: 61 years, mean age: 59.2 years). Given that their SUA levels were likely no longer significantly influenced by estrogen, we carefully selected 420μmol/L as the cut-off value for hyperuricemia, without distinction between genders.
Sensitivity analysis using RCS indicated that when SUA levels exceeded 420 µmol/L (indicative of hyperuricemia), the risk of microvascular complications escalated with rising SUA concentrations. Both elevated and low SUA levels were associated with an increased risk, and the specific cut-off values for the onset of these three diseases (retinopathy, nephropathy, and neuropathy) were all found to be below 420 µmol/L (378.6 μmol/L for retinopathy, 277.2 μmol/L for nephropathy and 321.6 μmol/L for neuropathy). These findings complemented our analysis of binary classification (hyperuricemia vs. non-hyperuricemia) and revealed that diabetic retinopathy, similar to nephropathy and neuropathy, is influenced by SUA, exhibiting comparable risk trends. We hypothesize that the non-significant correlation of retinopathy at the 420 µmol/L cutoff might be attributed to the high proportion of individuals with SUA < 378.6 µmol/L (71.9% of the study population), as low SUA levels also confer a high risk of disease.
It is noteworthy that the prevalence of hyperuricemia in our study was 15.3% (18.3% in men and 10.5% in women). When combined with the 82.9% and 30.2% higher risk of diabetic nephropathy and neuropathy, respectively, these alarmingly high figures not only suggested an underlying mechanism of comorbidity between hyperglycemia and hyperuricemia but also underscore the need for increased attention and more proactive clinical strategies to manage SUA levels in individuals with T2DM. We propose managing this through the following approaches. Firstly, it is crucial to enhance the monitoring of SUA levels. For instance, routine annual assessments of SUA are recommended for patients. For elder patients, those with a long disease duration, and/or those with comorbid conditions such as obesity, hypertension, or renal impairment, the frequency of monitoring should be increased. Additionally, different target SUA levels should be established for various patient populations based on their disease states (specific values require further investigation). Secondly, with regard to the management of hyperuricemia, non-pharmacological interventions should be prioritized. This involves lifestyle modifications, including dietary adjustments and increased physical activity. For T2DM patients with hyperuricemia, it is advisable to recommend a reduction in the intake of high-purine foods and an increase in water consumption. Encouraging aerobic exercise for weight management in overweight patients is also important, as is promoting smoking cessation. For patients requiring pharmacological intervention, medications that can effectively lower both blood glucose and SUA levels, such as SGLT-2 inhibitors, should be preferred, and urate-lowering medications should be used as necessary.
The association between hyperuricemia and diabetic microvascular diseases in individuals with diabetes may be attribute to several potential biological mechanisms. Hyperglycemia is responsible for upregulation of cytokines and inflammatory factors, as well as the production of polyols and advanced glycation end-product (AGEs), which can lead to various metabolic injuries including endothelial damage and extravascular protein deposition[43]. In addition to the hyperglycemic state, the metabolic microenvironmental changes induced by SUA may collectively exacerbate damage to cells and tissues. Although some studies have suggested that SUA acts as an antioxidant in the body and may reduce the risk of certain diseases, the role of SUA as a mediator of vascular endothelial damage has been widely acknowledged in light of the increasing epidemiological evidence[44]. Animal experiments have demonstrated that elevated SUA levels induce oxidative stress, chemokines productions, and epithelial-to-mesenchymal transition, which may affect the renal cell populations, resulting in increased renal vascular resistance and decreased renal blood flow[45,46]. The peripheral nervous system and microvascular system are physiologically codependent. The microvascular damage mentioned above may lead to insufficient nerve nutrient supply. Additionally, abnormal glucose and urate levels in neurons may also contribute to pathologies such as oxidative stress, production of advanced glycation end-product, and activation of protein kinase C[47,48]. The non-significant association between hyperuricemia and diabetic retinopathy may be due to the greater contribution of hyperglycemia to the pathogenesis of diabetic retinopathy[49,50], or may arise from differences in the distribution of receptors related to vascular metabolism in different body regions. Nevertheless, the exact mechanisms underlying the associations between hyperuricemia and diabetic microvascular complications require further elucidation.
Our study was a large population-based prospective cohort with over ten years of follow-up. We meticulously adjusted for a wide range of potential confounding factors, including sociodemographic status, lifestyle factors, physical/biochemical measurements, and medication intake, which should yield a more accurate and robust correlation between hyperuricemia and all three types of diabetic microvascular complications.
However, several limitations should be emphasized. Firstly, since hospital inpatient records were used to ascertain the onset of microvascular complications, there may be underreporting of cases. For instance, mild or moderate cases might not have been captured if they were managed in outpatient or primary care settings. This could lead to an underestimation of incidence rates and, consequently, an underestimation of the magnitudes of the associations observed. Secondly, the single-time serum urate measurement at baseline may not accurately reflect long-term of SUA concentration levels. Calculating the average value from multiple serum urate measurements over time would be more precise. However, due to the constraints inherent in database research, we were unable to obtain additional data. Thirdly, as many co-variates were collected through self-reported data, there is a certain degree of reporting bias. Fourthly, despite the inclusion of numerous confounding factors in our final model, residual confounding and potential bias cannot be completely ruled out. Fifthly, the UK Biobank database is a national study based on UK population. Therefore, the findings of our study may not be directly applicable to other populations. Nevertheless, they contribute to filling the gaps in existing studies regarding the risk of developing microvascular complications among Western European diabetic patients.
CONCLUSIONS
In conclusion, this long-term follow-up prospective cohort study, which included 25,094 individuals with T2DM from the UK Biobank, provided compelling evidence that hyperuricemia was significantly associated with an increased risk of diabetic nephropathy and neuropathy, but not retinopathy. These findings highlighted the significance of incorporating SUA monitoring and control into clinical assessments for the prevention and management of diabetic nephropathy and neuropathy among adults with T2DM.
Supplementary Table 1 ICD-10 codes used to determine diabetic microvascular complications in UK biobank
Disease
ICD-10 codes
Diabetic retinopathy
H36.0
Diabetic neuropathy
E10.4, E11.4, E12.4, E13.4, E14.4
G59.0, G63.2, G99.0
Diabetic nephropathy
E10.2, E11.2, E12.2, E13.2, E14.2
N08.3
Supplementary Table 2 UK Biobank medication codes included in our study
Supplementary Table 3 Sensitivity analyses of association between hyperuricemia and risk of diabetic microvascular complications among individuals with T2DM by sequentially adjusting for leisure-time physical activity, annual household income before tax, urine albumin/creatinine ratio, by replacing LDL-C with HDL-C or total cholesterol, and by replacing SBP with DBP.
Diabetic Retinopathy
Diabetic Nephropathy
Diabetic Neuropathy
HR (95%CI)
P value
HR (95%CI)
P value
HR (95%CI)
P value
Model 3 +physical activity
1.07(0.92,1.25)
0.375
1.73(1.27,2.37)
0.001
1.36(1.07,1.72)
0.011
Model 3 +income
1.12(0.97,1.29)
0.138
1.88(1.41,2.51)
<0.001
1.32(1.06,1.65)
0.014
Model 3 +physical activity +income
1.10(0.94,1.30)
0.240
1.82(1.30,2.54)
<0.001
1.37(1.06,1.76)
0.015
Model 3 +A/C ratio
0.99(0.84,1.18)
0.934
1.67(1.24,2.27)
0.001
1.36(1.06,1.74)
0.016
Model 3 -LDL-C +HDL-C
1.05(0.91,1.21)
0.491
1.83(1.38,2.41)
<0.001
1.34(1.09,1.66)
0.007
Model 3 -LDL-C +TC
1.02(0.85,1.22)
0.833
2.18(1.57,3.02)
<0.001
1.31(1.00,1.72)
0.046
Model 3 -SBP +DBP
1.06(0.92,1.21)
0.416
1.78(1.37,2.31)
<0.001
1.29(1.05,1.59)
0.014
Physical activity: leisure-time physical activity, calculated by combining intensity, frequency and duration of sports/exercise and expressed in conventional metabolic equivalents of task (MET)-h/week (continuous). Income: annual household income before tax (<31000£, >=31000£). A/C ratio: urine albumin/creatinine ratio (continuous).LDL-C: low density lipoprotein cholesterol (continuous). HDL-C: high density lipoprotein cholesterol (continuous). TC: total cholesterol (continuous). SBP: systolic blood pressure (continuous). DBP: diastolic blood pressure (continuous). Model 3: adjusted for age, sex, ethnicity, Townsend deprivation index, education level, smoking status, alcohol intake, meat intake, body mass index, SBP, LDL-C, eGFR, glycated hemoglobin, glucose-lowering medication, urate-lowering medication, duration of diabetes and family history of diabetes.
Supplementary Table 4 Sensitivity analyses of association between hyperuricemia and risk of diabetic microvascular complications after excluding outcomes occurred within 2 years of follow-up and by excluding individuals with eGFR<60ml/min/1.73m2 at baseline.
Diabetic Retinopathy
Diabetic Nephropathy
Diabetic Neuropathy
HR (95%CI)
P value
HR (95%CI)
P value
HR (95%CI)
P value
Excluding outcomes occurred within 2 years of follow-up
1.05 (0.91,1.20)
0.510
1.76(1.34,2.31)
<0.001
1.29(1.04,1.59)
0.020
Excluding individuals with eGFR<60ml/min/1.73m2 at baseline
1.06(0.92,1.23)
0.435
1.82 (1.33,2.49)
<0.001
1.33(1.07,1.67)
0.012
Supplemental Figure 1 Restricted cubic spline models for associations between serum uric acid (SUA) levels and diabetic microvascular complications
List of abbreviations
Type 2 diabetes mellitus (T2DM)
Type 1 diabetes mellitus (T1DM)
Serum uric acid (SUA)
International Classification of Diseases (ICD)
Adjusted hazard ratios (aHR)
Body mass index (BMI)
Systolic blood pressure (SBP)
Low density lipoprotein cholesterol (LDL-C)
Glycosylated hemoglobin (HbA1c)
Estimated glomerular filtration rate (eGFR)
World Health Organization (WHO)
Interquartile range (IQR)
High density lipoprotein cholesterol (HDL-C)
Urine albumin/creatinine ratio (A/C ratio)
Total cholesterol (TC)
Correction notice
None
Acknowledgement
We are grateful to the participants and the team of the UK Biobank study. This research was carried out using the UK Biobank Resource under application number 87083.
Author Contributions
(Ⅰ) Conception and design: Zhenzhen Liu, Guangming Jin, Leyi Hu
(Ⅱ) Administrative support: Zhenzhen Liu
(Ⅲ) Provision of study materials or patients: Zhenzhen Liu
(Ⅳ) Collection and assembly of data: Guangming Jin, Leyi Hu, Yuan Tan, Yiyuan Ma
(Ⅴ) Data analysis and interpretation: Leyi Hu, Yanyu Shen, Jiaxin Jin, Wen Chen, Yinglin Yu, Yunqian Li
(Ⅵ) Manuscript writing: All authors
(Ⅶ) Final approval of manuscript: All authors
Conflict of Interests
None of the authors has any conflicts of interest to disclose. All authors have declare in the completed the ICMJE uniform disclosure form.
Patient consent for publication
Not applicable.
Ethical Statement
This study was conducted in accordance with the principles of the Declaration of Helsinki. The UK Biobank received ethics approval from the North West Multi-centre Research Ethics Committee (REC reference: 21/NW/0157). All participants provided informed written consent, and they had the option to withdraw their personal data from the study at any time. The study was carried out utilizing resources from the UK Biobank, with application number 87083.
Provenance and Peer Review
This article was a standard submission to our journal. The article has undergone peer review with our anonymous review system.
Data Sharing Statement
UK Biobank data is available to researchers on application. More details can be found at https://www.ukbiobank.ac.uk/.
Open Access Statement
This is an Open Access article distributed in accordance with the Creative Commons AttributionNonCommercial-NoDerivs 4.0 International License (CC BY-NC-ND 4.0), which permits the non-commercial replication and distribution of the article with the strict proviso that no changes or edits are made and the original work is properly cited (including links to both the formal publication through the relevant DOI and the license).
Funding
This work was supported by the Guangzhou Basic Research Program, City & University (Institute) Joint Funding Project (2023A03J0174).
References
Sun H, Saeedi P, Karuranga S, et al. IDF Diabetes Atlas: Global, regional and country-level diabetes prevalence estimates for 2021 and projections for 2045. Diabetes Res Clin Pract. 2022, 183: 109119. DOI: 10.1016/j.diabres.2021.109119.
Chen HY, Kuo S, Su PF, et al. Health care costs associated with macrovascular, microvascular, and metabolic complications of type 2 diabetes across time: estimates from a population-based cohort of more than 0.8 million individuals with up to 15 years of follow-up. Diabetes Care. 2020, 43(8): 1732-1740. DOI: 10.2337/dc20-0072.
Litwak L, Goh SY, Hussein Z, et al. Prevalence of diabetes complications in people with type 2 diabetes mellitus and its association with baseline characteristics in the multinational A1chieve study. Diabetol Metab Syndr. 2013, 5(1): 57. DOI: 10.1186/1758-5996-5-57.
Johnson RJ, Bakris GL, Borghi C, et al. Hyperuricemia, acute and chronic kidney disease, hypertension, and cardiovascular disease: report of a scientific workshop organized by the national kidney foundation. Am J Kidney Di. 2018, 71(6): 851-865. DOI: 10.1053/j.ajkd.2017.12.009.
Liang D, Zhu Q, He Y, et al. The interaction between hyperuricemia and low-density lipoprotein cholesterol increases the risk of 1-year post-discharge all-cause mortality in ST-segment elevation myocardial infarction patients. Nutr Metab Cardiovasc Dis. 2023, 33(1): 133-140. DOI: 10.1016/j.numecd.2022.09.011.
Zhang M, Zhu X, Wu J, et al. Prevalence of hyperuricemia among Chinese adults: findings from two nationally representative cross-sectional surveys in 2015-16 and 2018-19. Front Immunol. 2022, 12: 791983. DOI: 10.3389/fimmu.2021.791983.
Chen-Xu M, Yokose C, Rai SK, et al. Contemporary prevalence of gout and hyperuricemia in the United States and decadal trends: the national health and nutrition examination survey, 2007–2016. Arthritis Rheumatol. 2019, 71(6): 991-999. DOI: 10.1002/art.40807.
Ting K, Gill TK, Keen H, et al. Prevalence and associations of gout and hyperuricaemia: results from an Australian population-based study. Intern Med J. 2016, 46(5): 566-573. DOI: 10.1111/imj.13006.
Guo Y, Liu S, Xu H. Uric acid and diabetic retinopathy: a systematic review and meta-analysis. Front Public Health. 2022, 10: 906760. DOI: 10.3389/fpubh.2022.906760.
Johnson RJ, Nakagawa T, Jalal D, et al. Uric acid and chronic kidney disease: which is chasing which? Nephrol Dial Transplant. 2013, 28(9): 2221-2228. DOI: 10.1093/ndt/gft029.
De Cosmo S, Viazzi F, Pacilli A, et al. Serum uric acid and risk of CKD in type 2 diabetes. Clin J Am Soc Nephrol. 2015, 10(11): 1921-1929. DOI: 10.2215/cjn.03140315.
Radcliffe NJ, Seah JM, Clarke M, et al. Clinical predictive factors in diabetic kidney disease progression. J Diabetes Investig. 2017, 8(1): 6-18. DOI: 10.1111/jdi.12533.
Yu S, Chen Y, Hou X, et al. Serum uric acid levels and diabetic peripheral neuropathy in type 2 diabetes: a systematic review and meta-analysis. Mol Neurobiol. 2016, 53(2): 1045-1051. DOI: 10.1007/s12035-014-9075-0.
Kaewput W, Thongprayoon C, Rangsin R, et al. The association between serum uric acid and peripheral neuropathy in patients with type 2 diabetes mellitus: a multicenter nationwide CrossSectional study. Korean J Fam Med. 2020, 41(3): 189-194. DOI: 10.4082/kjfm.18.0205.
Zhang W, Chen L, Lou M. Association of elevated serum uric acid with nerve conduction function and peripheral neuropathy stratified by gender and age in type 2 diabetes patients. Brain Sci. 2022, 12(12): 1704. DOI: 10.3390/brainsci12121704.
Papanas N, Katsiki N, Papatheodorou K, et al. Peripheral neuropathy is associated with increased serum levels of uric acid in type 2 diabetes mellitus. Angiology. 2011, 62(4): 291-295. DOI: 10.1177/0003319710394164.
Elafros MA, Andersen H, Bennett DL, et al. Towards prevention of diabetic peripheral neuropathy: clinical presentation, pathogenesis, and new treatments. Lancet Neurol. 2022, 21(10): 922-936. DOI: 10.1016/S1474-4422(22)00188-0.
Sudlow C, Gallacher J, Allen N, et al. UK biobank: an open access resource for identifying the causes of a wide range of complex diseases of middle and old age. PLoS Med. 2015, 12(3): e1001779. DOI: 10.1371/journal.pmed.1001779.
Eastwood SV, Mathur R, Atkinson M, et al. Algorithms for the capture and adjudication of prevalent and incident diabetes in UK biobank. PLoS One. 2016, 11(9): e0162388. DOI: 10.1371/journal.pone.0162388.
Zhang Y, Cai M, Dilimulati D, et al. Correlation between serum uric acid and body fat distribution in patients with polycystic ovary syndrome. Front Endocrinol (Lausanne). 2022, 12: 782808. DOI: 10.3389/fendo.2021.782808.
Topless RKG, Major TJ, Florez JC, et al. The comparative effect of exposure to various risk factors on the risk of hyperuricaemia: diet has a weak causal effect. Arthritis Res Ther. 2021, 23(1): 75. DOI: 10.1186/s13075-021-02444-8.
Inker LA, Eneanya ND, Coresh J, et al. New creatinine- and cystatin C-based equations to estimate GFR without race. N Engl J Med. 2021, 385(19): 1737-1749. DOI: 10.1056/NEJMoa2102953.
Lee JJ, Yang IH, Kuo HK, et al. Serum uric acid concentration is associated with worsening in severity of diabetic retinopathy among type 2 diabetic patients in Taiwan--a 3-year prospective study. Diabetes Res Clin Pract. 2014, 106(2): 366-372. DOI: 10.1016/j.diabres.2014.07.027.
Kuwata H, Okamura S, Hayashino Y, et al. Serum uric acid levels are associated with increased risk of newly developed diabetic retinopathy among Japanese male patients with type 2 diabetes: a prospective cohort study (diabetes distress and care registry at Tenri [DDCRT 13]). Diabetes Metab Res Rev. 2017, 33(7). DOI: 10.1002/dmrr.2905.
Rivera-De-la-Parra D, Hernández-Jiménez S, Almeda-Valdés P, et al. Association between uric acid and referable diabetic retinopathy in patients with type 2 diabetes. Sci Rep. 2024, 14(1): 12968. DOI: 10.1038/s41598-024-63340-0.
Hu Y, Chan Z, Li C, et al. Higher serum uric acid levels are associated with an increased risk of vision-threatening diabetic retinopathy in type 2 diabetes patients. Invest Ophthalmol Vis Sci. 2021, 62(4): 23. DOI: 10.1167/iovs.62.4.23.
Cui J, Ren JP, Chen DN, et al. Prevalence and associated factors of diabetic retinopathy in Beijing, China: a cross-sectional study. BMJ Open. 2017, 7(8): e015473. DOI: 10.1136/bmjopen-2016-015473.
Xu Y, Zhu J, Gao L, et al. Hyperuricemia as an independent predictor of vascular complications and mortality in type 2 diabetes patients: a meta-analysis. PLoS One. 2013, 8(10): e78206. DOI: 10.1371/journal.pone.0078206.
Wu H, Li X, Zhang W, et al. Causality between serum uric acid and diabetic microvascular complications - a mendelian randomization study. Diabetol Metab Syndr. 2024, 16(1): 134. DOI: 10.1186/s13098-024-01377-x.
Lee HJ, Jeong KH, Kim YG, et al. Febuxostat ameliorates diabetic renal injury in a streptozotocin-induced diabetic rat model. Am J Nephrol. 2014, 40(1): 56-63. DOI: 10.1159/000363421.
Komers R, Xu B, Schneider J, et al. Effects of xanthine oxidase inhibition with febuxostat on the development of nephropathy in experimental type 2 diabetes. Br J Pharmacol, 2016, 173(17): 2573-2588. DOI: 10.1111/bph.13527.
Ceriello A, De Cosmo S, Rossi MC, et al. Variability in HbA1c, blood pressure, lipid parameters and serum uric acid, and risk of development of chronic kidney disease in type 2 diabetes. Diabetes Obes Metab. 2017, 19(11): 1570-1578. DOI: 10.1111/dom.12976.
Viazzi F, Russo GT, Ceriello A, et al. Natural history and risk factors for diabetic kidney disease in patients with T2D: lessons from the AMD-annals. J Nephrol. 2019, 32(4): 517-525. DOI: 10.1007/s40620-018-00561-3.
Verma S, Ji Q, Bhatt DL, et al. Association between uric acid levels and cardio-renal outcomes and death in patients with type 2 diabetes: a subanalysis of EMPA-REG OUTCOME. Diabetes Obes Metab. 2020, 22(7): 1207-1214. DOI: 10.1111/dom.13991.
Zhang W, Chen L. A nomogram for predicting the possibility of peripheral neuropathy in patients with type 2 diabetes mellitus. Brain Sci. 2022, 12(10): 1328. DOI: 10.3390/brainsci12101328.
Jiang TN, Li YF, Huo LL, et al. Association between serum uric acid and large-nerve fiber dysfunction in type 2 diabetes: a cross-sectional study. Chin Med J (Engl). 2019, 132(9): 1015-1022. DOI: 10.1097/CM9.0000000000000223.
Hoeldtke RD, Bryner KD, McNeill DR, et al. Nitrosative stress, uric acid, and peripheral nerve function in early type 1 diabetes. Diabetes. 2002, 51(9): 2817-2825. DOI: 10.2337/diabetes.51.9.2817.
Zhuang Y, Huang H, Hu X, et al. Serum uric acid and diabetic peripheral neuropathy: a double-edged sword. Acta Neurol Belg. 2023, 123(3): 857-863. DOI: 10.1007/s13760-022-01978-1.
Ghorbani Z, Mirmohammadali SN, Shoaibinobarian N, et al. Insulin resistance surrogate markers and risk of hyperuricemia among patients with and without coronary artery disease: a cross-sectional study. Front Nutr. 2023, 10: 1048675. DOI: 10.3389/fnut.2023.1048675.
Jia L, Xing J, Ding Y, et al. Hyperuricemia causes pancreatic β-cell death and dysfunction through NF-κB signaling pathway. PLoS One. 2013, 8(10): e78284. DOI: 10.1371/journal.pone.0078284.
Richette P, Doherty M, Pascual E, et al. 2018 updated European League Against Rheumatism evidence-based recommendations for the diagnosis of gout. Ann Rheum Dis. 2020, 79(1): 31-38. DOI: 10.1136/annrheumdis-2019-215315.
Robinson PC. Gout - An update of aetiology, genetics, co-morbidities and management. Maturitas. 2018, 118: 67-73. DOI: 10.1016/j.maturitas.2018.10.012.
Vithian K, Hurel S. Microvascular complications: pathophysiology and management. Clin Med (Lond). 2010, 10(5): 505-509. DOI: 10.7861/clinmedicine.10-5-505.
Lawrence Edwards N. The role of hyperuricemia in vascular disorders. Curr Opin Rheumatol. 2009, 21(2): 132-137. DOI: 10.1097/BOR.0b013e3283257b96.
Ryu ES, Kim MJ, Shin HS, et al. Uric acid-induced phenotypic transition of renal tubular cells as a novel mechanism of chronic kidney disease. Am J Physiol Ren Physiol. 2013, 304(5): F471-F480. DOI: 10.1152/ajprenal.00560.2012.
Sánchez-Lozada LG, Soto V, Tapia E, et al. Role of oxidative stress in the renal abnormalities induced by experimental hyperuricemia. Am J Physiol Renal Physiol. 2008, 295(4): F1134-F1141. DOI: 10.1152/ajprenal.00104.2008.
Premkumar LS, Pabbidi RM. Diabetic peripheral neuropathy: role of reactive oxygen and nitrogen species. Cell Biochem Biophys. 2013, 67(2): 373-383. DOI: 10.1007/s12013-013-9609-5.
Rojas DR, Tegeder I, Kuner R, et al. Hypoxia-inducible factor 1α protects peripheral sensory neurons from diabetic peripheral neuropathy by suppressing accumulation of reactive oxygen species. J Mol Med (Berl). 2018, 96(12): 1395-1405. DOI: 10.1007/s00109-018-1707-9.
Kristensen FPB, Sanchez-Lastra MA, Dalene KE, et al. Leisure-time physical activity and risk of microvascular complications in individuals with type 2 diabetes: a UK biobank study. Diabetes Care. 2023, 46(10): 1816-1824. DOI: 10.2337/dc23-0937.