





HIGHLIGHTS
1. Critical Discoveries and Outcomes
• Tangential vitreomacular traction has been implicated in the pathogenesis of myopic traction maculopathy (MTM).
2. Methodological Innovations
• Alterations in the intraocular fluid microenvironment correlate with clinical features in highly myopic eyes, highlighting PRG4 as a potential MTM biomarker.
3. Prospective Applications and Future Directions
• These findings provide initial mechanistic insights into vitreousmacular traction and establish a foundation for future MTM research.
INTRODUCTION
Myopia has emerged as a major global public health challenge, with a particularly high prevalence in East Asia.[1-3] Projections indicate that by 2050, approximately 4.76 billion individuals will be affected by myopia worldwide, including 938 million with high myopia.[4] High myopia frequently progresses to pathological myopia, wherein secondary macular complications can cause irreversible vision loss.[3, 5] Myopia-related visual impairment is expected to increase sevenfold by 2050, cementing its status as a leading cause of permanent visual disability globally.[4]
Under the updated ATN classification, pathological myopia complications are broadly divided into atrophic, tractional, and neovascular subtypes.[6] Myopic traction maculopathy (MTM), a tractional complication, encompasses macular schisis, macular hole, and macular hole-related retinal detachment. Clinically, we have observed that in highly myopic eyes with posterior staphyloma and macular schisis, the schisis often remains stable or spontaneously regress when vitreomacular traction is absent. Conversely, the presence of vitreomacular traction typically progression to macular holes or retinal detachment, frequently culminating in irreversible vision loss. These advanced stages generally necessitate surgical intervention, such as vitrectomy or macular buckling. Based on these observations, we hypothesize that posterior staphyloma initiates MTM, while vitreomacular traction critically determines disease progression and visual prognosis. The clinical pattern aligns with prior reports.[7-9] Both posterior staphyloma and vitreomacular traction contribute to MTM pathogenesis. The formation of posterior staphyloma is well documented as a process of active scleral extracellular matrix (ECM) remodeling, driven by signaling pathways involving transforming growth factor-β (TGF-β) and matrix metalloproteinases (MMPs).[10-13] In contrast, the molecular mechanisms driving vitreomacular traction in MTM remain poorly define. While alterations in the aqueous humor have been implicated in high myopia progression through dysregulated collagen metabolism and intraocular inflammation.[14-18] The biochemical milieu specifically governing vitreous remodeling and tractional forces at the macula has not been fully characterized.
Given its direct anatomical contact with the posterior pole, the vitreous humor closely mirrors the intraocular biochemical microenvironment in chorioretinal diseases and serves as a practical surrogate for inaccessible retinal and choroidal tissues. To address this knowledge gap, we conducted a comprehensive proteomic analysis of vitreous humor (VH) samples from patients with MTM. By correlating VH protein expression profiles with clinical disease parameters, we aimed to delineate the molecular drivers of tractional pathology and identify novel biomarkers and therapeutic targets. Ultimately, these findings may facilitate risk stratification and early intervention to prevent irreversible vision loss in high-risk myopic populations.
METHODS
Participants and samples collection
47 patients were enrolled and assigned to two groups. The MTM group comprised 26 patients (26 eyes) with an axial length (AL) ≥ 26.5 mm and clinical features of foveoschisis, macular hole (MH), or MH‑associated retinal detachment (MH-RD). The control group included 21 patients (21 eyes) with idiopathic macular hole (iMH) or idiopathic epimacular membrane (iERM) and an AL≤ 24.0 mm.
All participants underwent a comprehensive ophthalmic examination, including uncorrected visual acuity and best-corrected visual acuity (BCVA) assessments, intraocular pressure (IOP) measurements, slit lamp examinations, fundus examinations, optical coherence tomography (OCT), and AL measurements (IOLMaster700, Carl Zeiss AG, Germany). Exclusion criteria encompassed: (1) concurrent ocular pathologies such as choroidal neovascularization, proliferative vitreoretinopathy, age-related macular degeneration, retinal vascular occlusion, uveitis, glaucoma, or other ocular diseases; (2) systemic genetic diseases (e.g., Marfan or Stickler syndrome); (3) systemic conditions, including hypertension or diabetes mellitus; (4) prior intraocular surgery, intravitreal injections, or retinal laser treatment.
MTM severity was independently graded by two experienced doctors (MW and HH) using the ATN classification system.[6] Lesions were categorized as T0 (no macular schisis), T1 (inner foveoschisis or outer foveoschisis), T2 (combined inner and outer foveoschisis), T3 (foveal detachment), T4 (full-thickness macular hole), or T5 (macular hole retinal detachment). Discrepancies were resolved by consensus with a senior ophthalmologist (YL). Eyes were classified as having MTM if they exhibited a traction grade ≥ T1.
Undiluted core VH samples (~1.5 ml) were collected by a single senior ophthalmologist (YL) during PPV. Samples were aspirated directly from the vitreous cavity into a sterile 2~mL syringe via the vitrector aspiration line under the condition of air-fluid exchange. All specimens were immediately aliquoted, snap-frozen in liquid nitrogen, and stored at -80oC until analysis.
Analysis of VH samples
10 VH samples (five from each group) were randomly selected for discovery-phase proteomic profiling via ultra-high-performance liquid chromatography–tandem mass spectrometry (UHPLC-MS/MS). Analyses were performed on an EASY-nLC 1000 UPLC system (Thermo Fisher, Germany) coupled to a Q ExactiveTM Plus mass spectrometer (Thermo Fisher, Germany). Samples were centrifuged (12,000 × g, 10 min, 4 °C) to remove cellular debris. Supernatant protein concentration was quantified using a BCA kit (Beyotime, China). Proteins were reduced with dithiothreitol, alkylated with iodoacetamide, and diluted with triethylammonium bicarbonate (TEAB) to reduce urea concentration. Sequential tryptic digestion was performed at enzyme-to-protein ratios of 1:50 and 1:100, respectively. Resulting peptides were desalted, vacuum-dried, reconstituted, and isobarically labeled using a TMT reagent kit. Labeled peptides were fractionated by high-pH reversed-phase HPLC, pooled into 18 fractions, and separated on the EASY-nLC 1000 system at a constant flow rate of 350 nL/min. MS data were acquired in data-dependent acquisition (DDA) mode. Full MS scans were performed at a resolution of 70,000, with the top 20 precursor ions selected for MS/MS fragmentation at 17,500 resolution. Fragmentation employed higher-energy collisional dissociation (HCD) at 31% normalized collision energy (NCE), with a dynamic exclusion window of 30 s. The electrospray ionization voltage was maintained at 2.0 kV.
Raw MS/MS data were processed using Maxquant (v.1.5.2.8) and searched against the SwissProt Human database concatenated with a reverse decoy database. Trypsin/P was specified as the proteolytic enzyme, allowing up to 2 missing cleavages. Precursor mass tolerances were set to 20 ppm for the initial search and 5 ppm for the main search, with a fragment mass tolerance of 0.02 Da. Carbamidomethylation of cysteine was set as a fixed modification, while methionine oxidation and N-terminal acetylation were designated as variable modifications. Peptide-spectrum matches and protein identifications were filtered at a 1% false discovery rate (FDR).
Differential expression was assessed by calculating the fold change (FC) as the ratio of mean reporter ion intensities between groups. Data were log2‑transformed prior to unpaired Student's t-test. Proteins meeting the thresholds of P < 0.05 and FC > 1.2 for upregulation were classified as significantly upregulated, while those with FC < 1/1.2 were downregulated. Functional annotation and subcellular localization were performed using the UniProt- GOA database, COG/KOG classifications, and WoLF PSORT (v.0.2). Protein-protein interaction (PPI) networks were constructed via the STRING database. Gene Ontology (GO) enrichment analysis was conducted using all identified proteins as the background reference, with statistical significance determined by a two-tailed Fisher's exact test (P < 0.05).
The remaining 36 VH samples were divided into two aliquots: one for protein microarray analysis and the other for Enzyme-linked immunosorbent assay (ELISA). Protein levels were initially assessed using a custom glass-based antibody microarray targeting 6 candidate proteins (TGF‑β2, MMP-2, TIMP‑2, PRDX2, CAT, and ANG; RayBiotech, Peachtree Corners, Georgia, USA). Each protein was spotted in quadruplicate. Following the manufacturer's protocol, each well was blocked with blocking buffer and incubated on a shaker at room temperature for 1 h. The buffer was then removed, and 80 μL of either standard solutions or undiluted vitreous humor were added to the respective wells. The array was incubated overnight at 4oC. After thorough washing, biotin-labeled detection antibodies were added and incubated at room temperature for 2 h, followed by additional washes. Cy3-conjugated streptavidin was then applied and incubated for 1 h in the dark. Following a final series of washes, the slides were scanned using an InnoScan 300 laser scanner (Innopsys, France) at a wavelength of 532 nm and a resolution of 10 μm. Raw fluorescence data were processed using Raybiotech software, which included background subtraction and inter‑chip normalization.
Concentrations of DCN and PRG4 were quantified using commercial ELISA kits (Abcam, Cambridge, UK; and R&D Systems, Minneapolis, USA, respectively) according to manufacturer’s protocols. Briefly, samples were added to 96-well plates pre-coated with capture antibodies and incubated for 2.5 h. After washing, enzyme-conjugated detection antibodies were added and incubated for the duration specified in the kit instructions. The plates were washed again, substrate solution was added, and the reaction was allowed to proceed for 20 min. Color development was terminated using the provided stop solution. Absorbance was measured at 450 nm, with reference wavelength correction at 570 nm, using a Synergy™ HTX multimode microplate reader. Standard curves were constructed from serial dilutions of known protein concentrations, and sample concentrations were interpolated accordingly.
Statistical analysis
Statistical analysis was performed using SPSS version 27.0 (IBM Corp., USA). The Shapiro-Wilk test was used to assess the normality of continuous variables. Normally distributed data, including AL, were expressed as mean±SD and compared between groups using the student’s t-test. Non-normal distributed variables (age and protein concentration in VH) were reported as median (interquartile range) and analyzed using the Mann-Whitney U test. Gender distribution was compared using the chi-square test.
Spearman's rank correlation was performed to assess pairwise associations between AL and protein concentration, as well as between MTM grade and protein concentrations. Generalized ordinal logistic regression was subsequently applied to adjust for potential confounders and examine the independent association between MTM grade and protein concentrations.
To account for multiple testing, adjusted P-values were calculated using the Benjamini-Hochberg false discovery rate (FDR) method. FDR correction was applied separately to three analytical sets: between-group comparisons of protein concentrations, correlations between protein concentrations and AL, and correlations between protein concentrations and MTM grade. An FDR-adjusted P-value < 0.05 was considered statistically significant.
RESULTS
Patient characteristics
A total of 47 VH samples were collected in this study. 9 from patients with iERM, 12 from iMH, 5 from high myopia-macular retinoschisis, 4 from foveal detachment, 3 from high myopia-related macular hole, and 14 from high myopia-related macular hole-associated retinal detachment. The demographic and clinical characteristics of patients in the high myopia group (MTM) and the control group are summarized in Table 1. No significant differences were observed in age and sex between the two groups (all P > 0.05). However, the AL was significantly longer in the high myopia group than in the control group (P < 0.001).
|
|
High myopia |
Control |
P-value |
|
Number |
26 |
21 |
|
|
Sex (male/female) |
8/18 |
4/17 |
0.360 |
|
Age, years, median (P25, P75) |
58 (53.00, 66.00) |
62 (58.50, 66.00) |
0.252 |
|
AL, mm (mean ± SD) |
30.34 ± 2.00 |
23.41 ± 0.36 |
<0.001* |
|
MTM category (number) |
T0 (0) |
/ |
|
|
|
T1 (2) |
|
|
|
|
T2 (3) |
|
|
|
|
T3 (4) |
|
|
|
|
T4 (3) |
|
|
|
|
T5 (14) |
|
|
|
AL, axial length; MTM, myopic traction maculopathy. P-values were calculated using the Student’s t-test, Mann-Whitney U test, and chi-square test as appropriate. * Statistically significant. |
|||
Proteomic analysis of VH
Mass spectrometry analysis identified 24,818 valid spectra, 7,799 unique peptides, and 1,157 quantifiable proteins (Figure 1A). A total of 310 differentially expressed proteins (DEPs) were detected between the high myopia and control groups, of which 199 were significantly upregulated and 111 significantly downregulated in the high myopia group (Figure 1C). Subcellular localization analysis indicated that more than half of the DEPs were localized to the extracellular matrix, followed by the cytoplasm and plasma membrane; only 2.26% were assigned to the endoplasmic reticulum (Figure 1B). Based on COG/KOG functional classification, the DEPs were primarily categorized under signal transduction mechanisms, general function prediction, extracellular structure constituents, and posttranslational modification/protein turnover/chaperones (Figure 1D).
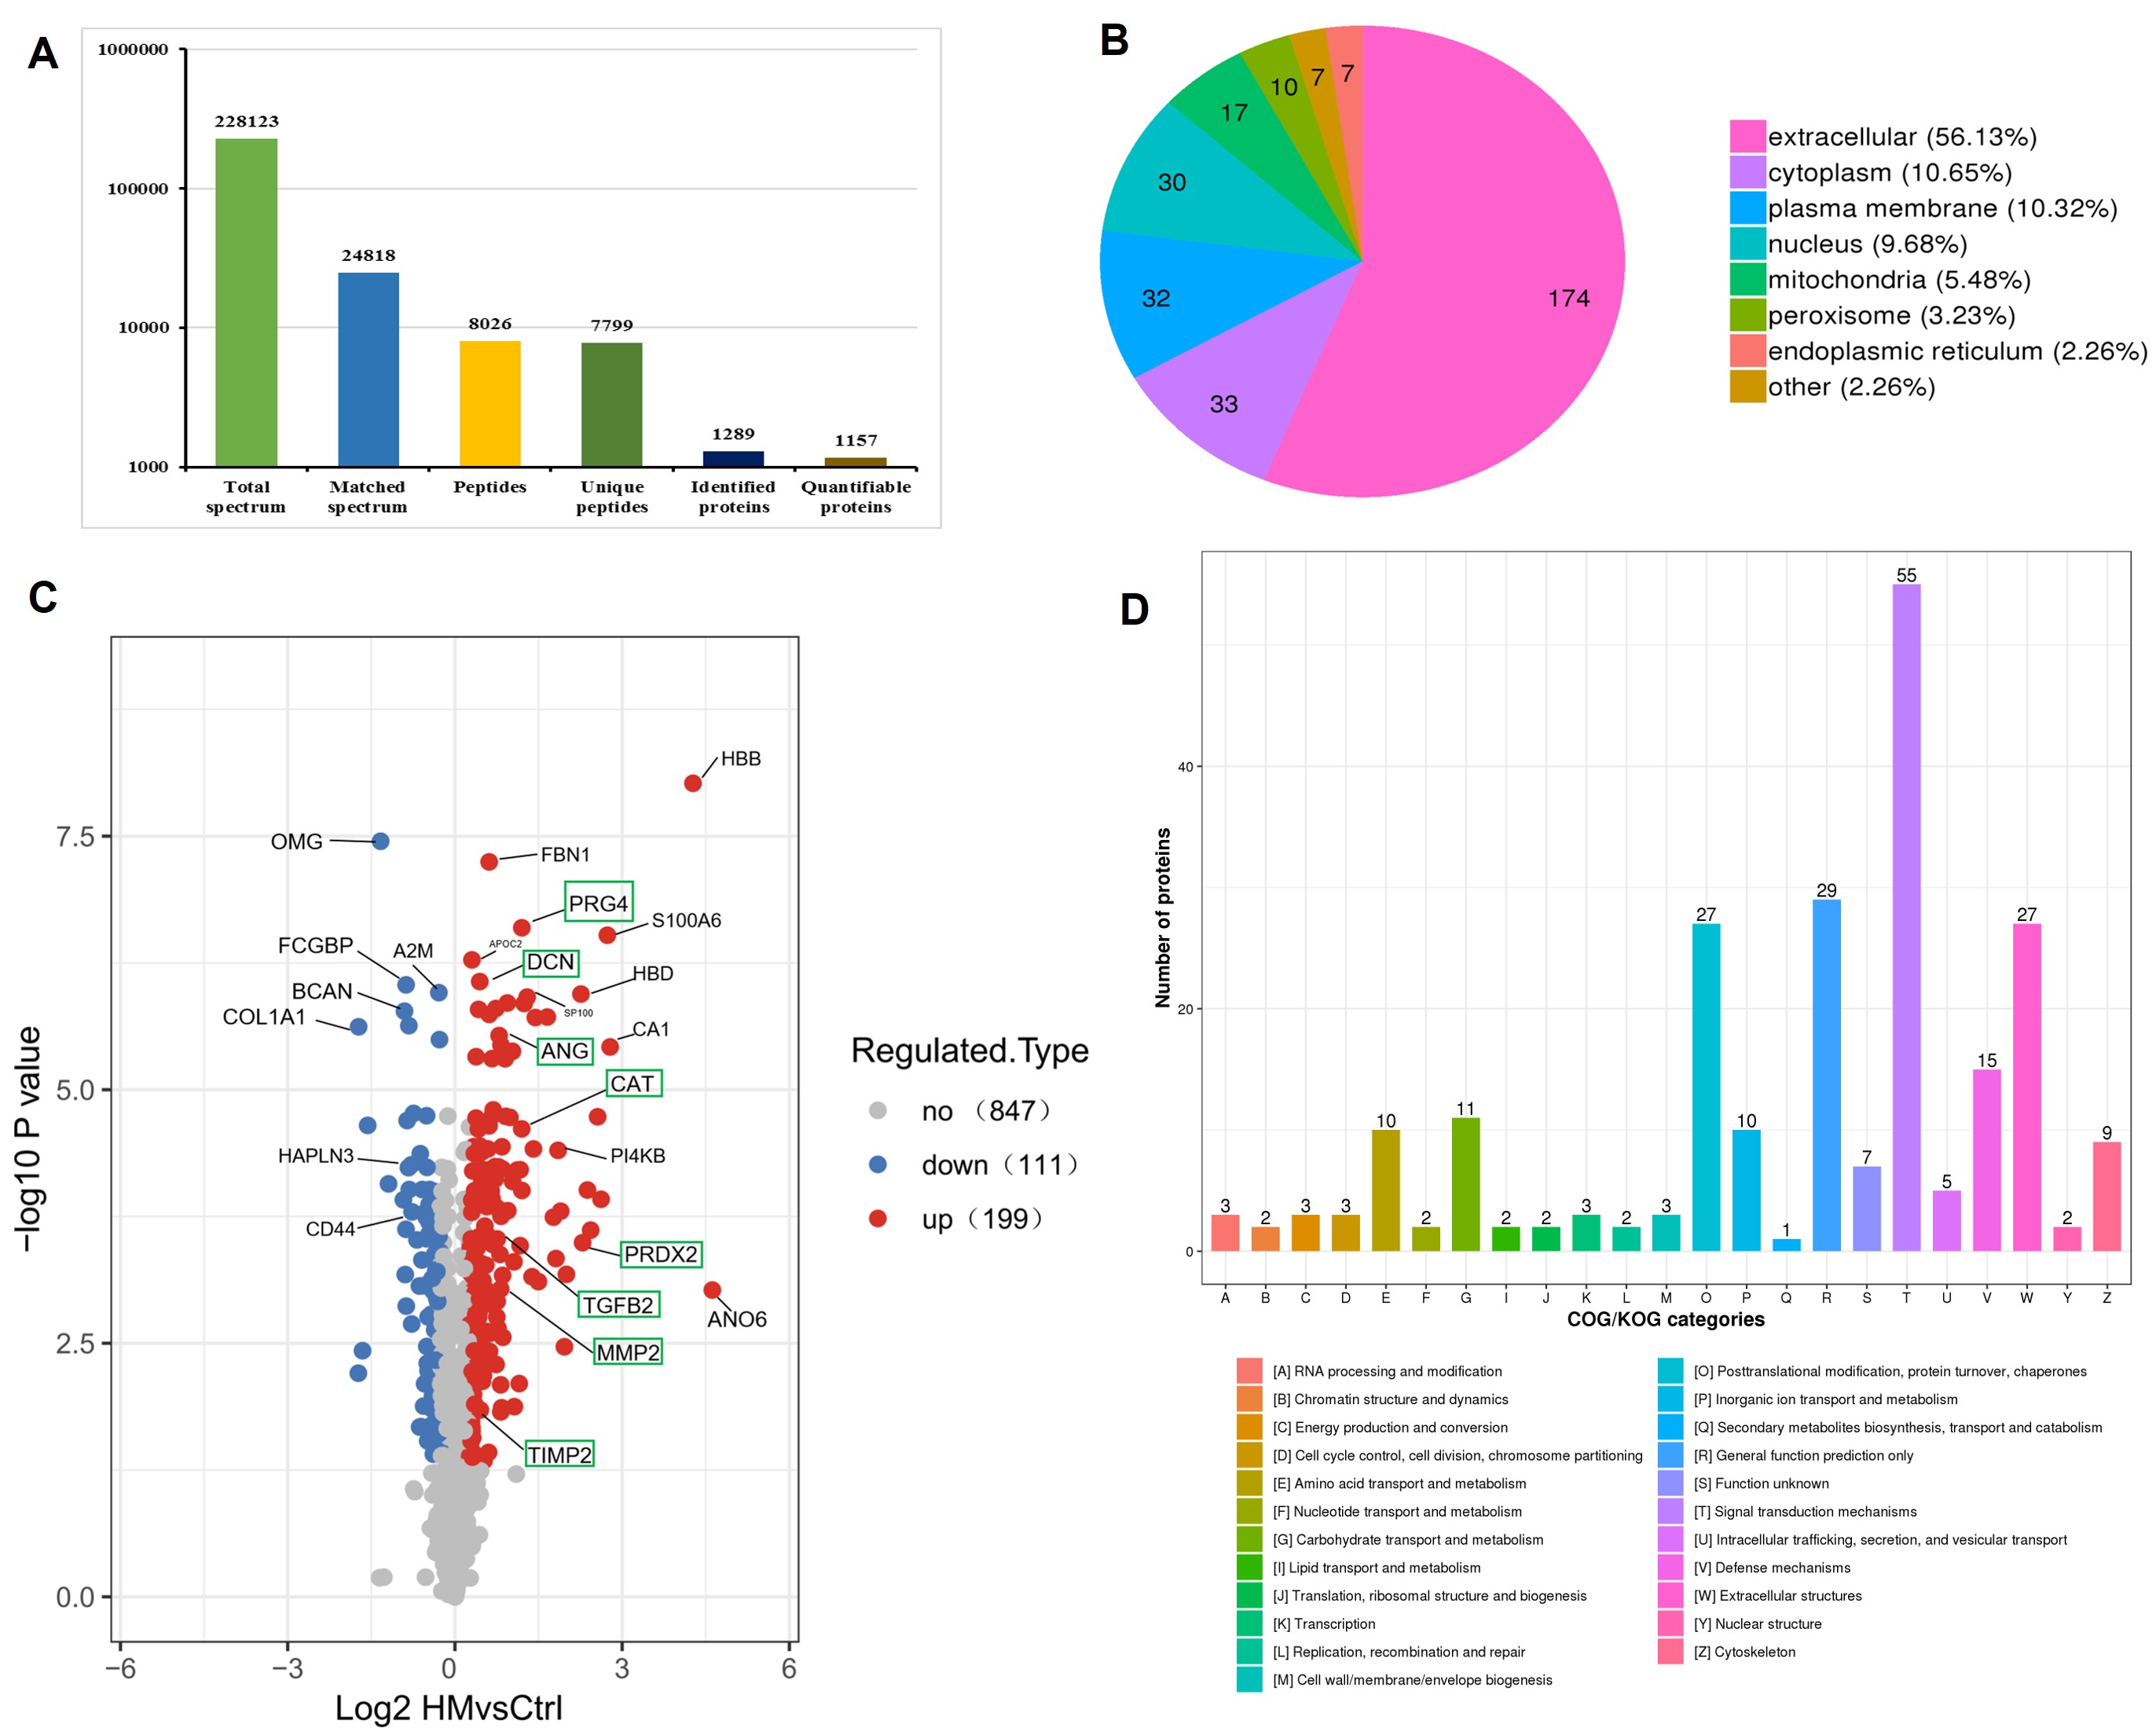
(A) Results of mass spectrometry analysis. (B) Subcellular localization of DEPs between the high myopia group and the control group. (C) Volcano plot of DEPs. (D) COG/KOG classification of DEPs.
Gene Ontology (GO) analysis was performed across the three primary domains: biological process (BP), cellular component (CC), and molecular function (MF). In the BP category, DEPs were significantly enriched in pathways including response to bacterium, intracellular receptor signaling, regulation of tumor necrosis factor production, and cellular response to interleukin-6 (IL-6). For CC, enrichment was primarily observed in the collagen trimer and spherical high-density lipoprotein particles. Regarding MF, the DEPs were predominantly associated with structural molecule activity, protein binding, oxygen binding, and transport, transcription factor activity, and hemoglobin binding (Figure 2A-C).
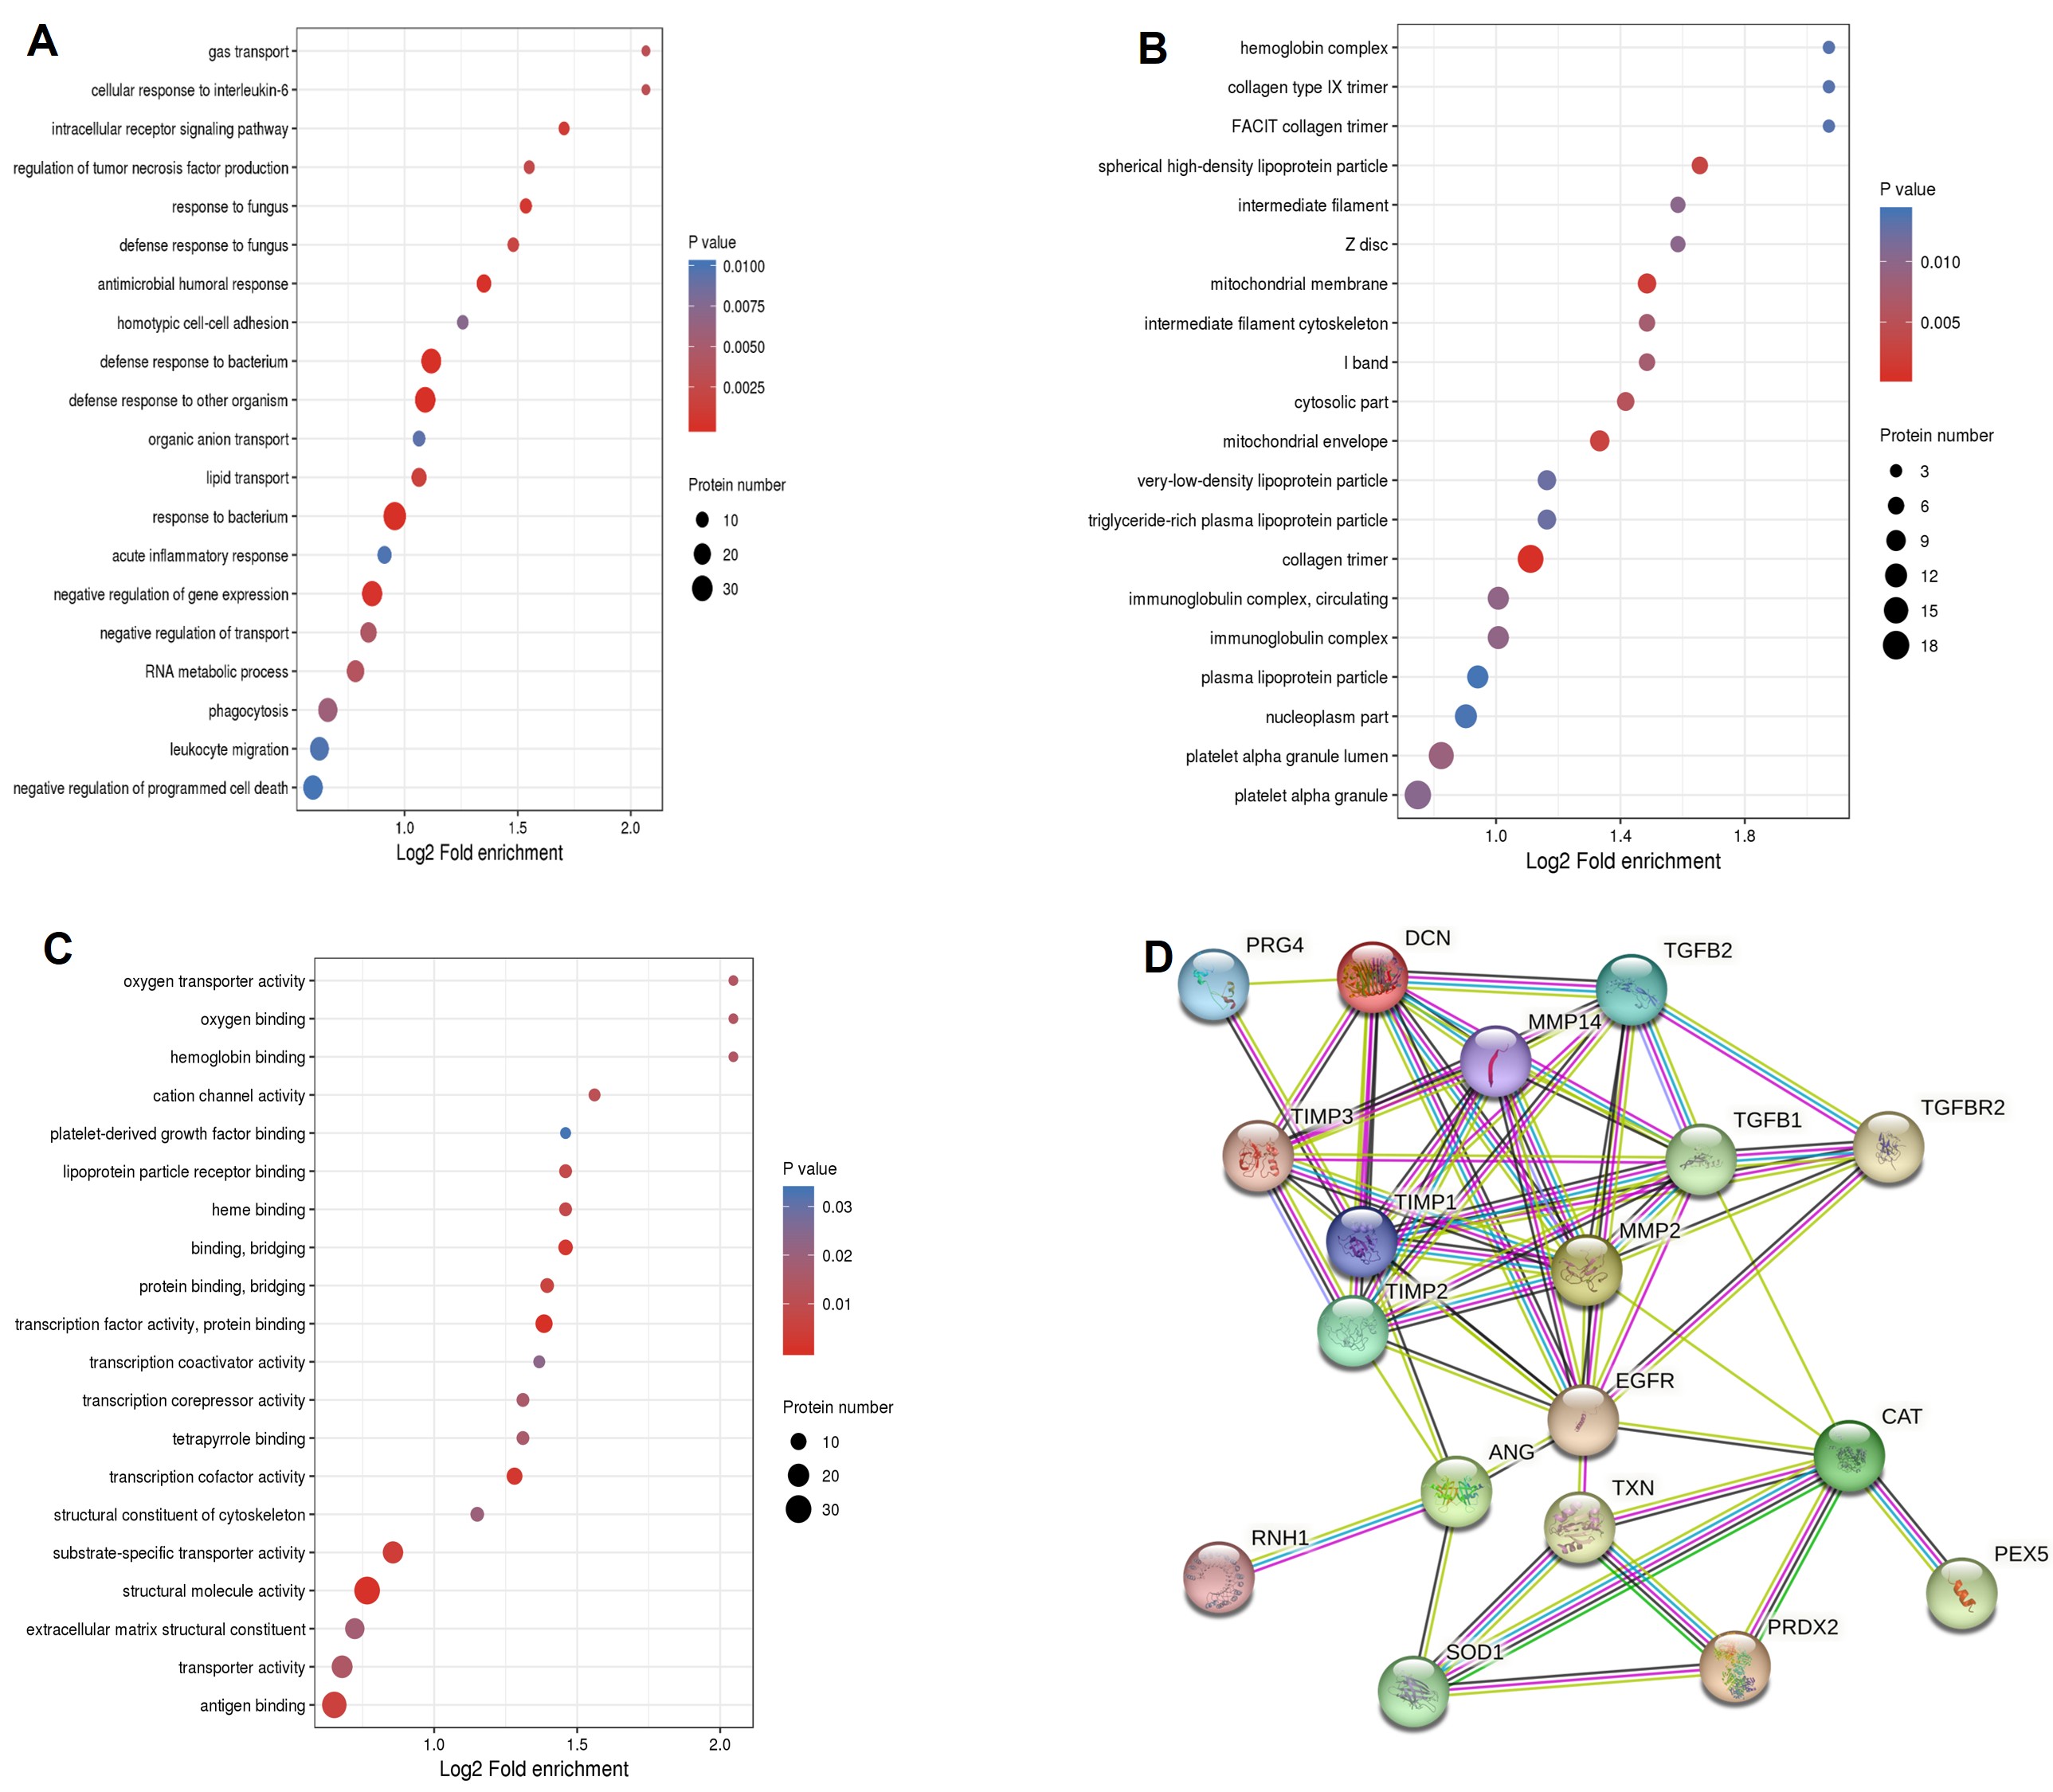
(A) Biological process. (B) Cellular component. (C) Molecular function. (D) PPI network from the STRING database.
Notably, several key DEPs, including decorin (DCN), matrix metalloproteinase-2 (MMP-2), proteoglycan4 (PRG4), transforming growth factor beta-2 (TGF-β2), and metalloproteinase inhibitor-2 (TIMP-2), were significantly upregulated in the high myopia group. These proteins are implicated in extracellular matrix remodeling and cytoskeleton organization, and are closely linked to fibrotic processes. Additionally, oxidative stress-related proteins, including peroxiredoxin-2 (PRDX2), catalase (CAT), and angiogenin (ANG), were also significantly elevated in the high myopia group (Figure 1C). A protein-protein interaction network encompassing these 8 DEPs, constructed using the STRING database, is illustrated in Figure 2D.
Correlation between DEPs and clinical features
Each of the 37 VH samples (21 from the high myopia group and 16 from the controls) was divided into two aliquots. Protein array analysis was performed to quantify levels of fibrosis-related (TGF-β2, MMP-2, TIMP-2) and oxidative stress-related (PRDX2, CAT, ANG) proteins. All six proteins were significantly elevated in VH from MTM patients compared with controls (Figure 3A-F). DCN and PRG4 concentrations were further measured by ELISA. PRG4 levels were significantly higher in the MTM group than in controls (Figure 3G), whereas DCN concentrations did not differ significantly between the two groups (Figure 3H). Full data are summarized in Table 2.
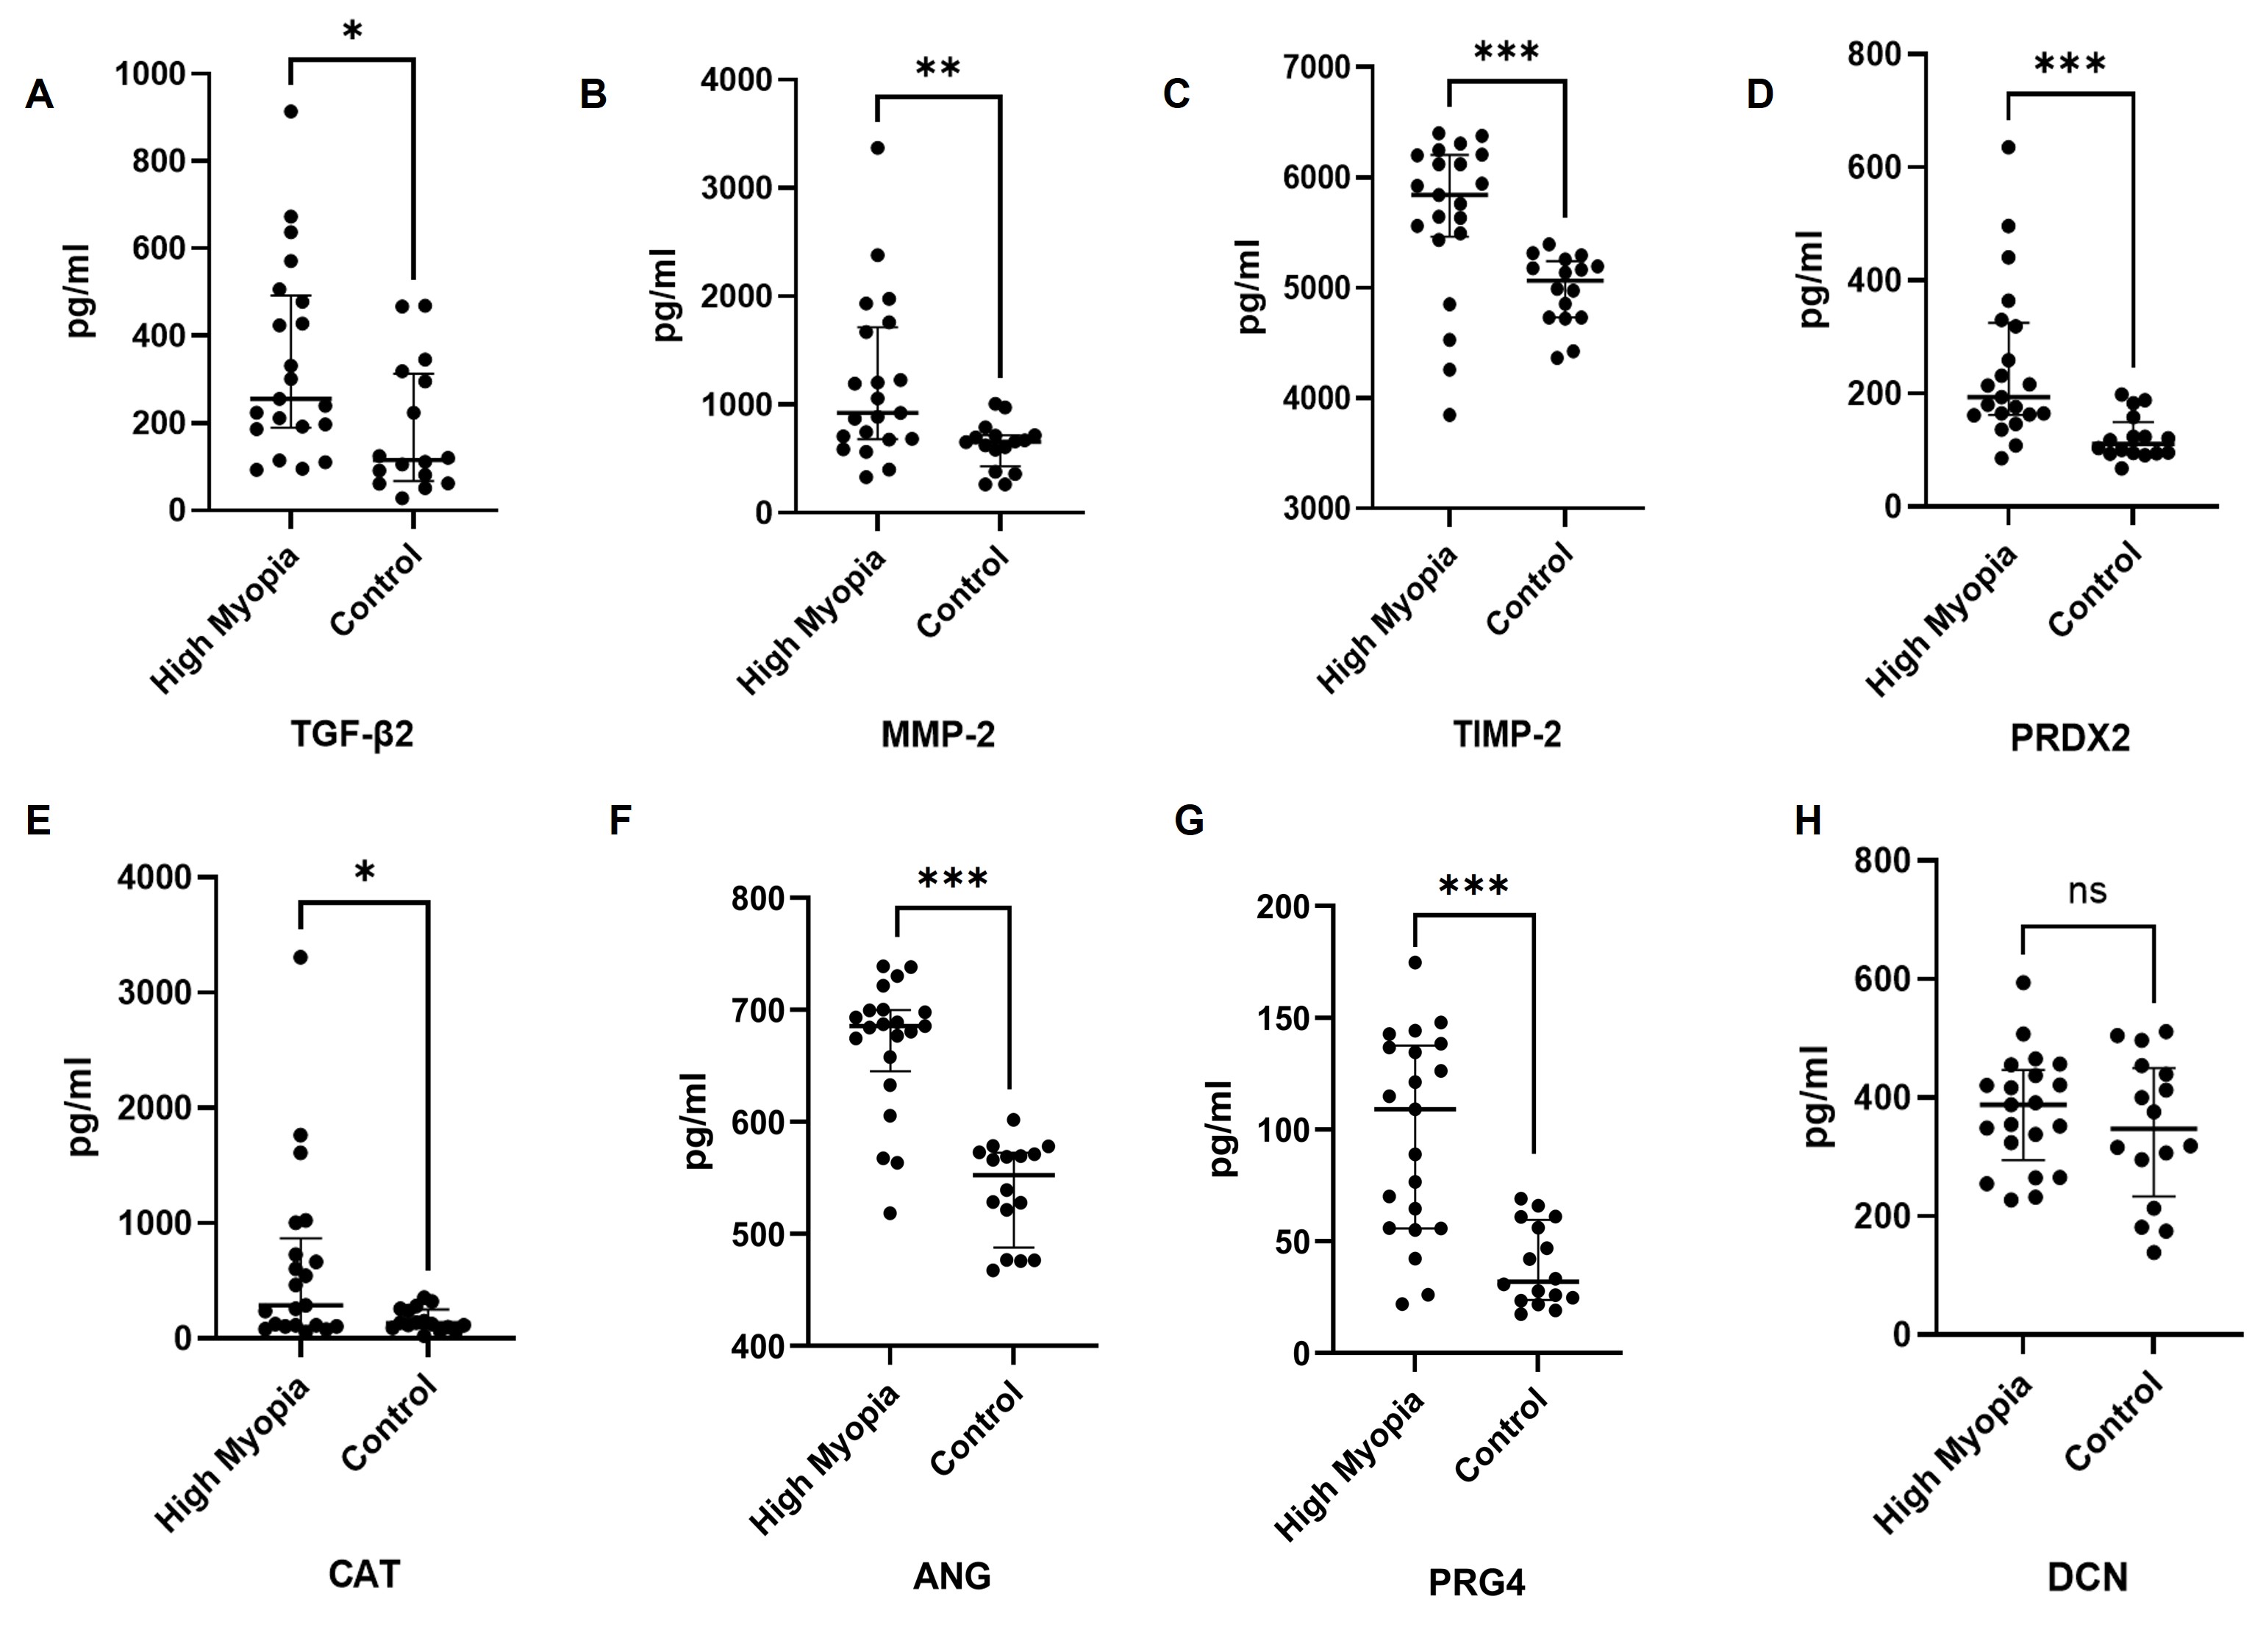
The expression levels of DEPs are presented as median and quartile intervals. P-values were calculated using the Mann-Whitney U test. Adjusted P-values were calculated via Benjamini-Hochberg FDR correction for multiple testing. *P < 0.05, **P<0.01, ***P<0.001.
|
Proteins |
High myopia(n=21) |
Control(n=16) |
Raw P-value |
Adjusted P -value |
|
Median (P25, P75) (pg/ml) |
Median (P25, P75) (pg/ml) |
|||
|
TGF-β2 |
255.71 (189.23, 492.21) |
115.64 (66.73, 312.78) |
0.014* |
0.019* |
|
MMP-2 |
925.91 (681.34, 1716.65) |
657.98 (432.12, 717.39) |
0.004* |
0.006* |
|
TIMP-2 |
5,841.43 (5465.74, 6204.06) |
5,065.12 (4731.96, 5241.47) |
< 0.001* |
<0.001* |
|
PRDX2 |
193.41 (162.49, 324.77) |
110.86 (94.67, 149.96) |
< 0.001* |
<0.001* |
|
CAT |
288.05 (108.96, 866.82) |
131.35 (92.02, 252.40) |
0.040* |
0.046* |
|
ANG |
685.65 (645.30, 699.93) |
552.56 (487.93, 572.43) |
< 0.001* |
<0.001* |
|
PRG4 |
109.12 (55.79, 137.59) |
32.00 (23.80, 59.66) |
< 0.001* |
<0.001* |
|
DCN |
388.29 (294.77, 446.72) |
347.83 (233.84, 450.44) |
0.462 |
0.462 |
|
Raw P-values were calculated using the Mann-Whitney U test. Adjusted P-values were calculated via Benjamini-Hochberg FDR correction for multiple testing. * Statistically significant. |
||||
Correlation analyses were conducted between the concentrations of significantly DEPs and both AL and clinical MTM grade. To evaluate continuous protein trends across the full spectrum of axial elongation, from normal physiology to pathological high myopia, and to minimize grouping-induced stratification bias, all control and experimental samples were pooled for AL-protein correlation analysis. Spearman analysis showed that AL was positively correlated with vitreous concentrations of TGF-β2 (r=0.350, P=0.034), MMP-2 (r=0.356, P=0.034), TIMP-2 (r=0.493, P=0.005), CAT (r=0.445, P=0.008), PRG4 (r=0.616, P=0.003), ANG (r=0.563, P=0.003), and PRDX2 (r=0.461, P=0.007) (Figure 4).
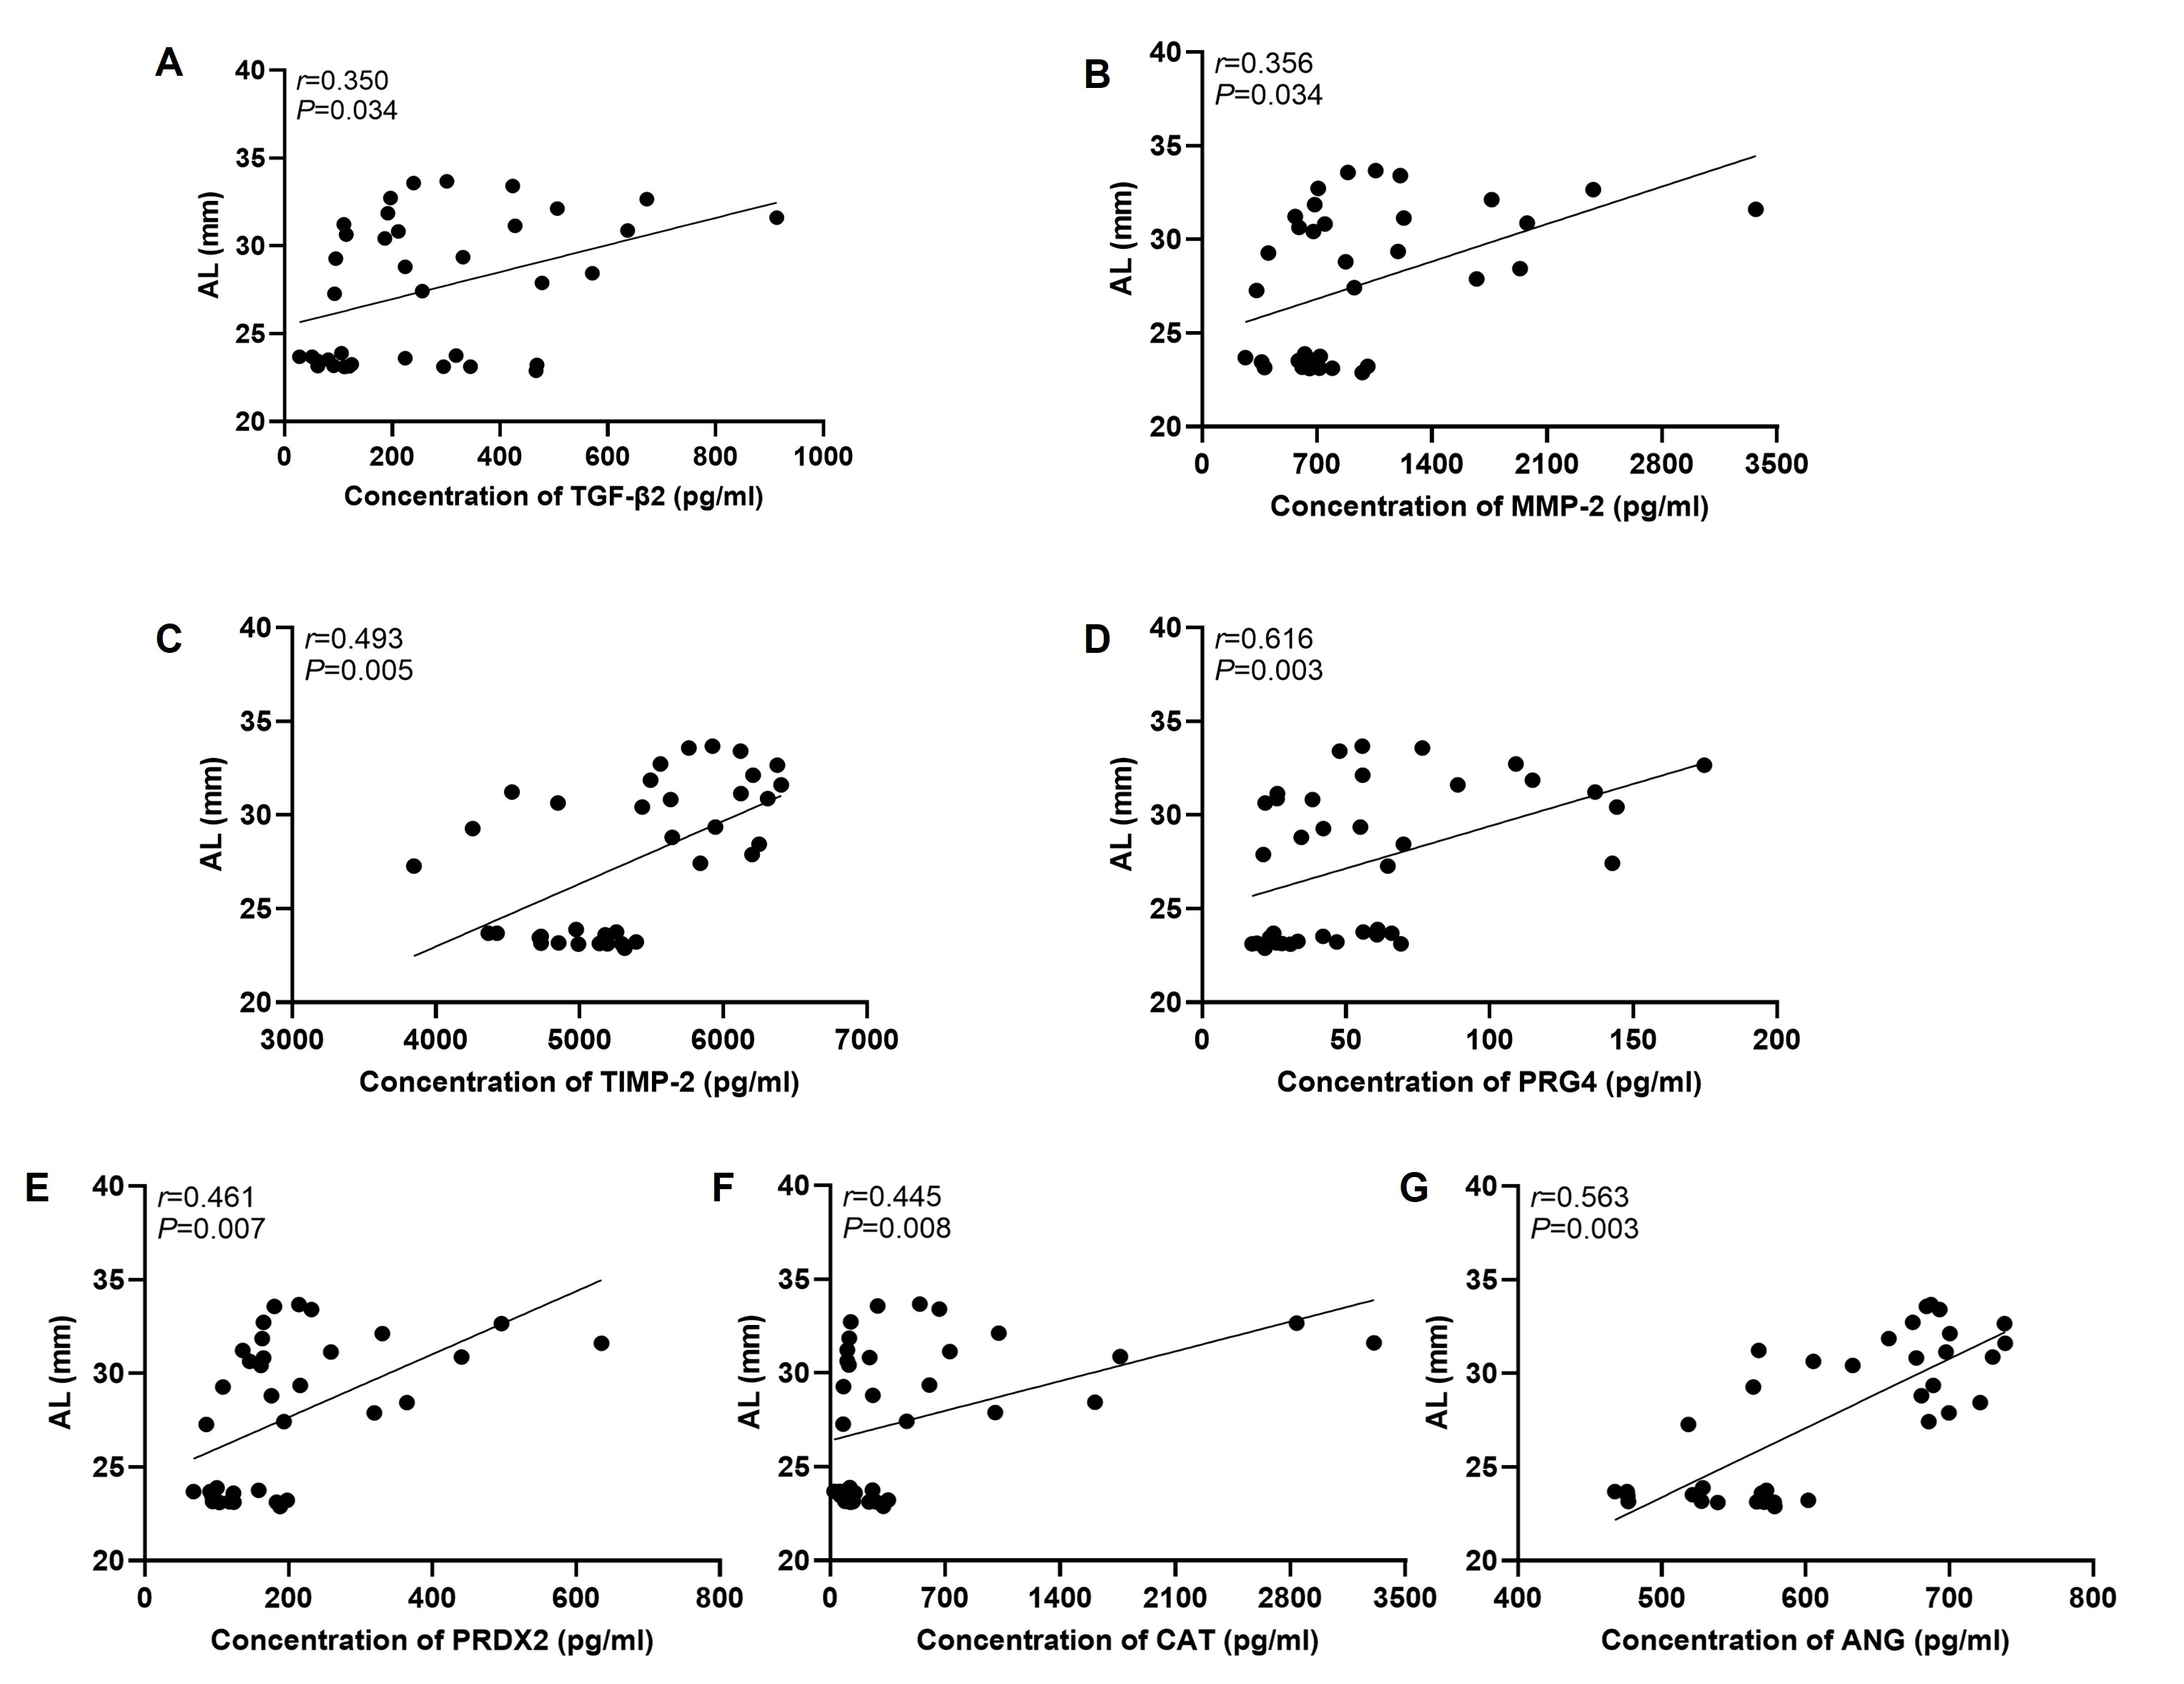
Each dot represents one individual sample. The correlation was analyzed using Spearman rank correlation test. “r” indicates the correlation coefficient, and P < 0.05 was considered statistically significant.
To identify molecular markers associated with MTM severity, we analyzed correlations between vitreous protein concentrations and clinical MTM grade in the high myopia group. Spearman analysis showed a significant positive correlation between PRG4 concentration and MTM grade (r=0.622, P=0.014), whereas PRDX2 revealed a significant negative correlation (r=-0.601, P=0.014). No significant associations were observed for TGF-β2 (r=0.132, P=0.640), MMP-2 (r=0.193, P=0.640), TIMP-2 (r=0.308, P=0.406), CAT (r=-0.127, P=0.640), or ANG (r=0.109, P=0.640). To adjust for potential confounders (age, sex, and AL), a multivariable analysis was subsequently performed. Given the limited sample size, uneven distribution across MTM grades (predominantly T5), and violation of the proportional odds assumption, generalized ordinal logistic regression was applied. Only PRG4 and PRDX2, which reached significance in univariate screening, were entered into the model. After adjustment, PRG4 remained independently associated with higher MTM grade (OR = 1.053, 95% CI: 1.020–1.088, P = 0.001). Conversely, PRDX2 was independently associated with lower disease severity (OR = 0.991, 95% CI: 0.984–0.998, P = 0.016), consistent with a protective role against MTM progression.
Discussion
Currently, preventing and treating pathological myopia remains a significant clinical challenge. Most patients with MTM require surgical intervention, with macular buckling and pars plana vitrectomy being the most commonly used procedures.[19] These two surgical approaches address the core pathogenic drivers of MTM: AL elongation and macular vitreous traction. Macular buckling shortens AL to alleviate traction associated with posterior staphyloma, while vitrectomy releases traction at the vitreoretinal interface to promote retinal reattachment. However, a subset of patients experiences suboptimal visual recovery and persistent symptoms such as metamorphopsia postoperatively.[20] Intraoperatively, we consistently observed unusually firm adhesion between the posterior vitreous cortex and the internal limiting membrane in eyes with pathological myopia. To investigate the molecular mechanisms underlying this abnormal vitreomacular traction, we performed a proteomic analysis of VH samples from MTM patients and conducted the protein profiles with AL and traction severity.
Our results indicate that the DEPs are primarily involved in inflammatory responses, as well as oxygen binding and transport. Moreover, oxidative stress‑related proteins such as PRDX2, CAT, and ANG were upregulated in the MTM group and showed a positive correlation with AL. Given the retina's high metabolic demand and substantial oxygen consumption, it is particularly vulnerable to oxidative stress.[21] Axial enlongation contributes to chronic ocular ischemia and hypoxia, which elevate baseline intraocular oxidative stress and trigger a compensatory upregulation of antioxidant molecules. PRDX2, a key member of the peroxiredoxin family, typically functions as a homodimer to maintain local redox homeostasis.[22] Within inflammatory microenvironments, PRDX2 efficiently scavenges excess reactive oxygen species (ROS) and exert potent antioxidant and anti-inflammatory effects by suppressing NF-κB pathway activation, thereby mitigating oxidative cellular damage.[23] In our cohort, although PRDX2 was consistently upregulated in MTM patients overall, its expression exhibited a negative correlation with disease severity and functioned as an independent protective factor. As vitreomacular traction progress and tissue damage accumulates in advanced MTM, sustained oxidative stress likely depletes local antioxidant reserves. This exhaustion may attenuate the compensatory upregulation of PRDX2, explaining the relatively lower levels observed in higher-grade cases. Collectively, these findings reinforce the hypothesis that oxidative stress plays a critical role in the pathogenesis and progression of MTM.
Most DEPs were localized to extracellular space and were primarily associated with the extracellular matrix, cytoskeletal components, and collagen networks. The upregulation of multiple fibrosis-associated proteins in the MTM group further underscores the role of the vitreous microenvironment in MTM pathogenesis and progression, likely through the modulation of abnormal collagen metabolism. DCN, a small leucine-rich proteoglycan essential for extracellular matrix assembly, comprises a core protein and a single glycosaminoglycan side chain.[24] Its core protein binds to various cytokines and receptors, including TGF-β, PDGF, EGFR and CTGF.[25-26] For instance, DCN exerts antifibrotic effects by sequestering TGF-β2 and preventing its interaction with cell surface receptors.[27] Additionally, the charge density and electrostatic properties of its glycosaminoglycan chains regulate tissue hydration, collagen fibril assembly and spatial organization.[28-29] In our study, DCN showed an upward but statistically non-significant expression trend in MTM patients. This may be attribute to the relatively longer AL and the higher prevalence of concomitant MH or MH-RD in this group. In the presence of retinal breaks, elevated levels of cytokines such as TGF-β and PDGF diffuse into the vitreous cavity and bind extensively to DCN, thereby reducing the pool fo free, functional DCN. Our findings suggest that altered expression of highly hydrophilic proteoglycans like DCN may disrupt local tissue hydration and contribute to the abnormal adhesion between the posterior vitreous cortex and ILM. Larger-scale studies are warranted to validate these observations.
PRG4 is a multi-domain glycoreprotein extensively studied in osteoarthritis for its role in joint lubrication and articular cartilage protection.[30] In ophthalmology, PRG4 downregulation has been documented in conjunctival tissues of patients with severe fibrotic scarring following glaucoma surgery, with expression levels negatively correlated with the number of prior anti‑glaucoma procedures.[31] Furthermore, research in dry eye disease indicates that PRG4 exerts anti‑inflammatory effects on corneal epithelial cells and suppresses chemokines production.[32] Collectively these reports highlight the antifibrotic and anti‑inflammatory potential of PRG4. In our study, PRG4 expression was positively correlated with both AL and MTM severity, and it emerged as an independent predictor of MTM grade after adjusting for potential confounders. Elevated vitreous PRG4 may drive disease progression through two interconnected mechanisms. First, act as a TGF-β antagonist,[33] increased vitreous PRG4 may modulate scleral extracellular matrix remodeling by attenuating TGF-β-mediated fibrosis. While this reduces scleral collagen deposition and fibrotic activation, such biological changes consequently aggravate scleral thinning, progressive axial elongation, and posterior staphyloma formation in MTM eyes. Second, PRG4 interferes with the TGF-β‑hyaluronic acid axis,[34] reducing vitreous hyaluronic acid synthesis and water retention. This promotes collagen bundle condensation, abnormal aggregation and cross-linking, which compromises vitreous structural integrity. Consequently, these changes hinder complete posterior vitreous detachment and intensify pathological vitreoretinal adhesion and traction. Taken together, these results suggest that PRG4 in the vitreous microenvironment plays a critical regulatory role in the pathogenesis and progression of MTM.
This study has several limitations. First, the majority of enrolled MTM cases were classified as stage T5. Eyes at this stage frequently exhibit retinal breaks, which permit vitreous fluid exchange, protein dilution, and cytokine diffusion, potentially confounding vitreous protein quantification. Consequently, our proteomic findings may not fully capture the native vitreous protein profile of MTM. Second, although we collected detailed clinical histories and performed comprehensive ophthalmic examinations to exclude overt hereditary syndromes, formal genetic testing was not conducted. Thus, we cannot entirely rule out, underlying monogenic or syndromic conditions (e.g., MYP1, ARR3, or congenital stationary night blindness), nor can we definitively attribute MTM pathogenesis exclusively to high myopia at the molecular level. Future investigations with larger cohort, stricter phenotypic stratification, and integrated genetic profiling are warranted to minimize confounding from hereditary factors and more rigorously delineate the contribution of vitreous proteomic alterations to MTM pathogenesis.
Conclusion
Our findings indicate that the vitreous microenvironment in MTM drives disease progression through dysregulated collagen metabolism, oxidative stress, and inflammatory signaling. In this context PRG4 emerges as a promising therapeutic target for modulating MTM pathogenesis and may inform future strategies for disease prevention and clinical management.
Correction notice
None
Acknowledgements
None
Authors contribution
(Ⅰ) Conception and design: Meng Wang, Yangfan Yang, Weizhong Lan
(Ⅱ) Administrative support: Yangfan Yang, Weizhong Lan
(Ⅲ) Provision of study materials or patients: Yonghao Li (Ⅳ) Collection and assembly of data: Meng Wang, Yonghao Li
(Ⅴ) Data analysis and interpretation: Meng Wang, Yonghao Li, Haixiang Huang, Jian Deng, Liduo Pan
(Ⅵ) Manuscript writing: All authors
(Ⅶ) Final approval of manuscript: All authors
Conflict of interests
None of the authors has any conflicts of interest to disclose.
Patient consent for publication
None
Ethical Statement
The study was approved by the Ethics Committee of Guangzhou Aier Eye Hospital (GZAIER-2024-IRB-41).
Data Sharing Statement
None
Open access
This is an Open Access article distributed in accordance with the Creative Commons AttributionNonCommercial-NoDerivs 4.0 International License (CC BY-NC-ND 4.0), which permits the non-commercial replication and distribution of the article with the strict proviso that no changes or edits are made and the original work is properly cited (including links to both the formal publication through the relevant DOI and the license).