Retinal neurovascular characteristics for the diagnosis and staging of nondiabetic chronic kidney disease: a diagnostic study
'%20fill='white'%20fill-opacity='0.01'/%3e%3cmask%20id='mask0_3477_29692'%20style='mask-type:luminance'%20maskUnits='userSpaceOnUse'%20x='0'%20y='0'%20width='16'%20height='16'%3e%3crect%20id='&%23232;&%23146;&%23153;&%23231;&%23137;&%23136;_2'%20x='16'%20width='16'%20height='16'%20transform='rotate(90%2016%200)'%20fill='white'/%3e%3c/mask%3e%3cg%20mask='url(%23mask0_3477_29692)'%3e%3cpath%20id='&%23232;&%23183;&%23175;&%23229;&%23190;&%23132;'%20d='M14%205L8%2011L2%205'%20stroke='%23333333'%20stroke-width='1.5'%20stroke-linecap='round'%20stroke-linejoin='round'/%3e%3c/g%3e%3c/g%3e%3c/svg%3e)
关键词
摘要
Methods: Peripapillary retinal nerve fiber layer (pRNFL) thickness and average macular ganglion cell-inner plexiform layer (GC-IPL) thickness of nondiabetic CKD patients and healthy controls (HC) were evaluated by spectral-domain optical coherence tomography (OCT). The vessel density (VD) and perfusion density (PD) of the macula were obtained from optical coherence tomography angiography (OCTA). The estimated glomerular filtration rate (eGFR) was obtained to access the kidney function of CKD patients. Multiple linear regression models were used to adjust for confounding factors in statistical analyzes. The diagnostic capabilities of the parameters were evaluated by logistic regression models.
Results: 131 nondiabetic CKD patients and 62 HC entered the study. eGFR was found significantly associated with parafoveal VD and PD (average PD: β = 0.000 4, Padjusted < 0.001) in various sectors. Thinning of pRNFL (β = -6.725, Padjusted < 0.001) and GC-IPL (β = -4.542, Padjusted < 0.001), as well as decreased VD (β = -2.107, P- adjusted < 0.001) and PD (β = -0.057, Padjusted = 0.032 8) were found in CKD patients. Thinning of pRNFL and deteriorated perifoveal vasculature were found in early CKD, and the parafoveal and foveal VD significantly declined in advanced CKD. Logistic regression models were employed, and selected neurovascular parameters showed an AUC of 0.853 (95% Confidence Interval [CI]: 0.795 to 0.910) in distinguishing CKD patients from HC.
Conclusions: Distinctive retinal neurovascular characteristics could be observed in nondiabetic CKD patients of different severities. Our results suggest that retinal manifestations could be valuable in the screening, diagnosis, and follow-up evaluation of patients with CKD.
全文
HIGHLIGHTS
INTRODUCTION
Chronic kidney disease (CKD) poses significant global healthcare challenges with an increasing incidence.[1-3] It was estimated that the worldwide prevalence of CKD has reached 9.1%, and the disease accounts for 4.6% of total mortality worldwide.[4] Current evidence suggests that vascular dysfunction, as a prominent pathogenetic factor of CKD, could be a shared contributor to disease progression[5] and systemic complications such as cardiovascular diseases,[6] metabolic disorders[7] and neuropathies.[6,8-9] However, the pathological changes of vessels in the kidneys and related target organs could hardly be assessed by non-invasive methods due to their anatomic nature, limiting further scientific studies and clinical applications regarding vascular mechanisms.Several retinal vascular imaging methods have been developed in recent years. Optical coherence tomography angiography (OCTA), developed from optical coherence tomography (OCT), represents a novel, rapid, and non-invasive approach for assessing the microvascular structure of the retina.[15-16] OCTA is used to obtain depth-resolved images of blood flow in the retina and choroid and has been proven to be valuable in screening for various diseases.[17] In a series of recent studies, the application of OCT and OCTA in CKD evaluation and management has been explored.[18-21]
MATERIALS AND METHODS
Participants
Ocular examinations and OCTA
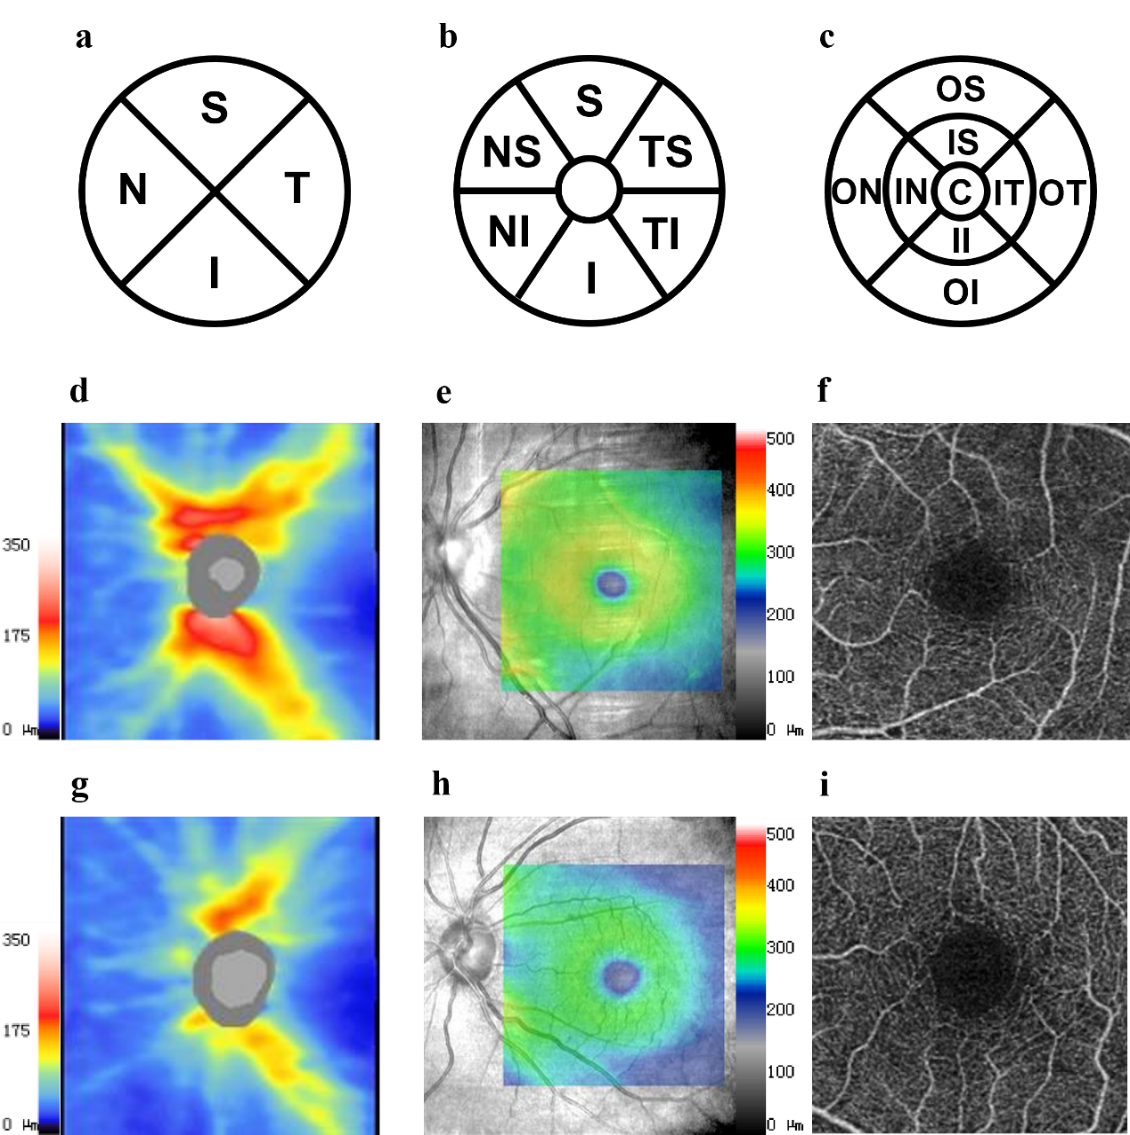
Figure 1 Neurovascular parameters measured using OCT and OCTA
Statistical analysis
RESULTS
Demographic Data
Table 1 Demographic data of the CKD group and the healthy control group
|
Demographic data |
Healthy Control |
Early CKD |
Advanced CKD |
P value |
|
Patients (n) |
62 |
48 |
83 |
|
|
Age (year) |
40.50 (25.25) |
37.87 (19.80) |
48.00 (20.00) |
0.004 |
|
Male (%) |
27 (43.5) |
20 (41.7) |
49 (59.0) |
0.079 |
|
Serum Creatinine (µmol/L) |
- |
78.840 (24.229) |
893.435 (353.338) |
<0.001 |
|
eGFR (ml/min/1.73 m2 ) |
- |
95.833 (19.407) |
12.035 (13.925) |
<0.001 |
|
Smoking (%) |
- |
1 (2.08) |
11 (13.25) |
0.132 |
|
Hypertension (%) |
- |
6 (12.50) |
31 (37.35) |
0.152 |
|
Cardiovascular Diseases (%) |
- |
1 (2.08) |
5 (6.02) |
0.299 |
Age was represented as median (IQR) and was analyzed using the Kruskal−Wallis test.Sex, smoking status, hypertension and cardiovascular diseases were represented as number (percentage) and analyzed by Pearson's chi-square test. BUN, serum creatinine, and eGFR were compared with the Mann−Whitney U test and are represented as the median (IQR). The bold values indicate statistically significant P values (P <0.05). CKD, chronic kidney disease; eGFR, estimated glomerular filtration rate; SD, standard deviation; IQR, interquartile range.
Table S1 Causes of CKD
|
Kidney Disease Diagnosis |
n(%) |
|
Glomerular Diseases |
112 (85.5%) |
|
Immunoglobulin A Nephropathy (IgAN) |
21 (16.0%) |
|
Membranous Nephropathy |
8 (6.1%) |
|
Minimal Change Disease |
5 (3.8%) |
|
Focal Segmental Glomerulosclerosis (FSGS) |
3 (2.3%) |
|
Infection-related Glomerulonephritis |
2 (1.5%) |
|
Membranoproliferative Glomerulonephritis |
2 (1.5%) |
|
Lupus Nephritis |
3 (2.3%) |
|
Unknown |
68 (51.9%) |
|
Obstructive Causes |
9 (6.9%) |
|
Unknown Causes |
10 (7.6%) |
The number of patients diagnosed with each disease is presented as n.
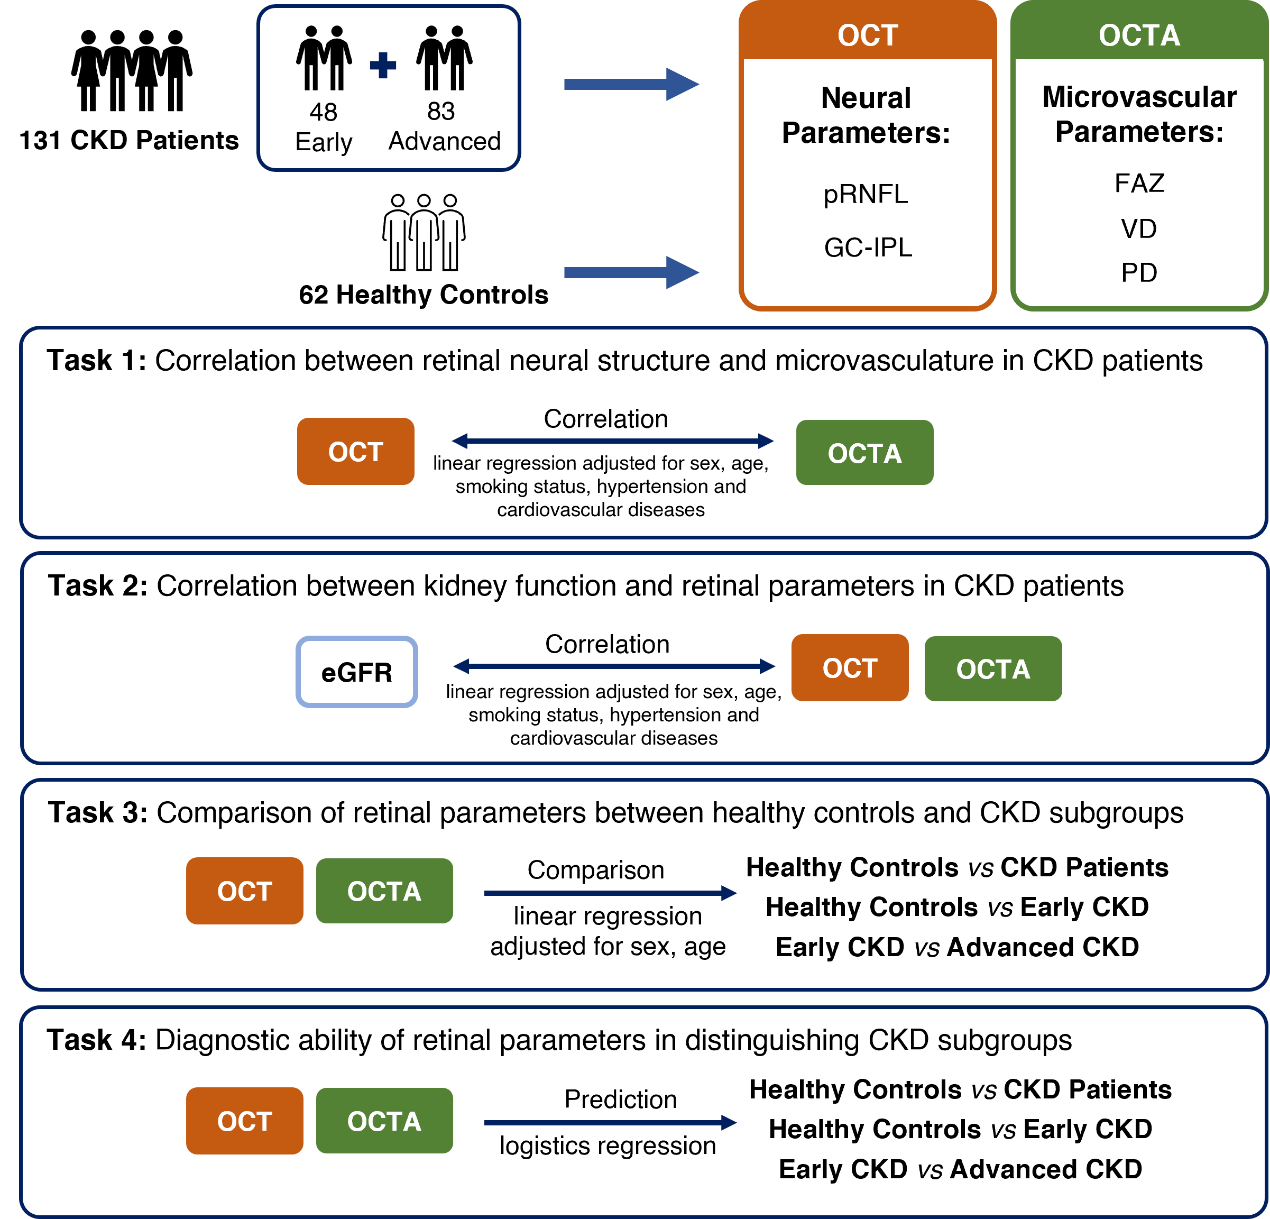
Figure 2 Overview of study participants, retinal parameters and primary outcomes
Retinal neural structure and microvasculature were correlated in CKD patients
Table S2 Correlation between average OCT and OCTA parameters in CKD patients
|
Quadrants |
β† (95% CI) |
Padjusted† |
β‡ (95% CI) |
Padjusted‡ |
|
pRNFL (μm) |
|
|
|
|
|
Average |
0.0508 (0.0179, 0.0837) |
0.033 |
0.0013 (0.0004, 0.0021) |
0.042 |
|
Superior |
0.0213 (0.0011, 0.0416) |
0.464 |
0.0006 (3.78E-05, 0.0011) |
0.429 |
|
Temporal |
0.0352 (0.004, 0.0664) |
0.331 |
0.0009 (4.63E-05, 0.0017) |
0.461 |
|
Inferior |
0.0327 (0.0127, 0.0526) |
0.019 |
0.0008 (0.0003, 0.0013) |
0.025 |
|
Nasal |
0.0271 (-0.0112, 0.0654) |
1.967 |
0.0007 (-0.0003, 0.0016) |
2.320 |
|
GC-IPL (μm) |
|
|
|
|
|
Average |
0.0902 (0.0499, 0.1305) |
< 0.001 |
0.0024 (0.0014, 0.0034) |
< 0.001 |
|
Superior |
0.0600 (0.0234, 0.0965) |
0.018 |
0.0016 (0.0007, 0.0026) |
0.010 |
|
Superior Temporal |
0.0719 (0.0329, 0.1108) |
0.005 |
0.0019 (0.0009, 0.0029) |
0.002 |
|
Inferior temporal |
0.0963 (0.0581, 0.1345) |
< 0.001 |
0.0025 (0.0016, 0.0035) |
< 0.001 |
|
Inferior |
0.0690 (0.0347, 0.1032) |
0.001 |
0.0019 (0.001, 0.0027) |
0.001 |
|
Inferior nasal |
0.0734 (0.0386, 0.1082) |
0.001 |
0.0020 (0.0011, 0.0028) |
< 0.001 |
|
Superior nasal |
0.0631 (0.0267, 0.0994) |
0.010 |
0.0017 (0.0008, 0.0026) |
0.006 |
†Multiple linear regression with average VD.‡Multiple linear regression with average PD.A linear regression model was applied in all subjects. Sex, age, smoking status, hypertension and cardiovascular diseases were covariates entered into the model. The bold values indicate statistically significant after Bonferroni correction.
Retinal neurovascular parameters reflected kidney function deterioration
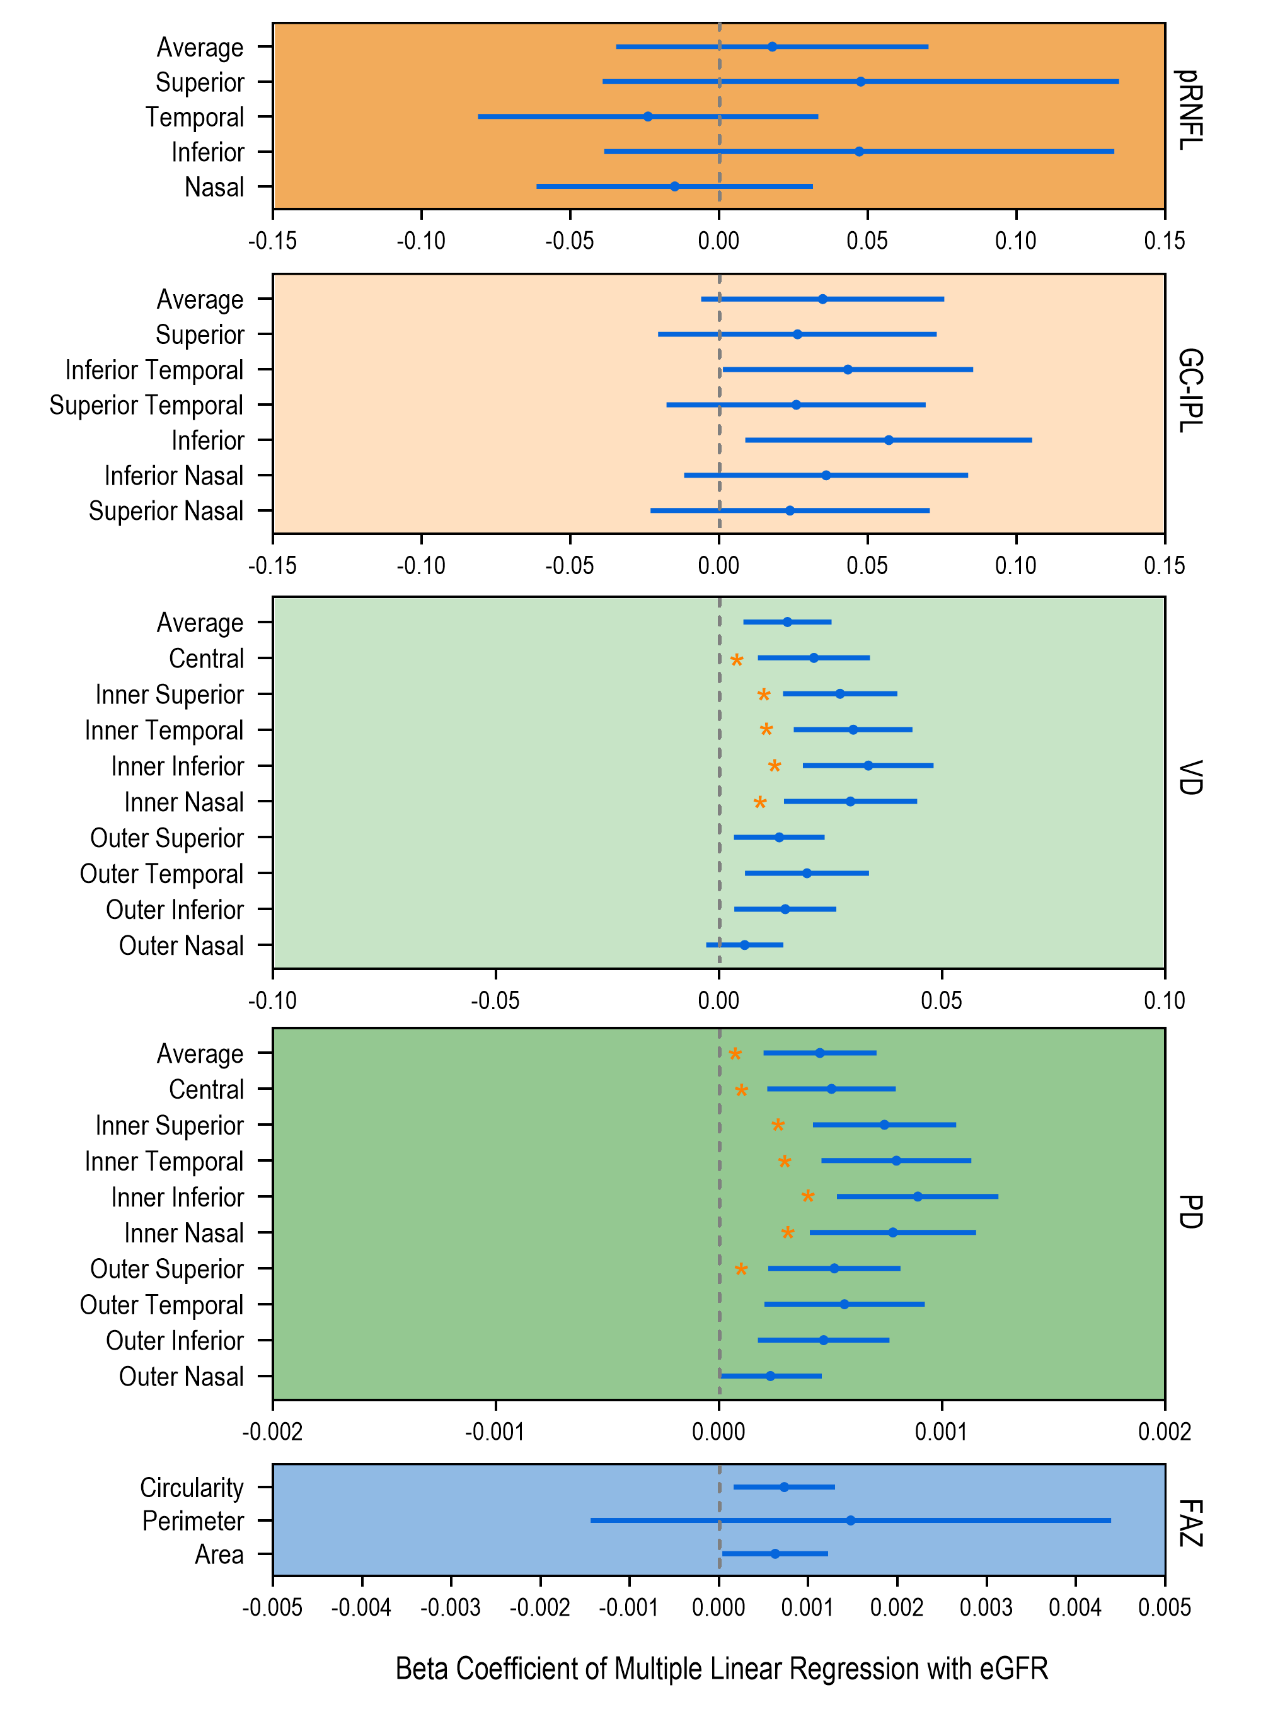
Figure 3 Correlation between eGFR and retinal neurovascular parameters in CKD patients
Structural and angiographic parameters significantly decreased in CKD patients
Table 2 Retinal neuralparameters compared between the healthy controls and the different CKD groups
|
Quadrants |
Healthy Control (n=62) |
CKD Group (n=131) |
Early CKD |
Advanced CKD (n=83) |
β† (95% CI) |
β‡ (95% CI) |
β§ (95% CI) |
|
pRNFL (μm) |
|
|
|
|
|
|
|
|
Average |
101.629 ± 8.950 |
94.413 ± 10.450 |
96.396 ± 9.385 |
93.307 ± 10.522 |
-6.725 (-9.782, -3.667) |
-5.238 (-8.754, -1.722) |
-2.226 (-6.117, 1.666) |
|
Superior |
127.758 ± 16.015 |
122.953 ± 17.605 |
126.438 ± 16.523 |
120.678 ± 17.521 |
-3.689 (-8.891, 1.513) |
-1.369 (-7.549, 4.811) |
-3.621 (-10.075, 2.833) |
|
Temporal |
76.774 ± 11.274 |
68.151 ± 11.205 |
68.417 ± 11.605 |
68.635 ± 11.208 |
-8.144 (-11.593, -4.694) |
-8.371 (-12.741, -4.002) |
0.561 (-3.706, 4.828) |
|
Inferior |
130.145 ± 17.615 |
122.142 ± 17.008 |
126.500 ± 13.781 |
119.682 ± 17.558 |
-7.545 (-12.837, -2.253) |
-3.611 (-9.768, 2.546) |
-6.336 (-12.647, -0.025) |
|
Nasal |
72.177 ± 12.599 |
64.024 ± 9.079 |
63.625 ± 10.332 |
64.023 ± 8.089 |
-8.188 (-11.378, -4.997) |
-8.552 (-13.037, -4.068) |
1.047 (-2.407, 4.501) |
|
GC-IPL (μm) |
|
|
|
|
|
|
|
|
Average |
85.226 ± 5.308 |
80.312 ± 8.184 |
83.340 ± 5.490 |
78.347 ± 8.980 |
-4.542 (-6.805, -2.278) |
-1.855 (-3.893, 0.183) |
-4.028 (-7.017, -1.039) |
|
Superior |
85.919 ± 5.795 |
81.219 ± 9.360 |
84.123 ± 5.903 |
78.877 ± 11.381 |
-4.224 (-6.786, -1.662) |
-1.789 (-4.032, 0.453) |
-3.539 (-6.986, -0.092) |
|
Temporal superior |
83.419 ± 5.290 |
78.925 ± 8.647 |
81.349 ± 5.754 |
77.057 ± 10.244 |
-4.127 (-6.489, -1.765) |
-2.031 (-4.083, 0.020) |
-3.089 (-6.301, 0.124) |
|
Temporal inferior |
84.613 ± 5.475 |
79.876 ± 8.475 |
83.103 ± 5.617 |
77.867 ± 9.101 |
-4.454 (-6.800, -2.108) |
-1.447 (-3.473, 0.580) |
-4.461 (-7.543, -1.378) |
|
Inferior |
83.371 ± 5.611 |
77.322 ± 9.628 |
80.995 ± 5.742 |
75.589 ± 10.961 |
-5.847 (-8.49, -3.205) |
-2.360 (-4.532, -0.188) |
-5.614 (-9.142, -2.086) |
|
Nasal inferior |
86.29 ± 5.579 |
81.082 ± 9.583 |
84.297 ± 5.954 |
79.291 ± 10.584 |
-4.720 (-7.320, -2.120) |
-1.964 (-4.134, 0.205) |
-4.13 (-7.639, -0.62) |
|
Nasal superior |
87.871 ± 5.841 |
83.402 ± 9.391 |
86.275 ± 6.127 |
81.267 ± 10.615 |
-4.006 (-6.580, -1.432) |
-1.565 (-3.829, 0.700) |
-3.513 (-6.964, -0.062) |
Table 3 Retinal microvascularparameters compared between the healthy controls and the different CKD groups
|
Quadrants
|
Healthy Control (n=62) |
CKD Group (n=131) |
Early CKD |
Advanced CKD (n=83) |
β† (95% CI) |
β‡ (95% CI) |
β§ (95% CI) |
|
Vessel density (mm-1) |
|||||||
|
Average |
18.308 ± 0.840 |
16.007 ± 2.149 |
17.094 ± 1.262 |
15.285 ± 2.347 |
-2.107 (-2.648, -1.566) |
-1.217 (-1.606, -0.828) |
-1.670 (-2.600, -0.741) |
|
Central |
8.795 ± 2.415 |
6.036 ± 2.566 |
7.102 ± 2.251 |
5.351 ± 2.605 |
-2.659 (-3.433, -1.884) |
-1.689 (-2.574, -0.804) |
-1.422 (-2.141, -0.703) |
|
Inner superior |
18.423 ± 1.032 |
15.903 ± 2.802 |
17.542 ± 1.415 |
14.774 ± 3.066 |
-2.346 (-3.065, -1.627) |
-0.878 (-1.341, -0.414) |
-2.339 (-3.271, -1.408) |
|
Inner temporal |
18.253 ± 1.319 |
15.612 ± 2.884 |
17.325 ± 1.290 |
14.542 ± 3.084 |
-2.502 (-3.261, -1.743) |
-0.928 (-1.427, -0.430) |
-2.666 (-3.622, -1.709) |
|
Inner inferior |
18.248 ± 1.174 |
15.433 ± 3.185 |
17.250 ± 1.759 |
14.307 ± 3.361 |
-2.672 (-3.497, -1.847) |
-0.999 (-1.555, -0.442) |
-2.819 (-3.883, -1.755) |
|
Inner nasal |
18.226 ± 1.417 |
15.554 ± 3.160 |
17.277 ± 1.763 |
14.505 ± 3.352 |
-2.484 (-3.311, -1.657) |
-0.950 (-1.553, -0.347) |
-2.514 (-3.605, -1.424) |
|
Outer superior |
18.745 ± 0.738 |
16.483 ± 2.251 |
17.585 ± 1.166 |
15.733 ± 2.572 |
-2.012 (-2.558, -1.466) |
-1.166 (-1.515, -0.816) |
-1.280 (-2.024, -0.536) |
|
Outer temporal |
17.527 ± 1.492 |
14.971 ± 2.951 |
16.277 ± 1.847 |
14.182 ± 3.140 |
-2.329 (-3.101, -1.557) |
-1.251 (-1.869, -0.633) |
-1.742 (-2.763, -0.721) |
|
Outer inferior |
18.479 ± 1.030 |
16.173 ± 2.457 |
17.185 ± 1.571 |
15.534 ± 2.649 |
-2.107 (-2.735, -1.480) |
-1.297 (-1.776, -0.817) |
-1.314 (-2.155, -0.473) |
|
Outer nasal |
19.915 ± 0.743 |
18.563 ± 1.823 |
19.165 ± 1.202 |
18.092 ± 2.118 |
-1.163 (-1.615, -0.711) |
-0.754 (-1.107, -0.400) |
-0.611 (-1.251, 0.029) |
|
Perfusion density (unitless) |
|||||||
|
Average |
0.448 ± 0.021 |
0.386 ± 0.056 |
0.417 ± 0.032 |
0.367 ± 0.060 |
-0.057 (-0.071, -0.043) |
-0.031 (-0.041, -0.021) |
-0.039 (-0.060, -0.018) |
|
Central |
0.197 ± 0.056 |
0.131 ± 0.059 |
0.156 ± 0.052 |
0.116 ± 0.060 |
-0.063 (-0.081, -0.045) |
-0.041 (-0.061, -0.020) |
-0.041 (-0.059, -0.022) |
|
Inner superior |
0.441 ± 0.028 |
0.376 ± 0.071 |
0.419 ± 0.037 |
0.346 ± 0.076 |
-0.061 (-0.080, -0.043) |
-0.022 (-0.034, -0.010) |
-0.064 (-0.087, -0.041) |
|
Inner temporal |
0.430 ± 0.034 |
0.366 ± 0.073 |
0.410 ± 0.033 |
0.338 ± 0.078 |
-0.061 (-0.080, -0.042) |
-0.020 (-0.033, -0.007) |
-0.070 (-0.094, -0.046) |
|
Inner inferior |
0.434 ± 0.031 |
0.363 ± 0.080 |
0.411 ± 0.046 |
0.334 ± 0.083 |
-0.067 (-0.088, -0.047) |
-0.024 (-0.038, -0.009) |
-0.074 (-0.100, -0.048) |
|
Inner nasal |
0.428 ± 0.036 |
0.363 ± 0.079 |
0.406 ± 0.043 |
0.336 ± 0.084 |
-0.061 (-0.082, -0.041) |
-0.022 (-0.037, -0.007) |
-0.065 (-0.092, -0.037) |
|
Outer superior |
0.467 ± 0.020 |
0.407 ± 0.065 |
0.442 ± 0.049 |
0.384 ± 0.068 |
-0.054 (-0.070, -0.038) |
-0.025 (-0.038, -0.012) |
-0.046 (-0.067, -0.024) |
|
Outer temporal |
0.431 ± 0.040 |
0.362 ± 0.076 |
0.397 ± 0.051 |
0.340 ± 0.080 |
-0.064 (-0.084, -0.043) |
-0.034 (-0.051, -0.017) |
-0.048 (-0.074, -0.021) |
|
Outer inferior |
0.462 ± 0.027 |
0.395 ± 0.064 |
0.425 ± 0.042 |
0.377 ± 0.067 |
-0.062 (-0.078, -0.046) |
-0.037 (-0.050, -0.024) |
-0.041 (-0.063, -0.020) |
|
Outer nasal |
0.486 ± 0.019 |
0.449 ± 0.049 |
0.467 ± 0.030 |
0.436 ± 0.057 |
-0.032 (-0.044, -0.020) |
-0.019 (-0.028, -0.010) |
-0.020 (-0.037, -0.003) |
|
Foveal avascular zone |
|
|
|
|
|
|
|
|
Area (mm2) |
0.297 ± 0.103 |
0.265 ± 0.125 |
0.305 ± 0.116 |
0.245 ± 0.124 |
-0.028 (-0.063, 0.008) |
0.007 (-0.034, 0.049) |
-0.055 (-0.099, -0.011) |
|
Perimeter (mm) |
2.209 ± 0.438 |
2.183 ± 0.594 |
2.292 ± 0.483 |
2.120 ± 0.644 |
-0.007 (-0.174, 0.159) |
0.081 (-0.092, 0.254) |
-0.13 (-0.346, 0.087) |
|
Circularity |
0.750 ± 0.075 |
0.668 ± 0.114 |
0.709 ± 0.942 |
0.644 ± 0.118 |
-0.078 (-0.110, -0.047) |
-0.041 (-0.073, -0.008) |
-0.065 (-0.106, -0.023) |
† Comparison between HC and all CKD. ‡ Comparison between HC and early CKD. §comparison between early and advanced CKD.
The retinal vascular parameters were represented as mean ± SD. A linear regression model was applied to adjust for age and sex, and smoking status, hypertension, and cardiovascular diseases were also adjusted when comparing early and advanced CKD.The bold values indicate statistically significant after Bonferroni correction(P-adjusted< 0.05). CKD, chronic kidney disease; HC, healthy control.
Diagnostic potential of retinal neurovascularparameters on CKD stages
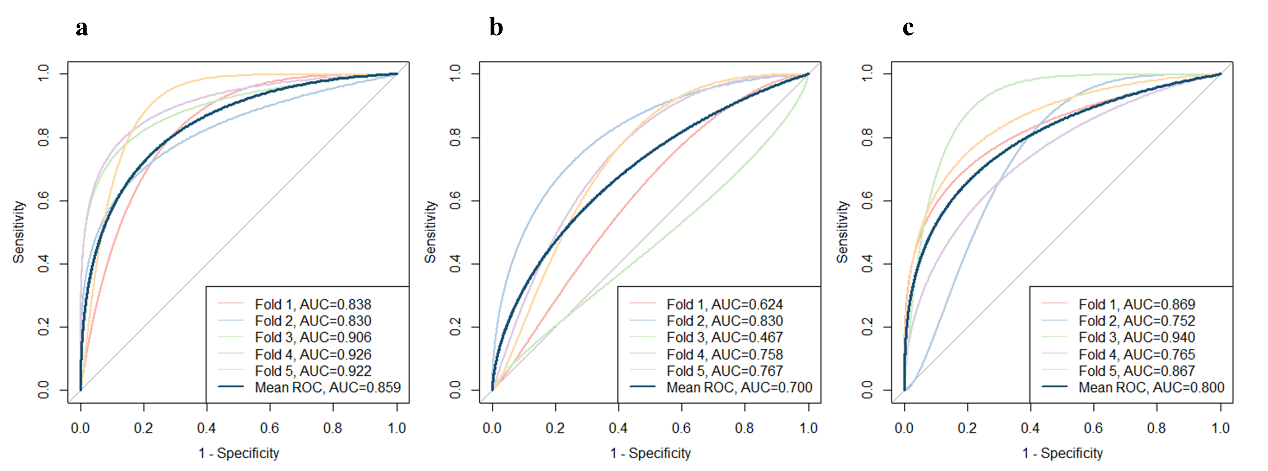
Figure 4 Diagnostic performance of retinal parameters represented by ROC curves
Table S3 Results of logistics regression
|
Models
|
HC vs. CKD |
HC vs. Early CKD |
Early CKD vs. Advanced CKD |
|
Mean AUC (95% CI) |
0.853 (0.795, 0.910) |
0.739 (0.643, 0.834) |
0.800 (0.723, 0.877) |
|
Sensitivity |
0.629 |
0.751 |
0.694 |
|
Specificity |
0.859 |
0.613 |
0.776 |
|
Accuracy |
0.787 |
0.700 |
0.733 |
Five-fold cross validation was applied to testify the models. The AUC of the ROC curves and accuracy were calculated for each fold and the mean value was then calculated.