





HIGHLIGHTS
• Previous studies have indicated that retinal neurovascular deterioration was present in chronic kidney disease (CKD) patients, and such changes could be captured by retinal photographs or optical coherence tomography angiography (OCTA).
• This study expands the knowledge regarding retinal neurovascular changes obtained by OCTA in nondiabetic CKD patients. Our result has proven the diagnostic ability of retinal neurovascular parameters in distinguishing CKD of different stages.
• Our study provided evidence for applying ocular neurovascular data for CKD stratification, screening and long-term management.
INTRODUCTION
Chronic kidney disease (CKD) poses significant global healthcare challenges with an increasing incidence.[1-3] It was estimated that the worldwide prevalence of CKD has reached 9.1%, and the disease accounts for 4.6% of total mortality worldwide.[4] Current evidence suggests that vascular dysfunction, as a prominent pathogenetic factor of CKD, could be a shared contributor to disease progression[5] and systemic complications such as cardiovascular diseases,[6] metabolic disorders[7] and neuropathies.[6,8-9] However, the pathological changes of vessels in the kidneys and related target organs could hardly be assessed by non-invasive methods due to their anatomic nature, limiting further scientific studies and clinical applications regarding vascular mechanisms.
Several retinal vascular imaging methods have been developed in recent years. Optical coherence tomography angiography (OCTA), developed from optical coherence tomography (OCT), represents a novel, rapid, and non-invasive approach for assessing the microvascular structure of the retina.[15-16] OCTA is used to obtain depth-resolved images of blood flow in the retina and choroid and has been proven to be valuable in screening for various diseases.[17] In a series of recent studies, the application of OCT and OCTA in CKD evaluation and management has been explored.[18-21]
MATERIALS AND METHODS
Participants
Ocular examinations and OCTA
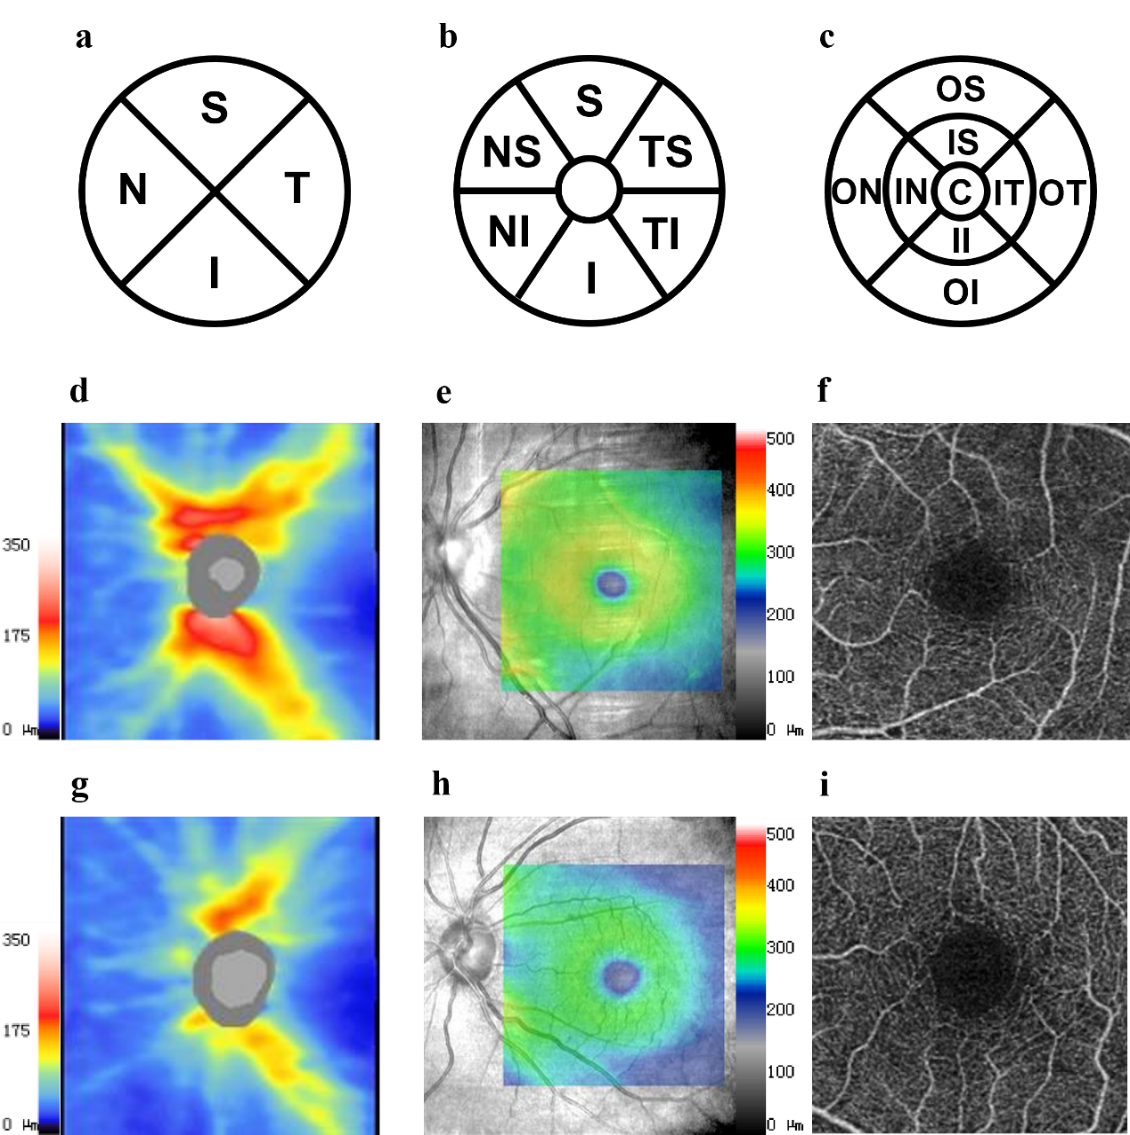
Figure 1 Neurovascular parameters measured using OCT and OCTA
Statistical analysis
RESULTS
Demographic Data
Table 1 Demographic data of the CKD group and the healthy control group
|
Demographic data |
Healthy Control |
Early CKD |
Advanced CKD |
P value |
|
Patients (n) |
62 |
48 |
83 |
|
|
Age (year) |
40.50 (25.25) |
37.87 (19.80) |
48.00 (20.00) |
0.004 |
|
Male (%) |
27 (43.5) |
20 (41.7) |
49 (59.0) |
0.079 |
|
Serum Creatinine (µmol/L) |
- |
78.840 (24.229) |
893.435 (353.338) |
<0.001 |
|
eGFR (ml/min/1.73 m2 ) |
- |
95.833 (19.407) |
12.035 (13.925) |
<0.001 |
|
Smoking (%) |
- |
1 (2.08) |
11 (13.25) |
0.132 |
|
Hypertension (%) |
- |
6 (12.50) |
31 (37.35) |
0.152 |
|
Cardiovascular Diseases (%) |
- |
1 (2.08) |
5 (6.02) |
0.299 |
Age was represented as median (IQR) and was analyzed using the Kruskal−Wallis test. Sex, smoking status, hypertension and cardiovascular diseases were represented as number (percentage) and analyzed by Pearson's chi-square test. BUN, serum creatinine, and eGFR were compared with the Mann−Whitney U test and are represented as the median (IQR). The bold values indicate statistically significant P values (P <0.05). CKD, chronic kidney disease; eGFR, estimated glomerular filtration rate; SD, standard deviation; IQR, interquartile range.
Table S1 Causes of CKD
|
Kidney Disease Diagnosis |
n(%) |
|
Glomerular Diseases |
112 (85.5%) |
|
Immunoglobulin A Nephropathy (IgAN) |
21 (16.0%) |
|
Membranous Nephropathy |
8 (6.1%) |
|
Minimal Change Disease |
5 (3.8%) |
|
Focal Segmental Glomerulosclerosis (FSGS) |
3 (2.3%) |
|
Infection-related Glomerulonephritis |
2 (1.5%) |
|
Membranoproliferative Glomerulonephritis |
2 (1.5%) |
|
Lupus Nephritis |
3 (2.3%) |
|
Unknown |
68 (51.9%) |
|
Obstructive Causes |
9 (6.9%) |
|
Unknown Causes |
10 (7.6%) |
The number of patients diagnosed with each disease is presented as n.
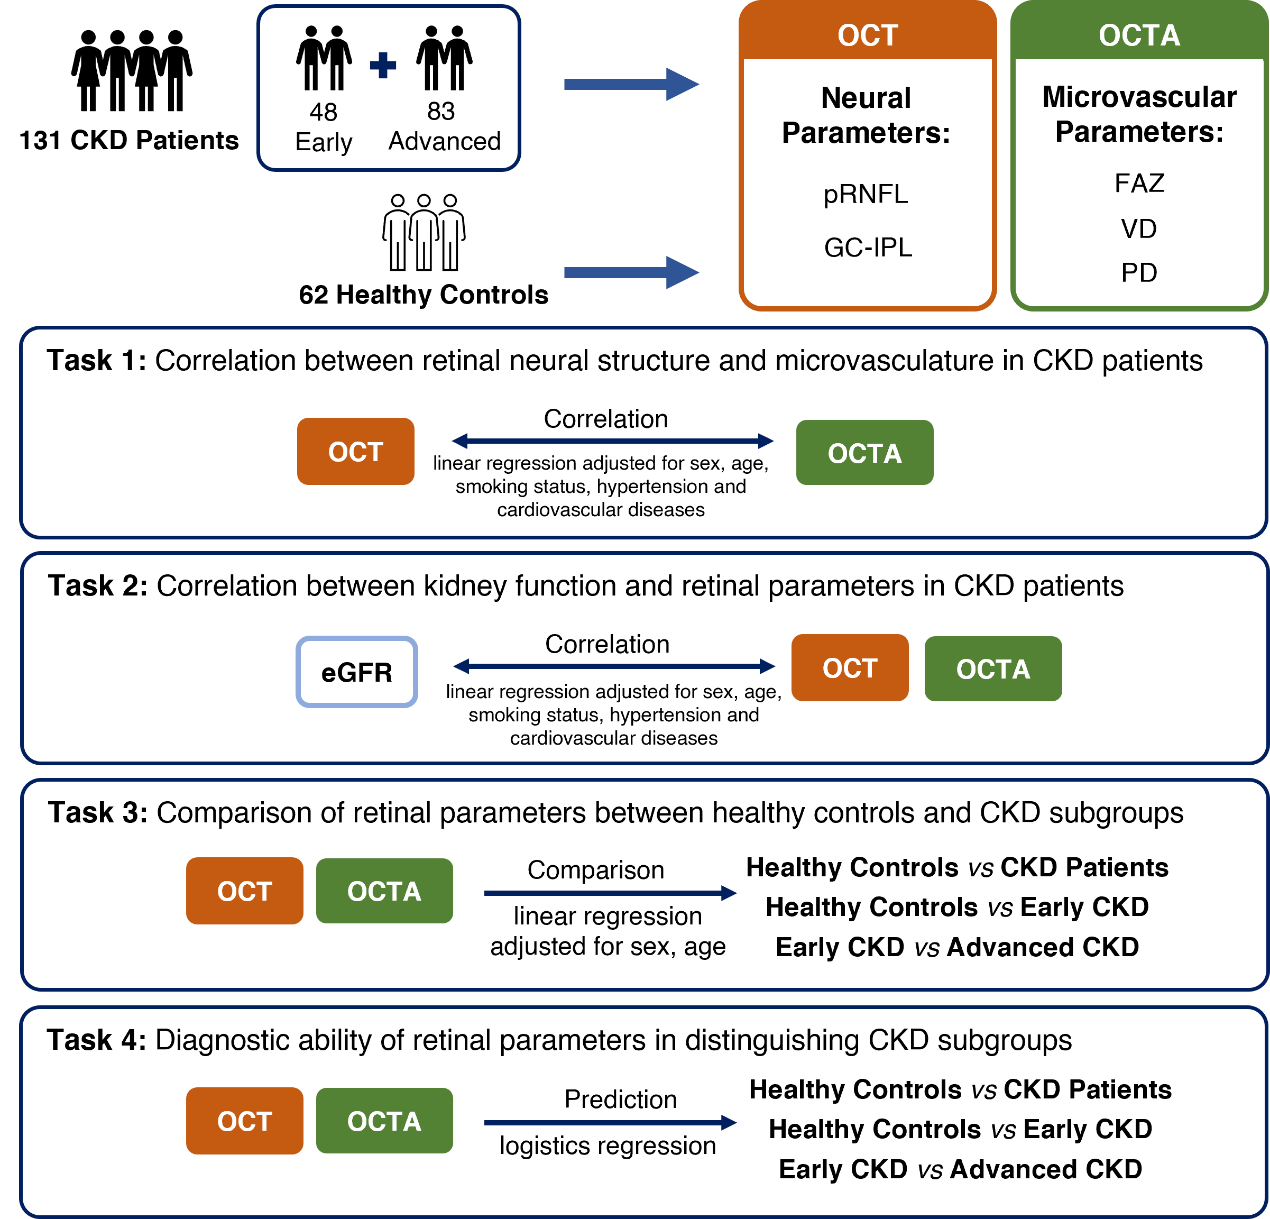
Figure 2 Overview of study participants, retinal parameters and primary outcomes
Retinal neural structure and microvasculature were correlated in CKD patients
Table S2 Correlation between average OCT and OCTA parameters in CKD patients
|
Quadrants |
β† (95% CI) |
Padjusted† |
β‡ (95% CI) |
Padjusted‡ |
|
pRNFL (μm) |
|
|
|
|
|
Average |
0.0508 (0.0179, 0.0837) |
0.033 |
0.0013 (0.0004, 0.0021) |
0.042 |
|
Superior |
0.0213 (0.0011, 0.0416) |
0.464 |
0.0006 (3.78E-05, 0.0011) |
0.429 |
|
Temporal |
0.0352 (0.004, 0.0664) |
0.331 |
0.0009 (4.63E-05, 0.0017) |
0.461 |
|
Inferior |
0.0327 (0.0127, 0.0526) |
0.019 |
0.0008 (0.0003, 0.0013) |
0.025 |
|
Nasal |
0.0271 (-0.0112, 0.0654) |
1.967 |
0.0007 (-0.0003, 0.0016) |
2.320 |
|
GC-IPL (μm) |
|
|
|
|
|
Average |
0.0902 (0.0499, 0.1305) |
< 0.001 |
0.0024 (0.0014, 0.0034) |
< 0.001 |
|
Superior |
0.0600 (0.0234, 0.0965) |
0.018 |
0.0016 (0.0007, 0.0026) |
0.010 |
|
Superior Temporal |
0.0719 (0.0329, 0.1108) |
0.005 |
0.0019 (0.0009, 0.0029) |
0.002 |
|
Inferior temporal |
0.0963 (0.0581, 0.1345) |
< 0.001 |
0.0025 (0.0016, 0.0035) |
< 0.001 |
|
Inferior |
0.0690 (0.0347, 0.1032) |
0.001 |
0.0019 (0.001, 0.0027) |
0.001 |
|
Inferior nasal |
0.0734 (0.0386, 0.1082) |
0.001 |
0.0020 (0.0011, 0.0028) |
< 0.001 |
|
Superior nasal |
0.0631 (0.0267, 0.0994) |
0.010 |
0.0017 (0.0008, 0.0026) |
0.006 |
†Multiple linear regression with average VD.‡Multiple linear regression with average PD.A linear regression model was applied in all subjects. Sex, age, smoking status, hypertension and cardiovascular diseases were covariates entered into the model. The bold values indicate statistically significant after Bonferroni correction.
Retinal neurovascular parameters reflected kidney function deterioration
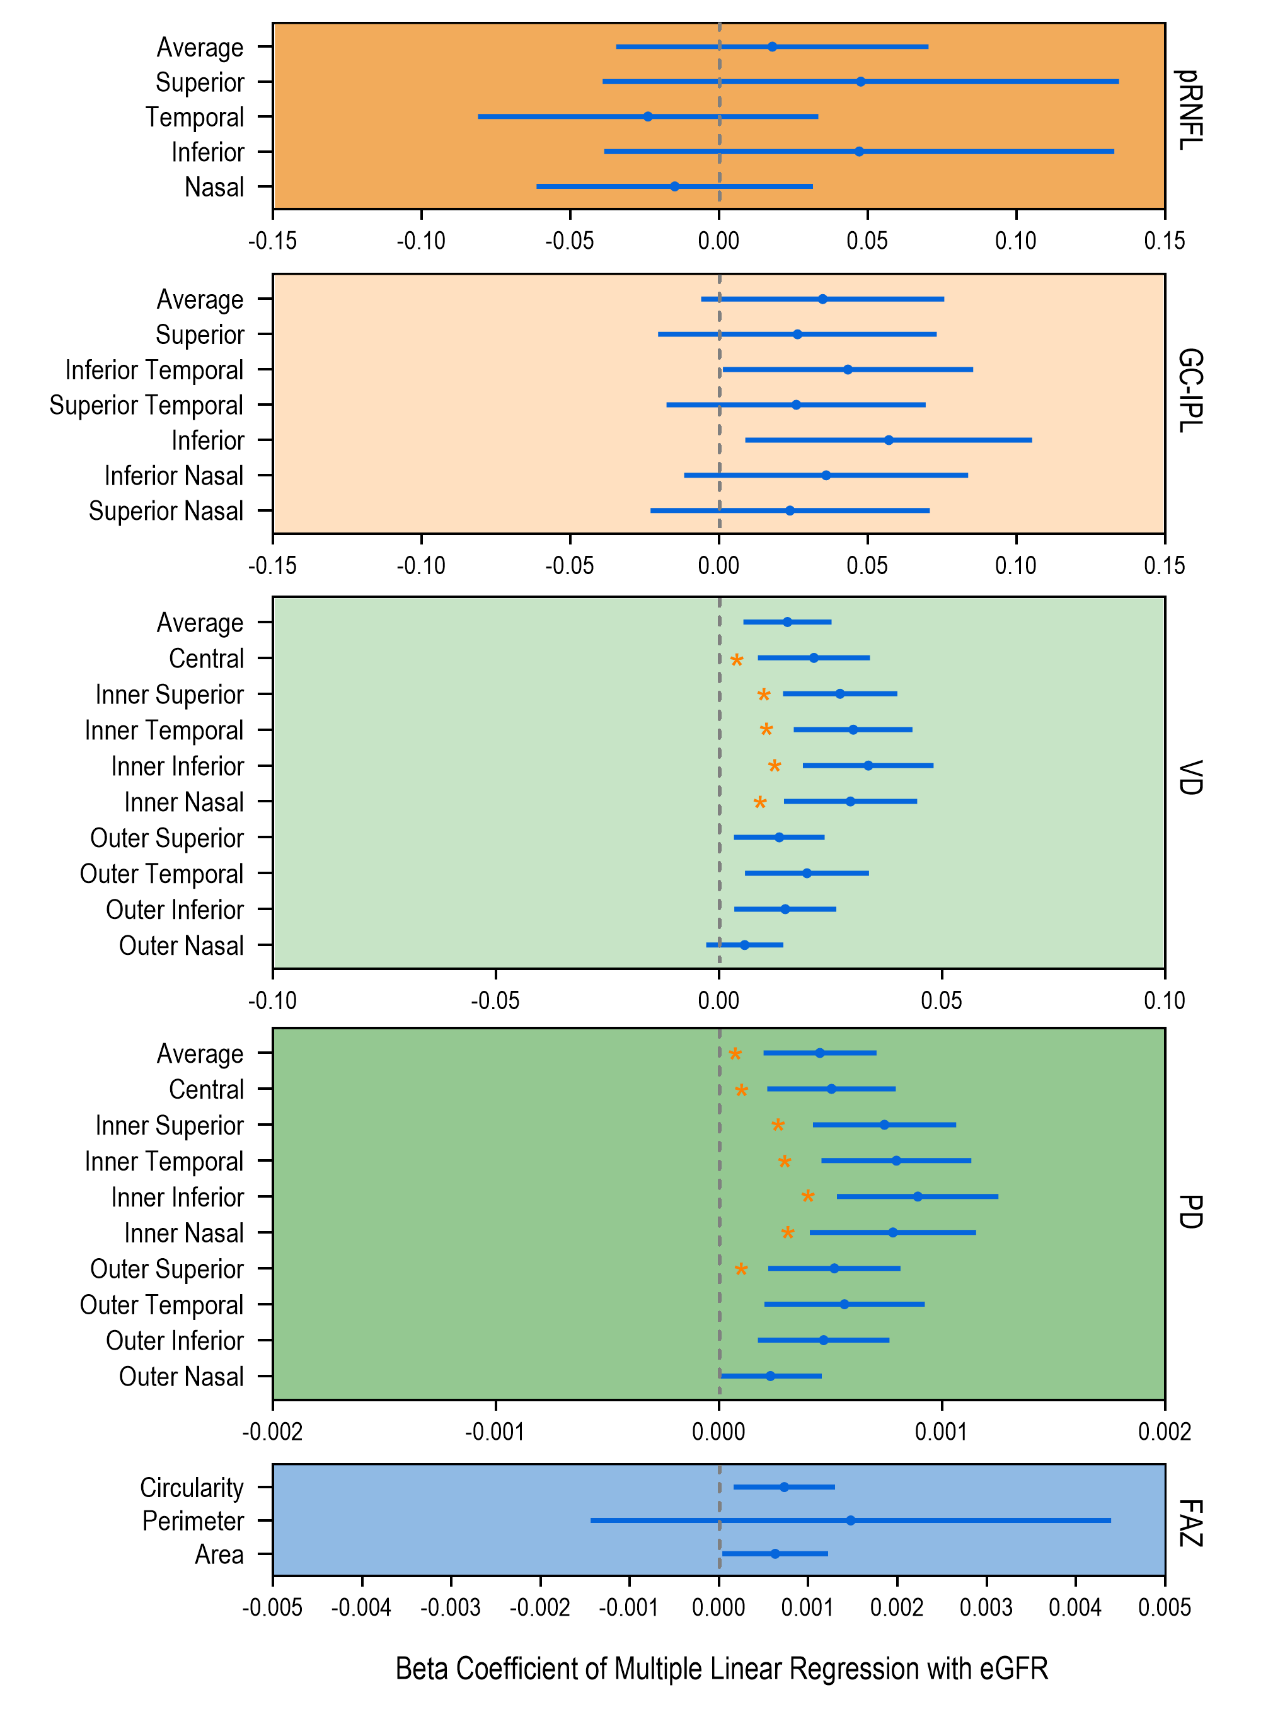
Figure 3 Correlation between eGFR and retinal neurovascular parameters in CKD patients
Structural and angiographic parameters significantly decreased in CKD patients
Table 2 Retinal neural parameters compared between the healthy controls and the different CKD groups
|
Quadrants |
Healthy Control (n=62) |
CKD Group (n=131) |
Early CKD |
Advanced CKD (n=83) |
β† (95% CI) |
β‡ (95% CI) |
β§ (95% CI) |
|
pRNFL (μm) |
|
|
|
|
|
|
|
|
Average |
101.629 ± 8.950 |
94.413 ± 10.450 |
96.396 ± 9.385 |
93.307 ± 10.522 |
-6.725 (-9.782, -3.667) |
-5.238 (-8.754, -1.722) |
-2.226 (-6.117, 1.666) |
|
Superior |
127.758 ± 16.015 |
122.953 ± 17.605 |
126.438 ± 16.523 |
120.678 ± 17.521 |
-3.689 (-8.891, 1.513) |
-1.369 (-7.549, 4.811) |
-3.621 (-10.075, 2.833) |
|
Temporal |
76.774 ± 11.274 |
68.151 ± 11.205 |
68.417 ± 11.605 |
68.635 ± 11.208 |
-8.144 (-11.593, -4.694) |
-8.371 (-12.741, -4.002) |
0.561 (-3.706, 4.828) |
|
Inferior |
130.145 ± 17.615 |
122.142 ± 17.008 |
126.500 ± 13.781 |
119.682 ± 17.558 |
-7.545 (-12.837, -2.253) |
-3.611 (-9.768, 2.546) |
-6.336 (-12.647, -0.025) |
|
Nasal |
72.177 ± 12.599 |
64.024 ± 9.079 |
63.625 ± 10.332 |
64.023 ± 8.089 |
-8.188 (-11.378, -4.997) |
-8.552 (-13.037, -4.068) |
1.047 (-2.407, 4.501) |
|
GC-IPL (μm) |
|
|
|
|
|
|
|
|
Average |
85.226 ± 5.308 |
80.312 ± 8.184 |
83.340 ± 5.490 |
78.347 ± 8.980 |
-4.542 (-6.805, -2.278) |
-1.855 (-3.893, 0.183) |
-4.028 (-7.017, -1.039) |
|
Superior |
85.919 ± 5.795 |
81.219 ± 9.360 |
84.123 ± 5.903 |
78.877 ± 11.381 |
-4.224 (-6.786, -1.662) |
-1.789 (-4.032, 0.453) |
-3.539 (-6.986, -0.092) |
|
Temporal superior |
83.419 ± 5.290 |
78.925 ± 8.647 |
81.349 ± 5.754 |
77.057 ± 10.244 |
-4.127 (-6.489, -1.765) |
-2.031 (-4.083, 0.020) |
-3.089 (-6.301, 0.124) |
|
Temporal inferior |
84.613 ± 5.475 |
79.876 ± 8.475 |
83.103 ± 5.617 |
77.867 ± 9.101 |
-4.454 (-6.800, -2.108) |
-1.447 (-3.473, 0.580) |
-4.461 (-7.543, -1.378) |
|
Inferior |
83.371 ± 5.611 |
77.322 ± 9.628 |
80.995 ± 5.742 |
75.589 ± 10.961 |
-5.847 (-8.49, -3.205) |
-2.360 (-4.532, -0.188) |
-5.614 (-9.142, -2.086) |
|
Nasal inferior |
86.29 ± 5.579 |
81.082 ± 9.583 |
84.297 ± 5.954 |
79.291 ± 10.584 |
-4.720 (-7.320, -2.120) |
-1.964 (-4.134, 0.205) |
-4.13 (-7.639, -0.62) |
|
Nasal superior |
87.871 ± 5.841 |
83.402 ± 9.391 |
86.275 ± 6.127 |
81.267 ± 10.615 |
-4.006 (-6.580, -1.432) |
-1.565 (-3.829, 0.700) |
-3.513 (-6.964, -0.062) |
Table 3 Retinal microvascular parameters compared between the healthy controls and the different CKD groups
|
Quadrants
|
Healthy Control (n=62) |
CKD Group (n=131) |
Early CKD |
Advanced CKD (n=83) |
β† (95% CI) |
β‡ (95% CI) |
β§ (95% CI) |
|
Vessel density (mm-1) |
|||||||
|
Average |
18.308 ± 0.840 |
16.007 ± 2.149 |
17.094 ± 1.262 |
15.285 ± 2.347 |
-2.107 (-2.648, -1.566) |
-1.217 (-1.606, -0.828) |
-1.670 (-2.600, -0.741) |
|
Central |
8.795 ± 2.415 |
6.036 ± 2.566 |
7.102 ± 2.251 |
5.351 ± 2.605 |
-2.659 (-3.433, -1.884) |
-1.689 (-2.574, -0.804) |
-1.422 (-2.141, -0.703) |
|
Inner superior |
18.423 ± 1.032 |
15.903 ± 2.802 |
17.542 ± 1.415 |
14.774 ± 3.066 |
-2.346 (-3.065, -1.627) |
-0.878 (-1.341, -0.414) |
-2.339 (-3.271, -1.408) |
|
Inner temporal |
18.253 ± 1.319 |
15.612 ± 2.884 |
17.325 ± 1.290 |
14.542 ± 3.084 |
-2.502 (-3.261, -1.743) |
-0.928 (-1.427, -0.430) |
-2.666 (-3.622, -1.709) |
|
Inner inferior |
18.248 ± 1.174 |
15.433 ± 3.185 |
17.250 ± 1.759 |
14.307 ± 3.361 |
-2.672 (-3.497, -1.847) |
-0.999 (-1.555, -0.442) |
-2.819 (-3.883, -1.755) |
|
Inner nasal |
18.226 ± 1.417 |
15.554 ± 3.160 |
17.277 ± 1.763 |
14.505 ± 3.352 |
-2.484 (-3.311, -1.657) |
-0.950 (-1.553, -0.347) |
-2.514 (-3.605, -1.424) |
|
Outer superior |
18.745 ± 0.738 |
16.483 ± 2.251 |
17.585 ± 1.166 |
15.733 ± 2.572 |
-2.012 (-2.558, -1.466) |
-1.166 (-1.515, -0.816) |
-1.280 (-2.024, -0.536) |
|
Outer temporal |
17.527 ± 1.492 |
14.971 ± 2.951 |
16.277 ± 1.847 |
14.182 ± 3.140 |
-2.329 (-3.101, -1.557) |
-1.251 (-1.869, -0.633) |
-1.742 (-2.763, -0.721) |
|
Outer inferior |
18.479 ± 1.030 |
16.173 ± 2.457 |
17.185 ± 1.571 |
15.534 ± 2.649 |
-2.107 (-2.735, -1.480) |
-1.297 (-1.776, -0.817) |
-1.314 (-2.155, -0.473) |
|
Outer nasal |
19.915 ± 0.743 |
18.563 ± 1.823 |
19.165 ± 1.202 |
18.092 ± 2.118 |
-1.163 (-1.615, -0.711) |
-0.754 (-1.107, -0.400) |
-0.611 (-1.251, 0.029) |
|
Perfusion density (unitless) |
|||||||
|
Average |
0.448 ± 0.021 |
0.386 ± 0.056 |
0.417 ± 0.032 |
0.367 ± 0.060 |
-0.057 (-0.071, -0.043) |
-0.031 (-0.041, -0.021) |
-0.039 (-0.060, -0.018) |
|
Central |
0.197 ± 0.056 |
0.131 ± 0.059 |
0.156 ± 0.052 |
0.116 ± 0.060 |
-0.063 (-0.081, -0.045) |
-0.041 (-0.061, -0.020) |
-0.041 (-0.059, -0.022) |
|
Inner superior |
0.441 ± 0.028 |
0.376 ± 0.071 |
0.419 ± 0.037 |
0.346 ± 0.076 |
-0.061 (-0.080, -0.043) |
-0.022 (-0.034, -0.010) |
-0.064 (-0.087, -0.041) |
|
Inner temporal |
0.430 ± 0.034 |
0.366 ± 0.073 |
0.410 ± 0.033 |
0.338 ± 0.078 |
-0.061 (-0.080, -0.042) |
-0.020 (-0.033, -0.007) |
-0.070 (-0.094, -0.046) |
|
Inner inferior |
0.434 ± 0.031 |
0.363 ± 0.080 |
0.411 ± 0.046 |
0.334 ± 0.083 |
-0.067 (-0.088, -0.047) |
-0.024 (-0.038, -0.009) |
-0.074 (-0.100, -0.048) |
|
Inner nasal |
0.428 ± 0.036 |
0.363 ± 0.079 |
0.406 ± 0.043 |
0.336 ± 0.084 |
-0.061 (-0.082, -0.041) |
-0.022 (-0.037, -0.007) |
-0.065 (-0.092, -0.037) |
|
Outer superior |
0.467 ± 0.020 |
0.407 ± 0.065 |
0.442 ± 0.049 |
0.384 ± 0.068 |
-0.054 (-0.070, -0.038) |
-0.025 (-0.038, -0.012) |
-0.046 (-0.067, -0.024) |
|
Outer temporal |
0.431 ± 0.040 |
0.362 ± 0.076 |
0.397 ± 0.051 |
0.340 ± 0.080 |
-0.064 (-0.084, -0.043) |
-0.034 (-0.051, -0.017) |
-0.048 (-0.074, -0.021) |
|
Outer inferior |
0.462 ± 0.027 |
0.395 ± 0.064 |
0.425 ± 0.042 |
0.377 ± 0.067 |
-0.062 (-0.078, -0.046) |
-0.037 (-0.050, -0.024) |
-0.041 (-0.063, -0.020) |
|
Outer nasal |
0.486 ± 0.019 |
0.449 ± 0.049 |
0.467 ± 0.030 |
0.436 ± 0.057 |
-0.032 (-0.044, -0.020) |
-0.019 (-0.028, -0.010) |
-0.020 (-0.037, -0.003) |
|
Foveal avascular zone |
|
|
|
|
|
|
|
|
Area (mm2) |
0.297 ± 0.103 |
0.265 ± 0.125 |
0.305 ± 0.116 |
0.245 ± 0.124 |
-0.028 (-0.063, 0.008) |
0.007 (-0.034, 0.049) |
-0.055 (-0.099, -0.011) |
|
Perimeter (mm) |
2.209 ± 0.438 |
2.183 ± 0.594 |
2.292 ± 0.483 |
2.120 ± 0.644 |
-0.007 (-0.174, 0.159) |
0.081 (-0.092, 0.254) |
-0.13 (-0.346, 0.087) |
|
Circularity |
0.750 ± 0.075 |
0.668 ± 0.114 |
0.709 ± 0.942 |
0.644 ± 0.118 |
-0.078 (-0.110, -0.047) |
-0.041 (-0.073, -0.008) |
-0.065 (-0.106, -0.023) |
† Comparison between HC and all CKD. ‡ Comparison between HC and early CKD. §comparison between early and advanced CKD.
The retinal vascular parameters were represented as mean ± SD. A linear regression model was applied to adjust for age and sex, and smoking status, hypertension, and cardiovascular diseases were also adjusted when comparing early and advanced CKD. The bold values indicate statistically significant after Bonferroni correction (P-adjusted< 0.05). CKD, chronic kidney disease; HC, healthy control.
When comparing early CKD with HC, temporal (β = –8.371, Padjusted = 0.009) and nasal pRNFL thickness (β = –8.552, Padjusted = 0.009) were related with CKD. No significant correlation was found between GC-IPL parameters and early CKD. Decrease in VD of all but inner nasal sectors, and PD of all but inner temporal, inferior and nasal sectors were found to be ssociated with early CKD compared with HC.
Further comparison between early and advanced CKD after adjusting for age, sex, smoking status, hypertension and cardiovascular diseases showed that no pRNFL parameters were associated with disease progression. Advanced CKD was correlated with decrease in all GC-IPL parameters; however, the P values were insignificant after adjustment. On the other hand, average VD (β = –1.422, Padjusted = 0.005) and all sectors except outer inferior and outer nasal VD, along with average PD (β = –0.041, Padjusted = 0.000 8) and PD of all but outer nasal sectors decreased significantly as CKD progressed.
Diagnostic potential of retinal neurovascularparameters on CKD stages
We applied logistic regression analysis to determine the diagnostic performance of the OCT and OCTA results.[30] Parameters significantly associated with each intergroup statistical analyzes were selected to enter the logistic regression models. To distinguish CKD patients from HC, the model achieved a mean AUC of 0.853 (0.795 to 0.910). The model differentiating early CKD from HC achieved a mean AUC of 0.739 (0.643 to 0.834), and the model differentiating early and advanced CKD had a mean AUC of 0.800 (0.723 to 0.877). The mean accuracies of the three models were 78.7%, 70.0%, and 73.3%, respectively. The ROC curves are shown in Figure 4. The results of the ROC analysis are presented in Supplementary Table S3.
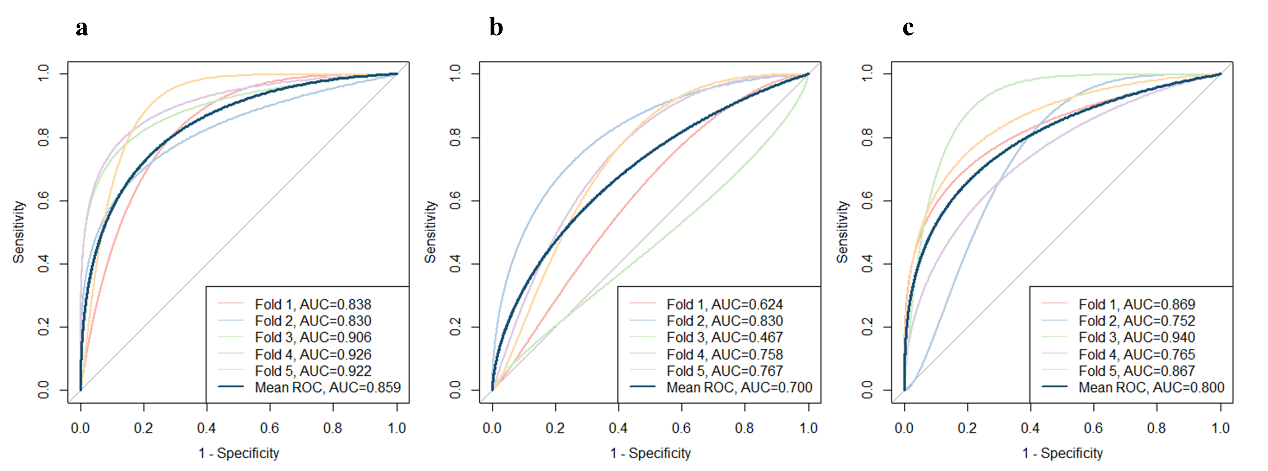
Figure 4 Diagnostic performance of retinal parameters represented by ROC curves
Table S3 Results of logistics regression
|
Models
|
HC vs. CKD |
HC vs. Early CKD |
Early CKD vs. Advanced CKD |
|
Mean AUC (95% CI) |
0.853 (0.795, 0.910) |
0.739 (0.643, 0.834) |
0.800 (0.723, 0.877) |
|
Sensitivity |
0.629 |
0.751 |
0.694 |
|
Specificity |
0.859 |
0.613 |
0.776 |
|
Accuracy |
0.787 |
0.700 |
0.733 |
Five-fold cross validation was applied to testify the models. The AUC of the ROC curves and accuracy were calculated for each fold and the mean value was then calculated.
DISCUSSION
The retina has been proven to be an easily accessible window for observing systemic diseases, such as cardiovascular diseases,[32] diabetes,[33] and CKD.[14] With the development of fast and non-invasive examination methods such as OCT and OCTA, quantitative analysis of retinal structure emerges as an innovative approach for monitoring microvasculature changes in the retina. Consequently, it offers a novel avenue for accessing systemic pathologies. In this study, we identified correlations between kidney function and retinal neurovascular changes in nondiabetic CKD patients. Furthermore, we demonstrated the pattern of neurovascular deterioration in different stages of the disease as compared with healthy controls. Our results also proved the diagnostic value of OCT and OCTA parameters in distinguishing HC, early, and advanced CKD with logistic regression models. Overall, these results suggest that retinal neurovascular changes may reflect the occurrence and progression of nondiabetic CKD, underscoring the importance of retinal non-invasive examinations in CKD management.
Retinal neural and vascular parameters showed a significant positive correlation in nondiabetic CKD patients. The thinning of retinal GC-IPL was associated with the decrease of VD and PD in the superficial vascular plexus (SVP) microvasculature, which primarily aligns with the GC-IPL.[34] First discussed in reference to the central nervous system, the term "neurovascular unit" was coined to describe the interrelationship of neuronal, glial, and vascular cells, which together regulate neuronal activities[35] and microvascular permeability.[36] The retina as a component of the central nervous system also shares similar traits. The dysfunction of either neural or vascular components could cause disturbance in the physiology of the retina, and neurovascular unit defects were reported to contribute to the pathology of diabetic retinopathy.[37-38] Our results showed that similar alterations could be present in nondiabetic CKD patients, implying that the retinal pathologies in CKD patients could be a common consequence of neurovascular dysfunction.
The eGFR, calculated using the CKD-EPI equation, is widely accepted as a credible biomarker of kidney function.[28] Our study revealed a significant relationship between kidney function and retinal manifestations after adjustment for sex and age. Despite having a limited correlation with neural parameters, eGFR was significantly associated with the inner sections of VD and PD, which cover the foveal and parafoveal regions.[39] This result is consistent with previous studies focusing on diabetic CKD patients.[21] However, VD and PD of the outer sections and the FAZ parameters showed no significant correlation with kidney function after adjustment for multiple comparisons. This result indicated that retinal microvascular conditions in the foveal and parafoveal areas could serve as a better indicator of kidney dysfunction than neural parameters in nondiabetic CKD patients.
When comparing HC and different CKD stages, our findings revealed distinct patterns of retinal neurovascular defects in patients of different stages. OCT results revealed a collective decrease in pRNFL and GC-IPL thickness in CKD patients, with the thinning of pRNFL marked the onset and the thinning of GC-IPL indicated disease aggravation. Prior studies showed a higher prevalence of various optic neuropathies in CKD patients,[40] namely uremic optic neuropathy, ischemic optic neuropathy, and complications associated with drug use or infections,[41] which could contribute to defects in the neural structure of the retina. As the thinning of the pRNFL and the GC-IPL reflects axon loss and neuron loss of the retinal ganglion cells respectively,[42] it could be deduced that axonal changes are antecedent in the course of CKD. Moreover, the decrease in pRNFL thickness was only significant in the temporal and nasal sectors. We hypothesize that this phenomenon may be associated with the anatomical features of the parapapillary area, as the temporal and nasal sectors are characterized by relatively sparse capillaries in healthy subjects.[43] Consequently, due to the absence of reserve capacity, these quadrants may be more susceptible to vascular pathologies in CKD, leading to the specific pattern of pRNFL thinning observed in the early stages of the disease.
A significant reduction in VD and PD of the SVP was also observed in CKD patients. The SVP is directly connected to the central retinal artery and supplies all other retinal vascular plexuses through vertical anastomoses;[44] therefore, its condition could faithfully reflect the retinal microcirculation.[34] Yeung et al.[20] previously found that VD in the parafoveal SVP was significantly decreased in CKD patients in comparison with healthy control subjects. Similarly, Wang et al.[21] studied type 2 diabetes mellitus (T2DM) patients and discovered a reduced VD in subjects with CKD. In line with previous studies, our study showed a decrease in retinal vascular density in nondiabetic CKD patients, indicating that vascular function deterioration is independent of diabetic status and could be present in CKD of other causes. Endothelin-1 was identified as a predictor of vascular dysfunction in CKD,[45] which could present as sparse capillaries, reduction in branching, and an increase in tortuosity.[46] Although the role of endothelin in diabetic CKD has been well-established, recent research has also unveiled a significant correlation between endothelin and the pathogenesis of nondiabetic CKD,[47-49] hinting at the possible mechanism of retinal microvascular deterioration in the absence of diabetes. Additionally, the decline in VD and PD in the perifoveal region preceded that of the parafoveal sections. We hypothesize that the parafoveal microcirculation is reserved in the early stages of CKD for it is crucial to satisfy foveal metabolic and functional needs.[39]
Interestingly, nondiabetic CKD patients did not show significant increase in FAZ area, which is a widely proven characteristic of diabetic patients[44,50-51] and was also found presence in CKD patients.[52] On the other hand, nondiabetic CKD patients showed decreased FAZ circularity compared with HC, a characteristic consistent with diabetic patients[24,53] and CKD patients of undefined causes.[20] These results indicated that FAZ enlargement previously found in CKD patients could be caused by diabetes instead of primary kidney dysfunction, and that FAZ acircularity could be a more sensitive marker to reflect CKD pathologies in the retina.
Based on the statistical results, we further examined the capacity of OCT and OCTA parameters to diagnose and stratify nondiabetic CKD through logistic regression models. Our results showed that retinal neurovascular parameters could reach an AUC of 0.853 in distinguishing CKD from HC, and reach an AUC of 0.800 in stratifying CKD patients. We believe that this is the first work to show the clinical diagnostic competency of retinal neurovascular characteristics obtained by OCT and OCTA in nondiabetic CKD patients. Considering these discoveries, we suggest that OCTA parameters could serve as valuable biomarkers in CKD screening and diagnosis.
There are several limitations in the present study. The primary constraint is the cross-sectional nature of the data. We did not clarify the chronological order of retinal neurovascular alterations and kidney damage in our study, thus lacking sufficient evidence to pinpoint the causal relationship between vascular injuries and kidney dysfunction. It is imperative to recruit a larger prospective cohort in future studies to collect longitudinal data and analyze the predictive value of retinal parameters in CKD patients. Secondly, the relatively small sample size also constrained the generalization of our results. Future study should include more diverse participants to testify the validity of our conclusions in different populations. Lastly, given the complex etiology of nondiabetic CKD, it is desirable to expand the sample size and conduct further subgroup analyses targeting different primary kidney diseases in the future.
In summary, this research discovered distinct retinal neurovascular alterations in nondiabetic CKD patients assessed by OCT and OCTA. Retinal parameters exhibited significant correlations with kidney function, and deterioration of the retinal neurovascular structure was evident in both early and advanced CKD patients. In addition, the selected OCT and OCTA parameters were valuable in distinguishing CKD patients from healthy controls and in stratifying early and advanced patients.
Our research addresses a gap in the current literature regarding retinal pathology in nondiabetic CKD patients. Additionally, our findings highlight the credibility of OCT and OCTA as non-invasive methods for screening and longitudinally managing nondiabetic CKD in both clinical and research settings.
Correction notice
Acknowledgement
Author Contributions
Conflict of Interests
The authors disclose that the corresponding author, Haotian Lin, serves as Editor-in-Chief of Eye Science. To avoid any potential conflict of interest, the editorial handling of this manuscript was assigned to an independent editor, and the authors were not involved in the peer-review or decision-making process. All editorial procedures were conducted in accordance with COPE guidelines and the journal's standard policies.
The authors declare no other competing financial or non-financial interests relevant to this work.